Saint-Laurent (electoral district)
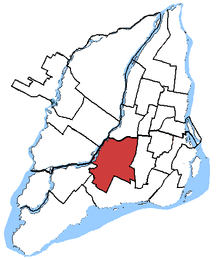 Saint-Laurent—Cartierville in relation to other federal electoral districts in Montreal (2003 boundaries) | |||
| Federal electoral district | |||
| Legislature | House of Commons | ||
| MP |
Liberal | ||
| District created | 1987 | ||
| First contested | 1988 | ||
| Last contested | 2017 | ||
| District webpage | profile, map | ||
| Demographics | |||
| Population (2011)[1] | 93,842 | ||
| Electors (2015) | 68,685 | ||
| Area (km²)[2] | 44 | ||
| Pop. density (per km²) | 2,132.8 | ||
| Census divisions | Montreal | ||
| Census subdivisions | Montreal | ||
Saint-Laurent (formerly Saint-Laurent—Cartierville) is a federal electoral district in Quebec, Canada, that has been represented in the House of Commons of Canada since 1988.
Geography
The district corresponds exactly to the borough of Saint-Laurent in the city of Montreal.
The neighbouring ridings are Ahuntsic-Cartierville, Dorval—Lachine—LaSalle, Mount Royal and Pierrefonds—Dollard.
Demographics
- According to the Canada 2011 Census[3][4]
Ethnic groups: 49.5% White, 15.0% Arab, 8.3% Chinese, 8.1% Black, 6.1% South Asian, 4.8% Southeast Asian, 3.4% Latin American, 1.6% West Asian, 1.5% Filipino
Languages: 32.7% French, 18.0% English, 7.0% Chinese, 4.0% Spanish, 3.5% Greek, 2.1% Vietnamese, 1.9% Italian, 1.9% Armenian, 1.7% Tamil, 1.6% Romanian, 1.1% Creoles, 1.1% Russian, 1.1% Farsi, 1.0% Urdu
Religions: 54.6% Christian (33.8% Catholic, 10.1% Christian Orthodox, 1.0% Pentecostal, 9.7% Other Christian), 17.0% Muslim, 7.4% Jewish, 4.3% Buddhist, 3.2% Hindu, 13.1% None.
Median income: $23,739 (2010)
Average income: $35,647 (2010)
History
The electoral district of Saint-Laurent was created in 1987 from Dollard, Laval-des-Rapides and Saint-Denis. The name was changed to Saint-Laurent—Cartierville in 1989.
This riding lost territory to Ahuntsic-Cartierville during the 2012 electoral redistribution.
It was represented since a by-election in 2017 by Emmanuella Lambropoulos, member of the Liberal Party. It has long been regarded as one of the safest Liberal ridings in the nation.
Members of Parliament
This riding has elected the following Members of Parliament:
| Parliament | Years | Member | Party | |
|---|---|---|---|---|
| Saint-Laurent Riding created from Dollard, Laval-des-Rapides and Saint-Denis |
||||
| 34th | 1988–1993 | Shirley Maheu | Liberal | |
| Saint-Laurent—Cartierville | ||||
| 35th | 1993–1996 | Shirley Maheu | Liberal | |
| 1996–1997 | Stéphane Dion | |||
| 36th | 1997–2000 | |||
| 37th | 2000–2004 | |||
| 38th | 2004–2006 | |||
| 39th | 2006–2008 | |||
| 40th | 2008–2011 | |||
| 41st | 2011–2015 | |||
| Saint-Laurent | ||||
| 42nd | 2015–2017 | Stéphane Dion | Liberal | |
| 2017–Present | Emmanuella Lambropoulos | |||
Election results
Saint-Laurent, 2015–present
| Canadian federal by-election, April 3, 2017 Resignation of Stéphane Dion | ||||||||
|---|---|---|---|---|---|---|---|---|
| Party | Candidate | Votes | % | ±% | ||||
| Liberal | Emmanuella Lambropoulos | 11,461 | 59.13 | −2.44 | ||||
| Conservative | Jimmy Yu | 3,784 | 19.52 | +0.01 | ||||
| Green | Daniel Green | 1,548 | 7.99 | +5.57 | ||||
| New Democratic | Mathieu Auclair | 1,511 | 7.80 | −3.72 | ||||
| Bloc Québécois | William Fayad | 951 | 4.91 | +0.25 | ||||
| Rhinoceros | Chinook Blais-Leduc | 129 | 0.67 | |||||
| Total valid votes/Expense limit | 19,384 | 100.0 | – | |||||
| Total rejected ballots | 255 | 1.30 | +0.30 | |||||
| Turnout | 19,639 | 28.33 | −30.65 | |||||
| Eligible voters | 69,302 | |||||||
| Liberal hold | Swing | −1.24 | ||||||
| Canadian federal election, 2015: Saint-Laurent | ||||||||
|---|---|---|---|---|---|---|---|---|
| Party | Candidate | Votes | % | ±% | Expenditures | |||
| Liberal | Stéphane Dion | 24,832 | 61.57 | +18.71 | $80,361.33 | |||
| Conservative | Jimmy Yu | 7,867 | 19.51 | +0.4 | $126,201.23 | |||
| New Democratic | Alain Ackad | 4,646 | 11.52 | -17.55 | $12,858.35 | |||
| Bloc Québécois | Pascal-Olivier Dumas-Dubreuil | 1,879 | 4.66 | -1.77 | $11,919.73 | |||
| Green | John Tromp | 977 | 2.42 | +0.33 | $1,965.89 | |||
| Marxist–Leninist | Fernand Deschamps | 129 | 0.32 | – | - | |||
| Total valid votes/ | 40,330 | 100.0 | $202,992.54 | |||||
| Total rejected ballots | 409 | 0.59 | – | |||||
| Turnout | 40,739 | 58.98 | – | |||||
| Eligible voters | 69,078 | |||||||
| Source: Elections Canada[5][6] | ||||||||
| 2011 federal election redistributed results[7] | |||
|---|---|---|---|
| Party | Vote | % | |
| Liberal | 13,915 | 42.86 | |
| New Democratic | 9,437 | 29.07 | |
| Conservative | 6,206 | 19.11 | |
| Bloc Québécois | 2,089 | 6.43 | |
| Green | 680 | 2.09 | |
| Others | 140 | 0.43 | |
Saint-Laurent—Cartierville, 1993–2015
| Canadian federal election, 2011 | ||||||||
|---|---|---|---|---|---|---|---|---|
| Party | Candidate | Votes | % | ±% | Expenditures | |||
| Liberal | Stéphane Dion | 17,726 | 43.43 | -18.29 | ||||
| New Democratic | Maria Ximena Florez | 11,948 | 29.28 | +20.30 | ||||
| Conservative | Svetlana Litvin | 7,124 | 17.46 | +0.25 | ||||
| Bloc Québécois | William Fayad | 2,981 | 7.30 | -4.04 | ||||
| Green | Tim Landry | 857 | 2.10 | – | ||||
| Marxist–Leninist | Fernand Deschamps | 176 | 0.43 | -0.30 | ||||
| Total valid votes/Expense limit | 40,812 | 100.00 | ||||||
| Total rejected ballots | 343 | 0.83 | -0.27 | |||||
| Turnout | 41,155 | 51.99 | -1.56 | |||||
| Canadian federal election, 2008 | ||||||||
|---|---|---|---|---|---|---|---|---|
| Party | Candidate | Votes | % | ±% | Expenditures | |||
| Liberal | Stéphane Dion | 25,095 | 61.72 | +1.9 | $46,549 | |||
| Conservative | Dennis Galiatsatos | 6,999 | 17.21 | +4.0 | $20,864 | |||
| Bloc Québécois | Jacques Lachaine | 4,611 | 11.34 | -3.2 | $9,582 | |||
| New Democratic | Jérôme Rodrigues | 3,654 | 8.98 | +1.3 | $1,637 | |||
| Marxist–Leninist | Fernand Deschamps | 299 | 0.73 | +0.3 | ||||
| Total valid votes/Expense limit | 40,658 | 100.00 | $83,858 | |||||
| Total rejected ballots | 454 | 1.10 | ||||||
| Turnout | 41,112 | 53.55 | ||||||
| Canadian federal election, 2006 | ||||||||
|---|---|---|---|---|---|---|---|---|
| Party | Candidate | Votes | % | ±% | Expenditures | |||
| Liberal | Stéphane Dion | 25,412 | 59.8 | -7.0 | $60,159 | |||
| Bloc Québécois | William Fayad | 6,192 | 14.6 | -2.7 | $13,260 | |||
| Conservative | Ishrat Alam | 5,590 | 13.2 | +7.0 | $62,831 | |||
| New Democratic | Liz Elder | 3,279 | 7.7 | +1.5 | $6,611 | |||
| Green | Gilles Mercier | 1,810 | 4.3 | +2.2 | $2,560 | |||
| Marxist–Leninist | Fernand Deschamps | 177 | 0.4 | +0.1 | ||||
| Total valid votes/Expense limit | 42,460 | 100.0 | $79,047 | |||||
| Canadian federal election, 2004 | ||||||||
|---|---|---|---|---|---|---|---|---|
| Party | Candidate | Votes | % | ±% | Expenditures | |||
| Liberal | Stéphane Dion | 28,107 | 66.8 | -6.8 | $57,079 | |||
| Bloc Québécois | William Fayad | 7,261 | 17.3 | +4.2 | $10,494 | |||
| New Democratic | Zaid Mahayni | 2,630 | 6.3 | +3.9 | $11,340 | |||
| Conservative | Marc Rahmé | 2,606 | 6.2 | -3.2 | $10,128 | |||
| Green | Almaz Aladass | 875 | 2.1 | – | $2.67 | |||
| Marijuana | Alex Neron | 298 | 0.7 | |||||
| Marxist–Leninist | Fernand Deschamps | 125 | 0.3 | -0.2 | ||||
| Canadian Action | Ken Fernandez | 84 | 0.2 | -0.3 | $116 | |||
| Communist | Nilda Vargas | 78 | 0.2 | -0.3 | $647 | |||
| Total valid votes/Expense limit | 42,064 | 100.0 | $78,192 | |||||
Note: Conservative vote is compared to the total of the Canadian Alliance vote and Progressive Conservative vote in 2000 election.
| Canadian federal election, 2000: Saint-Laurent—Cartierville | ||||||||
|---|---|---|---|---|---|---|---|---|
| Party | Candidate | Votes | % | ±% | Expenditures | |||
| Liberal | Stéphane Dion | 32,861 | 73.58 | +3.44 | $44,754 | |||
| Bloc Québécois | Yves Beauregard | 5,838 | 13.07 | +0.35 | $11,158 | |||
| Progressive Conservative | J. Pierre Rouleau | 2,308 | 5.17 | −8.74 | $876 | |||
| Alliance | Kaddis R. Sidaros | 1,909 | 4.27 | +2.89 | $8,762 | |||
| New Democratic | Piper Elizabeth Huggins | 1,070 | 2.40 | +0.56 | $908 | |||
| Marxist–Leninist | Jean-Paul Bedard | 234 | 0.52 | $10 | ||||
| Canadian Action | Ken Fernandez | 232 | 0.52 | $3,062 | ||||
| Communist | Oscar Chavez | 206 | 0.46 | $187 | ||||
| Total valid votes | 44,658 | 100.00 | ||||||
| Total rejected ballots | 642 | |||||||
| Turnout | 45,300 | 63.06 | −13.90 | |||||
| Electors on the lists | 71,836 | |||||||
| Canadian Alliance percentages are contrasted with the Reform Party figures from 1997. Sources: Official Results, Elections Canada and Financial Returns, Elections Canada. | ||||||||
| Canadian federal election, 1997: Saint-Laurent—Cartierville | ||||||||
|---|---|---|---|---|---|---|---|---|
| Party | Candidate | Votes | % | ±% | Expenditures | |||
| Liberal | Stéphane Dion | 34,598 | 70.14 | – | $39,617 | |||
| Progressive Conservative | Jean-Martin Masse | 6,861 | 13.91 | $17,038 | ||||
| Bloc Québécois | Yves Beauregard | 6,276 | 12.72 | $20,834 | ||||
| New Democratic | Jeff Itcush | 910 | 1.84 | $850 | ||||
| Reform | Hagop Karlozian | 681 | 1.38 | $1,907 | ||||
| Total valid votes | 49,326 | 100.00 | ||||||
| Total rejected ballots | 781 | |||||||
| Turnout | 50,107 | 76.96 | ||||||
| Electors on the lists | 65,105 | |||||||
| Sources: Official Results, Elections Canada and Financial Returns, Elections Canada. | ||||||||
| Canadian federal by-election, March 25, 1996: Saint-Laurent—Cartierville | ||||||||
|---|---|---|---|---|---|---|---|---|
| Party | Candidate | Votes | % | ±% | Expenditures | |||
| Liberal | Stéphane Dion | 21,336 | 79.3 | +9.5 | ||||
| Bloc Québécois | Michel Sarra-Bournet | 4,000 | 14.9 | -3.8 | ||||
| Progressive Conservative | G. Garo Toubi | 699 | 13.9 | +6.5 | ||||
| Reform | Shaul Petel | 441 | 1.6 | |||||
| Independent | Carole Caron | 229 | 0.9 | |||||
| New Democratic | Sara Mayo | 212 | 0.8 | -1.2 | ||||
| Total valid votes | 26,917 | 100.0% | ||||||
| Liberal hold | Swing | +6.65 | ||||||
| By-election due to the appointment of Shirley Maheu to the Senate on January 31, 1996. | ||||||||
| Canadian federal election, 1993 | ||||||||
|---|---|---|---|---|---|---|---|---|
| Party | Candidate | Votes | % | ±% | ||||
| Liberal | Shirley Maheu | 30,669 | 69.8 | +23.5 | ||||
| Bloc Québécois | Amin Hachem | 8,231 | 18.7 | |||||
| Progressive Conservative | Mark Weiner | 3,254 | 7.4 | -34.1 | ||||
| New Democratic | Francine Poirier | 866 | 2.0 | -7.6 | ||||
| Natural Law | José Torres | 330 | 0.8 | |||||
| National | Roopnarine Singh | 274 | 0.6 | |||||
| Commonwealth of Canada | Monique Lanctôt | 229 | 0.5 | 0.2 | ||||
| Abolitionist | Madelaine Piquette-Bedard | 103 | 0.2 | |||||
| Total valid votes | 43,956 | 100.0 | ||||||
Saint-Laurent, 1988–1993
| Canadian federal election, 1988 | ||||||||
|---|---|---|---|---|---|---|---|---|
| Party | Candidate | Votes | % | |||||
| Liberal | Shirley Maheu | 20,418 | 46.3 | |||||
| Progressive Conservative | Lyse Hubert-Bennett | 18,287 | 41.5 | |||||
| New Democratic | Sid Ingerman | 4,213 | 9.6 | |||||
| Green | Alain Hickson | 765 | 1.7 | |||||
| Independent | Michelle Dufort | 311 | 0.7 | |||||
| Commonwealth of Canada | Joakim Simon | 120 | 0.3 | |||||
| Total valid votes | 44,114 | 100.0 | ||||||
See also
References
- "(Code 24066) Census Profile". 2011 census. Statistics Canada. 2012. Retrieved 2011-03-07.
- Campaign expense data from Elections Canada
Riding history from the Library of Parliament
Notes
- ↑ Statistics Canada: 2011
- ↑ Statistics Canada: 2011
- ↑ http://www12.statcan.gc.ca/nhs-enm/2011/dp-pd/prof/details/page.cfm?Lang=E&Geo1=FED2013&Code1=24068&Data=Count&SearchText=Saint-Laurent&SearchType=Begins&SearchPR=01&A1=All&B1=All&Custom=&TABID=1
- ↑ http://www12.statcan.gc.ca/nhs-enm/2011/dp-pd/prof/details/page.cfm?Lang=E&Geo1=FED2013&Code1=24068&Data=Count&SearchText=Saint-Laurent&SearchType=Begins&SearchPR=01&A1=All&B1=All&Custom=&TABID=1#tabs2
- ↑ Elections Canada – Confirmed candidates for Saint-Laurent, 30 September 2015
- ↑ Elections Canada – Preliminary Election Expenses Limits for Candidates
- ↑ Pundits' Guide to Canadian Elections
.png)