Regional Municipality of Halton
| Halton Region | |||
|---|---|---|---|
| Regional municipality (upper-tier) | |||
| Regional Municipality of Halton | |||
| |||
| Motto(s): Absque labore nihil (Latin for: Nothing without effort) | |||
 Halton Region's location within Ontario. | |||
| Coordinates: 43°28′N 79°52′W / 43.467°N 79.867°WCoordinates: 43°28′N 79°52′W / 43.467°N 79.867°W | |||
| Country |
| ||
| Province |
| ||
| Established (County) | 1854 | ||
| Established (Regional Municipality) | 1974 | ||
| Seat | Oakville | ||
| Government | |||
| • Regional Chair | Gary Carr | ||
| Area[1] | |||
| • Land | 964.01 km2 (372.21 sq mi) | ||
| Population (2016)[1] | |||
| • Total | 548,435 | ||
| • Density | 520.4/km2 (1,348/sq mi) | ||
| Time zone | UTC-5 (EST) | ||
| • Summer (DST) | UTC-4 (EDT) | ||
| Website | www.halton.ca | ||

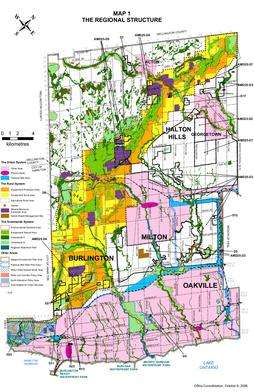
The Regional Municipality of Halton, or Halton Region, is a regional municipality in Ontario, Canada, located in the Golden Horseshoe of Southern Ontario. It comprises the city of Burlington and the towns of Oakville, Milton, and Halton Hills. The region provides policing by the Halton Regional Police Service. The regional council's headquarters are located in Oakville. Burlington and Oakville are largely urban and suburban, while the towns of Milton and Halton Hills are more rural.
Halton is part of the Greater Toronto Area (GTA), although it is the only regional municipality in the GTA that is not situated directly adjacent to Toronto’s city proper. However, the region is split between the census metropolitan areas (CMAs) of Toronto and Hamilton. Burlington is part of the Hamilton CMA, while the rest of the region is part of the Toronto CMA.
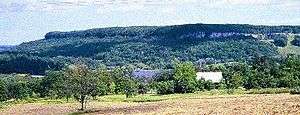
Halton experienced a growth rate of 17.1% between 2001 and 2006, and 14.2% between 2006 and 2011, giving it one of the highest growth rates in the country. Despite the unprecedented growth in residential development, agriculture and protected lands along the Niagara Escarpment are still the predominant land uses in the region. Halton has been ranked by Maclean's national crime ranking report as being the "safest place to live" in the GTA and one of the top five in Canada.[2]
History
The Regional Municipality of Halton was established on 1 January 1974 as the successor to the former Halton County by the Regional Municipality of Halton Act, 1973.[3] From 1 January 2003, it has been governed by the Municipal Act, 2001.[4]
Until the 2000 municipal elections, the Chairman of the Regional Council had been appointed by the Ontario government. From that date, it has been an elective position. Joyce Savoline was the last appointed Chairman, and was elected and reelected as Chairman until her retirement from the position in 2006. The current Regional Chairman is Gary Carr.
Regional Council
The Council consists of the elected Chairman, the mayors of the local municipalities, and regional councillors elected by wards from the local municipalities (who also sit on their respective municipal councils).
The current membership of the council is as follows:
| Chairman | Municipality | Mayor | Regional Councillors |
|---|---|---|---|
| Gary Carr | City of Burlington | Rick Goldring |
|
| Town of Oakville | Rob Burton |
| |
| Town of Milton | Gordon Krantz |
| |
| Town of Halton Hills | Rick Bonnette |
|
Demographics
| Canada census – Regional Municipality of Halton community profile | |||
|---|---|---|---|
| 2011 | 2006 | ||
| Population: | 501,669 (14.2% from 2006) | 439,256 (17.1% from 2001) | |
| Land area: | 964.01 km2 (372.21 sq mi) | 967.17 km2 (373.43 sq mi) | |
| Population density: | 520.4/km2 (1,348/sq mi) | 454.2/km2 (1,176/sq mi) | |
| Median age: | 38.4 (M: 37.6, F: 39.2) | ||
| Total private dwellings: | 182,304 | 162,346 | |
| Median household income: | $83,496 | ||
| References: 2011[1] 2006[5] earlier[6] | |||
| Group | 2011 Census | 2006 Census | 2001 Census | 1996 Census | ||||
|---|---|---|---|---|---|---|---|---|
| Population | % of total | Population | % of Total | Population | % of Total | Population | % of Total | |
| Aboriginal | 2,640 | 0.6 | 1,800 | 0.5 | 1,325 | 0.4 | ||
| Visible Minority | 57,360 | 13.2 | 32,550 | 8.7 | 22,660 | 6.7 | ||
| All other | 375,395 | 86.2 | 338,060 | 90.8 | 313,455 | 92.9 | ||
| Total | 501,669 | 100.0 | 435,395 | 100.0 | 372,410 | 100.0 | 337,440 | 100.0 |
| Group | 2011 Census | 2006 Census | 2001 Census | 1996 Census | ||||
|---|---|---|---|---|---|---|---|---|
| Population | % of total | Population | % of Total | Population | % of Total | Population | % of Total | |
| English | 341,675 | 78.5 | 306,980 | 82.4 | 281,090 | 83.3 | ||
| French | 8,105 | 1.8 | 6,900 | 1.9 | 6,250 | 1.9 | ||
| English and French | 720 | 0.2 | 820 | 0.2 | 720 | 0.2 | ||
| All other | 84,900 | 19.5 | 57,705 | 15.5 | 49,380 | 14.6 | ||
| Total | 435,395 | 100.0 | 372,410 | 100.0 | 337,440 | 100.0 | ||
| Group | 2011 Census | 2006 Census | 2001 Census | 1996 Census | ||||
|---|---|---|---|---|---|---|---|---|
| Population | % of total | Population | % of Total | Population | % of Total | Population | % of Total | |
| At the same address | 228,860 | 56.2 | 198,690 | 56.8 | 184,295 | 58.7 | ||
| In the same municipality | 71,335 | 17.5 | 130,000 | 37.2 | 58,560 | 18.7 | ||
| In the same province | 85,130 | 20.9 | 55,380 | 17.7 | ||||
| From another province | 6,720 | 1.6 | 1,920 | 4.3 | 8,270 | 2.6 | ||
| From another country | 15,360 | 3.8 | 7,235 | 2.3 | ||||
| Total aged 5 or over | 407,405 | 100.0 | 349,670 | 100.0 | 313,745 | 100.0 | ||
Economy
Labour force
| 2011 | 2006 | 2001 | 1996 | |
|---|---|---|---|---|
| Participation rate | 71.9% | 72.1% | 76.8% | |
| Employment rate | 68.5% | 69.3% | 72.8% | |
| Unemployment rate | 4.7% | 4.0% | 5.1% |
| 2011 | 2006 | 2001 | 1996 | |
|---|---|---|---|---|
| Agriculture and resources | 4,180 | 3,935 | 2,870 | |
| Construction | 12,060 | 41,540 | 8,085 | |
| Manufacturing | 31,635 | 33,235 | ||
| Wholesale trade | 18,915 | 38,440 | 14,760 | |
| Retail trade | 27,245 | 22,175 | ||
| Financial and real estate | 23,030 | 19,550 | 16,150 | |
| Health care and social services | 19,535 | 29,935 | 15,870 | |
| Educational services | 17,060 | 13,250 | ||
| Business services | 53,975 | 45,120 | 31,045 | |
| Other services | 39,565 | 32,935 | 31,490 | |
| Total | 247,200 | 211,455 | 188,930 |
Agriculture
| Type | 2011 | 2006 | 2001 | ||||||||||
|---|---|---|---|---|---|---|---|---|---|---|---|---|---|
| Halton Hills | Milton | Burlington | Oakville | Total | % change | Halton Hills | Milton | Burlington | Oakville | Total[7] | % change | Total | |
| Number of farms | 169 | 209 | 70 | 21 | 469 | 206 | 260 | 79 | 21 | 566 | 619 | ||
| Total area of farms (in hectares) | 15,436 | 11,289 | 3,259 | 2,216 | 32,200 | 16,747 | 12,592 | 4,306 | 2,331 | 35,976 | 39,966 | ||
| Area of land in crops | 12,507 | 8,288 | 2,106 | 2,057 | 24,958 | 13,353 | 8,741 | 3,084 | 2,133 | 27,311 | 30,469 | ||
| Gross farm receipts ($ millions) | 39.99 | 57.36 | 23.24 | 3.35 | 123.94 | 57.75 | 40.52 | 30.61 | 3.16 | 132.04 | 141.47 | ||
| Total cattle and calves | 2,672 | 1,854 | x | x | 4,907 | 3,571 | 2,725 | 3,919 | 0 | 10,215 | 11,581 | ||
| Total pigs | x | x | x | x | x | N/A | x | x | x | x | 3,508 | 6,254 | |
x = suppressed for reasons of confidentiality
Geography
While the urban areas of Burlington, Oakville and Milton are experiencing rapid growth, there is still a significant proportion of the Region that is still rural, most of which is protected as part of the provincial Greenbelt or as part of the Niagara Escarpment Plan.
Halton is somewhat unusual, in that it has three distinct climate zones within its relatively small area,[8] which are as follows:
- Zone 5a - Halton Hills lying to the north of the Niagara Escarpment, together with the Town of Milton within the Grand River watershed
- Zone 5b - the remainder of Halton Hills, Milton north of Derry Road, and that part of Burlington lying north of the Niagara Escarpment
- Zone 6a - the southern remainder of the Region
Climate charts
| GEORGETOWN WWTP | ||||||||||||||||||||||||||||||||||||||||||||||||||||||||||||
|---|---|---|---|---|---|---|---|---|---|---|---|---|---|---|---|---|---|---|---|---|---|---|---|---|---|---|---|---|---|---|---|---|---|---|---|---|---|---|---|---|---|---|---|---|---|---|---|---|---|---|---|---|---|---|---|---|---|---|---|---|
| Climate chart (explanation) | ||||||||||||||||||||||||||||||||||||||||||||||||||||||||||||
| ||||||||||||||||||||||||||||||||||||||||||||||||||||||||||||
| ||||||||||||||||||||||||||||||||||||||||||||||||||||||||||||
| BURLINGTON TS | ||||||||||||||||||||||||||||||||||||||||||||||||||||||||||||
|---|---|---|---|---|---|---|---|---|---|---|---|---|---|---|---|---|---|---|---|---|---|---|---|---|---|---|---|---|---|---|---|---|---|---|---|---|---|---|---|---|---|---|---|---|---|---|---|---|---|---|---|---|---|---|---|---|---|---|---|---|
| Climate chart (explanation) | ||||||||||||||||||||||||||||||||||||||||||||||||||||||||||||
| ||||||||||||||||||||||||||||||||||||||||||||||||||||||||||||
| ||||||||||||||||||||||||||||||||||||||||||||||||||||||||||||
| OAKVILLE SE WPCP | ||||||||||||||||||||||||||||||||||||||||||||||||||||||||||||
|---|---|---|---|---|---|---|---|---|---|---|---|---|---|---|---|---|---|---|---|---|---|---|---|---|---|---|---|---|---|---|---|---|---|---|---|---|---|---|---|---|---|---|---|---|---|---|---|---|---|---|---|---|---|---|---|---|---|---|---|---|
| Climate chart (explanation) | ||||||||||||||||||||||||||||||||||||||||||||||||||||||||||||
| ||||||||||||||||||||||||||||||||||||||||||||||||||||||||||||
| ||||||||||||||||||||||||||||||||||||||||||||||||||||||||||||
| Climate data for Burlington (1981–2010) | |||||||||||||
|---|---|---|---|---|---|---|---|---|---|---|---|---|---|
| Month | Jan | Feb | Mar | Apr | May | Jun | Jul | Aug | Sep | Oct | Nov | Dec | Year |
| Record high °C (°F) | 15.0 (59) |
18.0 (64.4) |
27.0 (80.6) |
32.0 (89.6) |
35.0 (95) |
37.2 (99) |
39.0 (102.2) |
37.2 (99) |
36.1 (97) |
31.1 (88) |
26.7 (80.1) |
22.0 (71.6) |
39.0 (102.2) |
| Average high °C (°F) | −0.6 (30.9) |
0.8 (33.4) |
5.2 (41.4) |
12.4 (54.3) |
19.4 (66.9) |
25.0 (77) |
28.0 (82.4) |
26.7 (80.1) |
21.8 (71.2) |
15.1 (59.2) |
8.0 (46.4) |
2.4 (36.3) |
13.7 (56.7) |
| Daily mean °C (°F) | −4.4 (24.1) |
−3.2 (26.2) |
1.0 (33.8) |
7.5 (45.5) |
13.9 (57) |
19.4 (66.9) |
22.5 (72.5) |
21.4 (70.5) |
16.9 (62.4) |
10.4 (50.7) |
4.4 (39.9) |
−1 (30) |
9.1 (48.4) |
| Average low °C (°F) | −8.1 (17.4) |
−7.1 (19.2) |
−3.3 (26.1) |
2.6 (36.7) |
8.3 (46.9) |
13.8 (56.8) |
16.9 (62.4) |
16.1 (61) |
11.9 (53.4) |
5.7 (42.3) |
0.7 (33.3) |
−4.3 (24.3) |
4.4 (39.9) |
| Record low °C (°F) | −29.4 (−20.9) |
−27 (−17) |
−23.9 (−11) |
−13.9 (7) |
−2.8 (27) |
1.1 (34) |
5.6 (42.1) |
3.0 (37.4) |
−1.1 (30) |
−7.8 (18) |
−16.1 (3) |
−27 (−17) |
−29.4 (−20.9) |
| Average precipitation mm (inches) | 66.0 (2.598) |
54.5 (2.146) |
61.6 (2.425) |
70.6 (2.78) |
81.0 (3.189) |
69.1 (2.72) |
75.3 (2.965) |
82.0 (3.228) |
83.1 (3.272) |
71.9 (2.831) |
84.9 (3.343) |
63.0 (2.48) |
863.1 (33.98) |
| Average rainfall mm (inches) | 31.8 (1.252) |
33.0 (1.299) |
44.7 (1.76) |
68.2 (2.685) |
81.0 (3.189) |
69.1 (2.72) |
75.3 (2.965) |
82.0 (3.228) |
83.1 (3.272) |
71.9 (2.831) |
79.7 (3.138) |
43.5 (1.713) |
763.3 (30.051) |
| Average snowfall cm (inches) | 34.2 (13.46) |
21.5 (8.46) |
16.9 (6.65) |
2.4 (0.94) |
0.0 (0) |
0.0 (0) |
0.0 (0) |
0.0 (0) |
0.0 (0) |
0.0 (0) |
5.3 (2.09) |
19.5 (7.68) |
99.9 (39.33) |
| Average precipitation days (≥ 0.2 mm) | 12.4 | 9.6 | 11.0 | 12.5 | 11.8 | 10.9 | 10.1 | 10.2 | 10.9 | 10.7 | 13.9 | 11.9 | 135.8 |
| Average rainy days (≥ 0.2 mm) | 4.9 | 4.5 | 8.0 | 11.7 | 11.8 | 10.9 | 10.1 | 10.2 | 10.9 | 10.7 | 12.7 | 7.7 | 113.9 |
| Average snowy days (≥ 0.2 cm) | 8.1 | 6.0 | 3.6 | 0.84 | 0.0 | 0.0 | 0.0 | 0.0 | 0.0 | 0.0 | 1.6 | 5.4 | 25.5 |
| Source: Environment Canada[12] | |||||||||||||
| Climate data for Georgetown WWTP (Halton Hills), 1981−2010 | |||||||||||||
|---|---|---|---|---|---|---|---|---|---|---|---|---|---|
| Month | Jan | Feb | Mar | Apr | May | Jun | Jul | Aug | Sep | Oct | Nov | Dec | Year |
| Record high °C (°F) | 17.0 (62.6) |
15.5 (59.9) |
25.0 (77) |
31.5 (88.7) |
34.5 (94.1) |
36.0 (96.8) |
37.0 (98.6) |
36.5 (97.7) |
35.5 (95.9) |
29.5 (85.1) |
22.0 (71.6) |
20.5 (68.9) |
37.0 (98.6) |
| Average high °C (°F) | −1.7 (28.9) |
−0.2 (31.6) |
4.6 (40.3) |
12.1 (53.8) |
19.1 (66.4) |
24.4 (75.9) |
26.9 (80.4) |
25.8 (78.4) |
21.4 (70.5) |
14.3 (57.7) |
7.3 (45.1) |
1.1 (34) |
12.9 (55.2) |
| Daily mean °C (°F) | −6.3 (20.7) |
−5.2 (22.6) |
−0.9 (30.4) |
6.0 (42.8) |
12.3 (54.1) |
17.4 (63.3) |
20.0 (68) |
19.0 (66.2) |
14.8 (58.6) |
8.4 (47.1) |
2.8 (37) |
−2.9 (26.8) |
7.1 (44.8) |
| Average low °C (°F) | −10.9 (12.4) |
−10.2 (13.6) |
−6.4 (20.5) |
−0.2 (31.6) |
5.3 (41.5) |
10.4 (50.7) |
13.0 (55.4) |
12.1 (53.8) |
8.1 (46.6) |
2.4 (36.3) |
−1.7 (28.9) |
−6.9 (19.6) |
1.3 (34.3) |
| Record low °C (°F) | −33.0 (−27.4) |
−31.5 (−24.7) |
−28.0 (−18.4) |
−13.0 (8.6) |
−5.0 (23) |
−0.5 (31.1) |
3.0 (37.4) |
0.0 (32) |
−4.0 (24.8) |
−8.5 (16.7) |
−15.5 (4.1) |
−29.5 (−21.1) |
−33.0 (−27.4) |
| Average precipitation mm (inches) | 67.8 (2.669) |
60.0 (2.362) |
57.2 (2.252) |
76.5 (3.012) |
79.3 (3.122) |
74.8 (2.945) |
73.5 (2.894) |
79.3 (3.122) |
86.2 (3.394) |
68.3 (2.689) |
88.5 (3.484) |
65.9 (2.594) |
877.4 (34.543) |
| Average rainfall mm (inches) | 29.7 (1.169) |
28.4 (1.118) |
35.2 (1.386) |
71.3 (2.807) |
79.0 (3.11) |
74.8 (2.945) |
73.5 (2.894) |
79.3 (3.122) |
86.2 (3.394) |
67.8 (2.669) |
79.9 (3.146) |
36.4 (1.433) |
741.5 (29.193) |
| Average snowfall cm (inches) | 38.1 (15) |
31.7 (12.48) |
22.1 (8.7) |
5.2 (2.05) |
0.3 (0.12) |
0.0 (0) |
0.0 (0) |
0.0 (0) |
0.0 (0) |
0.5 (0.2) |
8.6 (3.39) |
29.5 (11.61) |
135.9 (53.5) |
| Average precipitation days (≥ 0.2 mm) | 12.6 | 9.4 | 10.6 | 12.4 | 11.9 | 11.2 | 10.6 | 10.6 | 11.7 | 12.3 | 13.3 | 12.3 | 138.9 |
| Average rainy days (≥ 0.2 mm) | 4.1 | 4.1 | 6.4 | 11.6 | 11.8 | 11.2 | 10.6 | 10.6 | 11.7 | 12.2 | 11.4 | 6.5 | 112.1 |
| Average snowy days (≥ 0.2 cm) | 9.4 | 6.2 | 4.8 | 1.4 | 0.04 | 0.0 | 0.0 | 0.0 | 0.0 | 0.27 | 2.5 | 6.9 | 31.5 |
| Source: Environment Canada[13] | |||||||||||||
| Climate data for Oakville Southeast WCPC (1981–2010) | |||||||||||||
|---|---|---|---|---|---|---|---|---|---|---|---|---|---|
| Month | Jan | Feb | Mar | Apr | May | Jun | Jul | Aug | Sep | Oct | Nov | Dec | Year |
| Record high °C (°F) | 13.9 (57) |
15.6 (60.1) |
27.5 (81.5) |
32.0 (89.6) |
33.0 (91.4) |
38.0 (100.4) |
37.0 (98.6) |
37.5 (99.5) |
35.0 (95) |
28.9 (84) |
23.3 (73.9) |
22.0 (71.6) |
38.0 (100.4) |
| Average high °C (°F) | −0.4 (31.3) |
0.6 (33.1) |
4.7 (40.5) |
11.3 (52.3) |
17.9 (64.2) |
23.2 (73.8) |
26.3 (79.3) |
25.2 (77.4) |
20.9 (69.6) |
14.3 (57.7) |
8.3 (46.9) |
2.8 (37) |
12.9 (55.2) |
| Daily mean °C (°F) | −4.7 (23.5) |
−3.9 (25) |
0.1 (32.2) |
6.4 (43.5) |
12.3 (54.1) |
17.7 (63.9) |
20.9 (69.6) |
20.1 (68.2) |
15.6 (60.1) |
9.3 (48.7) |
4.0 (39.2) |
−1.3 (29.7) |
8.1 (46.6) |
| Average low °C (°F) | −8.9 (16) |
−8.3 (17.1) |
−4.5 (23.9) |
1.5 (34.7) |
6.8 (44.2) |
12.1 (53.8) |
15.4 (59.7) |
15.0 (59) |
10.2 (50.4) |
4.3 (39.7) |
−0.2 (31.6) |
−5.5 (22.1) |
3.2 (37.8) |
| Record low °C (°F) | −30.0 (−22) |
−25.0 (−13) |
−22.0 (−7.6) |
−14.4 (6.1) |
−3.3 (26.1) |
1.1 (34) |
7.0 (44.6) |
3.0 (37.4) |
−1.7 (28.9) |
−7.0 (19.4) |
−14.0 (6.8) |
−27.0 (−16.6) |
−30.0 (−22) |
| Average precipitation mm (inches) | 59.8 (2.354) |
46.7 (1.839) |
54.4 (2.142) |
65.2 (2.567) |
73.9 (2.909) |
71.0 (2.795) |
75.8 (2.984) |
78.3 (3.083) |
73.5 (2.894) |
70.0 (2.756) |
79.3 (3.122) |
58.8 (2.315) |
806.7 (31.76) |
| Average rainfall mm (inches) | 31.5 (1.24) |
30.7 (1.209) |
37.2 (1.465) |
63.1 (2.484) |
73.9 (2.909) |
71.0 (2.795) |
75.8 (2.984) |
78.3 (3.083) |
73.5 (2.894) |
70.0 (2.756) |
76.8 (3.024) |
43.9 (1.728) |
725.6 (28.567) |
| Average snowfall cm (inches) | 28.3 (11.14) |
16.1 (6.34) |
17.2 (6.77) |
2.1 (0.83) |
0.0 (0) |
0.0 (0) |
0.0 (0) |
0.0 (0) |
0.0 (0) |
0.0 (0) |
2.5 (0.98) |
14.9 (5.87) |
81.0 (31.89) |
| Average precipitation days (≥ 0.2 mm) | 9.6 | 7.2 | 9.0 | 11.1 | 10.4 | 10.3 | 8.8 | 9.8 | 10.2 | 10.4 | 11.1 | 9.7 | 117.6 |
| Average rainy days (≥ 0.2 mm) | 4.4 | 3.8 | 6.4 | 10.6 | 10.4 | 10.3 | 8.8 | 9.8 | 10.2 | 10.4 | 10.6 | 6.8 | 102.4 |
| Average snowy days (≥ 0.2 cm) | 5.6 | 3.7 | 3.2 | 0.7 | 0.0 | 0.0 | 0.0 | 0.0 | 0.0 | 0.0 | 1.0 | 3.4 | 17.6 |
| Source: Environment Canada[14] | |||||||||||||
See also
References
- 1 2 3 "Halton Regional municipality census profile". 2011 Census of Population. Statistics Canada. Retrieved 2012-03-26.
- ↑ Halton Region Ranked Safest Place to Live in GTA, Top 5 in Canada
- ↑ Regional Municipality of Halton Act, 1973, S.O. 1973, c. 70
- ↑ Municipal Act, 2001, S.O. 2001, c. 25
- ↑ "2006 Community Profiles". Canada 2006 Census. Statistics Canada. March 30, 2011. Retrieved 2012-02-02.
- ↑ "2001 Community Profiles". Canada 2001 Census. Statistics Canada. February 17, 2012.
- ↑ "2006 Agricultural community profile". Retrieved 2012-02-15.
- ↑ "Plant Hardiness Zones of Canada". Archived from the original on 2009-07-17. Retrieved 2009-07-17.
- ↑ "Canadian Climate Normals 1971-2000". Environment Canada. Retrieved February 15, 2012.
- ↑ "Canadian Climate Normals 1971-2000". Environment Canada. Retrieved February 15, 2012.
- ↑ "Canadian Climate Normals 1971-2000". Environment Canada. Retrieved February 15, 2012.
- ↑ "Burlington TS". Canadian Climate Normals 1981–2010. Environment Canada. Retrieved 2014-04-09.
- ↑ "Georgetown WWTP". Canadian Climate Normals 1981–2010. Environment Canada. Retrieved 2015-02-17.
- ↑ "Oakville Southeast WCPC". Canadian Climate Normals 1981–2010. Environment Canada. Retrieved 2013-10-12.
External links
| Wikimedia Commons has media related to Regional Municipality of Halton. |
Places adjacent to Regional Municipality of Halton | ||||||||||
|---|---|---|---|---|---|---|---|---|---|---|
| ||||||||||
Largest city: Toronto | ||
| Regions | 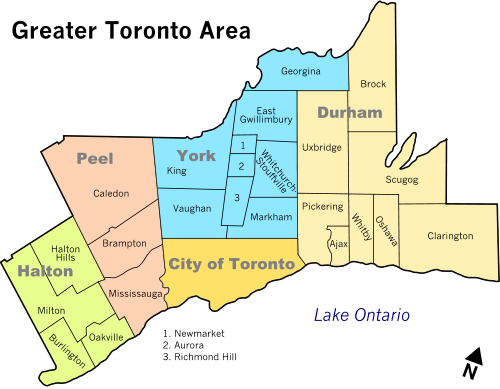 | |
| Cities | ||
| Towns | ||
| Townships and municipalities | ||
| Regions | |
|---|---|
| Counties | |
| Districts | |
| Regional municipalities | |
| Single-tier municipalities | |
| Separated municipalities | |
| |