List of countries and dependencies by population
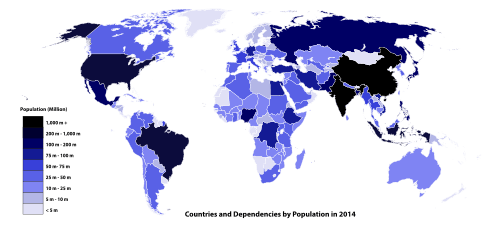
This is a list of countries and dependent territories by population. It includes sovereign states, inhabited dependent territories and, in some cases, constituent countries of sovereign states, with inclusion within the list being primarily based on the ISO standard ISO 3166-1. For instance, the United Kingdom is considered as a single entity while the constituent countries of the Kingdom of the Netherlands are considered separately. In addition, this list includes certain states with limited recognition not found in ISO 3166-1.
The population figures do not reflect the practice of countries that report significantly different populations of citizens domestically and overall. Some countries, notably Thailand, do not report total population, exclusively counting citizens; for total populations an international agency must issue an estimate.
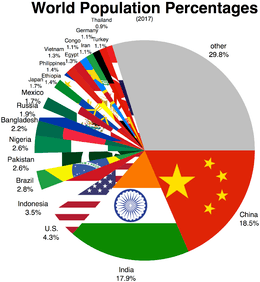
Also given in percent is each country's population compared with the population of the world, which the United Nations estimates at 7.66 billion as of today.
Method
Figures used in this chart are based on the most up to date estimate or projections[1] by the national census authority where available, and are usually rounded off. Where updated national data are not available, figures are based on the projections for 2018 by the Population Division of the United Nations Department of Economic and Social Affairs.[2]
Because the compiled figures are not collected at the same time in every country, or at the same level of accuracy, the resulting numerical comparisons may create misleading conclusions. Furthermore, the addition of figures from all countries may not equal the world total. A handful of nations have not conducted a census in over 30 years, providing high error margin estimates only.
Areas that form integral parts of sovereign states, such as the countries of the United Kingdom, are counted as part of the sovereign states concerned. Not included are other entities, such as the European Union,[Note 1] that are not sovereign states, and independent territories that do not have permanent populations, such as various countries' claims to Antarctica.
Sovereign states and dependencies by population
Note: All dependent territories or constituent countries that are parts of sovereign states are shown in italics and not assigned a numbered rank.
| Rank | Country (or dependent territory) | Population | Date | % of world population | Source |
|---|---|---|---|---|---|
| 1 | 1,394,720,000 | October 20, 2018 | 18.2% | Official population clock | |
| 2 | 1,338,480,000 | October 20, 2018 | 17.5% | Official population clock | |
| 3 | 328,031,000 | October 20, 2018 | 4.28% | Official population clock | |
| 4 | 265,015,300 | July 1, 2018 | 3.46% | Official annual projection | |
| 5 | 209,737,000 | October 20, 2018 | 2.74% | Official population clock | |
| 6 | 202,389,000 | October 20, 2018 | 2.64% | Official population clock | |
| 7 | 193,392,517 | July 1, 2016 | 2.53% | Official estimate | |
| 8 | 165,390,000 | October 20, 2018 | 2.16% | Official population clock | |
| 9 | 146,877,088 | January 1, 2018 | 1.92% | Official estimate | |
| 10 | 126,420,000 | September 1, 2018 | 1.65% | Monthly provisional estimate | |
| 11 | 124,737,789 | July 1, 2018 | 1.63% | Official annual projection | |
| 12 | 107,534,882 | July 1, 2018 | 1.4% | UN Projection | |
| 13 | 106,637,000 | October 20, 2018 | 1.39% | Official population clock | |
| 14 | 97,756,300 | October 20, 2018 | 1.28% | Official population clock | |
| 15 | 94,660,000 | July 1, 2018 | 1.24% | Official annual estimate | |
| 16 | 84,004,989 | July 1, 2018 | 1.1% | UN Projection | |
| 17 | 82,793,800 | March 31, 2018 | 1.08% | Official quarter data | |
| 18 | 81,885,100 | October 20, 2018 | 1.07% | Official population clock | |
| 19 | 80,810,525 | December 31, 2017 | 1.06% | Official estimate | |
| 20 | 69,183,173 | July 1, 2018 | 0.9% | UN Projection | |
| 21 | 67,323,000 | September 1, 2018 | 0.88% | Monthly official estimate | |
| 22 | 66,040,229 | June 30, 2017 | 0.86% | Official annual estimate | |
| 23 | 60,421,460 | April 30, 2018 | 0.79% | Monthly official estimate | |
| 24 | 57,725,600 | July 1, 2018 | 0.75% | Official annual estimate | |
| 25 | 54,199,163 | July 1, 2018 | 0.71% | Official annual projection | |
| 26 | 53,862,731 | July 1, 2018 | 0.7% | Official annual projection | |
| 27 | 51,635,256 | July 1, 2018 | 0.67% | Official annual estimate | |
| 28 | 50,950,879 | July 1, 2018 | 0.67% | UN projection | |
| 29 | 49,999,800 | October 20, 2018 | 0.653% | Official population clock | |
| 30 | 46,659,302 | January 1, 2018 | 0.61% | Official estimate | |
| 31 | 44,494,502 | July 1, 2018 | 0.58% | Official annual projection | |
| 32 | 42,545,964 | July 1, 2018 | 0.56% | Official annual projection | |
| 33 | 42,248,129 | August 1, 2018 | 0.55% | Monthly official estimate | |
| 34 | 40,919,910 | October 20, 2018 | 0.53% | Official population clock | |
| 35 | 39,339,753 | July 1, 2018 | 0.51% | UN projection | |
| 36 | 38,823,100 | July 1, 2018 | 0.51% | Official annual projection | |
| 37 | 38,433,600 | December 31, 2017 | 0.5% | Official estimate | |
| 38 | 37,259,400 | October 20, 2018 | 0.486% | Official population clock | |
| 39 | 34,819,900 | October 20, 2018 | 0.455% | Official population clock | |
| 40 | 33,413,660 | January 1, 2018 | 0.44% | Official estimate | |
| 41 | 32,653,900 | January 1, 2018 | 0.43% | Official annual estimate | |
| 42 | 32,503,000 | October 20, 2018 | 0.424% | Official population clock | |
| 43 | 32,162,184 | June 30, 2018 | 0.42% | Official estimate | |
| 44 | 31,828,110 | July 1, 2018 | 0.42% | Official annual projection | |
| 45 | 31,575,018 | July 1, 2018 | 0.41% | Official annual estimate | |
| 46 | 29,614,337 | January 1, 2018 | 0.39% | Official projection | |
| 47 | 29,250,009 | January 1, 2018 | 0.38% | Official projection | |
| 48 | 29,218,867 | July 1, 2018 | 0.38% | Official annual projection | |
| 49 | 28,915,284 | July 1, 2018 | 0.38% | UN projection | |
| 50 | 28,861,863 | August 1, 2017 | 0.38% | Official census result | |
| 51 | 26,262,810 | July 1, 2018 | 0.34% | UN projection | |
| 52 | 25,610,672 | July 1, 2018 | 0.33% | UN projection | |
| 53 | 25,097,700 | October 20, 2018 | 0.328% | Official population clock | |
| 54 | 24,571,044 | July 1, 2017 | 0.32% | Official estimate | |
| 55 | 23,794,164 | January 1, 2018 | 0.31% | Official annual projection | |
| 56 | 23,577,488 | September 1, 2018 | 0.31% | Monthly official estimate | |
| 57 | 21,466,863 | July 1, 2018 | 0.28% | Official annual projection | |
| 58 | 21,444,000 | July 1, 2017 | 0.28% | Official estimate | |
| 59 | 20,244,080 | July 1, 2018 | 0.26% | Official annual projection | |
| 60 | 19,524,000 | January 1, 2018 | 0.25% | Official annual estimate | |
| 61 | 19,107,706 | July 1, 2018 | 0.25% | UN projection | |
| 62 | 18,311,700 | September 1, 2018 | 0.24% | Official estimate | |
| 63 | 18,284,407 | July 1, 2018 | 0.24% | UN projection | |
| 64 | 17,931,637 | July 1, 2018 | 0.23% | Official annual projection | |
| 65 | 17,574,003 | April 19, 2017 | 0.23% | Final or definitive 2017 census result | |
| 66 | 17,302,084 | July 1, 2018 | 0.23% | Official annual projection | |
| 67 | 17,264,200 | October 20, 2018 | 0.225% | Official population clock | |
| 68 | 17,097,800 | October 20, 2018 | 0.223% | Official population clock | |
| 69 | 16,887,720 | July 1, 2018 | 0.22% | Official annual projection | |
| 70 | 16,069,921 | July 1, 2018 | 0.21% | Official annual projection | |
| 71 | 15,726,037 | July 1, 2018 | 0.21% | Official annual projection | |
| 72 | 15,353,184 | July 1, 2018 | 0.2% | UN projection | |
| 73 | 15,181,925 | July 1, 2018 | 0.2% | UN projection | |
| 74 | 14,848,905 | July 1, 2018 | 0.19% | Official annual projection | |
| 75 | 12,323,419 | July 1, 2018 | 0.16% | Official annual projection | |
| 76 | 12,001,136 | July 1, 2018 | 0.16% | Official projection annual | |
| 77 | 11,883,516 | July 1, 2018 | 0.16% | Official projection | |
| 78 | 11,446,300 | July 1, 2017 | 0.15% | Official estimate | |
| 79 | 11,420,163 | August 1, 2018 | 0.15% | Monthly official estimate | |
| 80 | 11,362,269 | July 1, 2018 | 0.15% | Official projection | |
| 81 | 11,307,314 | July 1, 2018 | 0.15% | Official projection annual | |
| 82 | 11,221,060 | December 31, 2017 | 0.15% | Official annual estimate | |
| 83 | 11,112,945 | July 1, 2018 | 0.15% | UN projection | |
| 84 | 10,768,193 | January 1, 2017 | 0.14% | Official estimate | |
| 85 | 10,681,186 | July 1, 2018 | 0.14% | Official annual projection | |
| 86 | 10,625,449 | June 30, 2018 | 0.14% | Official quarterly estimate | |
| 87 | 10,291,027 | December 31, 2017 | 0.13% | Official annual estimate | |
| 88 | 10,266,149 | July 1, 2018 | 0.13% | Official projection | |
| 89 | 10,264,900 | October 20, 2018 | 0.134% | Official population clock | |
| 90 | 10,196,177 | August 31, 2018 | 0.13% | Official monthly estimate | |
| 91 | 9,943,226 | August 1, 2018 | 0.13% | Official estimate | |
| 92 | 9,771,000 | January 1, 2018 | 0.13% | Official annual estimate | |
| 93 | 9,582,340 | October 13, 2018 | 0.13% | Worldometers | |
| 94 | 9,478,200 | July 1, 2018 | 0.12% | Official quarterly estimate | |
| 95 | 9,012,229 | July 1, 2018 | 0.12% | Official annual projection | |
| 96 | 8,931,000 | January 1, 2018 | 0.12% | Official estimate | |
| 97 | 8,933,050 | October 20, 2018 | 0.117% | Official population clock | |
| 98 | 8,838,171 | July 1, 2018 | 0.12% | Quarterly provisional figure | |
| 99 | 8,558,800 | July 1, 2018 | 0.11% | Official annual estimate | |
| 100 | 8,508,904 | June 30, 2018 | 0.11% | Official provisional figure | |
| 101 | 7,719,729 | July 1, 2018 | 0.101% | UN projection | |
| – | 7,448,900 | July 1, 2018 | 0.097% | Official estimate | |
| 102 | 7,352,000 | July 1, 2018 | 0.096% | Official annual projection | |
| 103 | 7,052,983 | January 1, 2018 | 0.092% | Official estimate | |
| 104 | 7,050,034 | December 31, 2017 | 0.092% | Official estimate | |
| 105 | 7,001,444 | January 1, 2018 | 0.091% | Official annual estimate | |
| 106 | 6,961,210 | July 1, 2018 | 0.091% | UN projection | |
| 107 | 6,643,359 | July 1, 2018 | 0.087% | Official annual projection | |
| 108 | 6,470,956 | July 1, 2018 | 0.084% | UN projection | |
| 109 | 6,309,300 | June 1, 2018 | 0.082% | Official annual estimate | |
| 110 | 6,284,757 | July 1, 2018 | 0.082% | UN projection | |
| 111 | 6,093,509 | July 1, 2018 | 0.08% | UN projection | |
| 112 | 5,851,466 | July 1, 2018 | 0.076% | UN projection | |
| 113 | 5,789,957 | July 1, 2018 | 0.076% | Official quarterly estimate | |
| 114 | 5,638,700 | June 30, 2018 | 0.074% | Official estimate | |
| 115 | 5,519,463 | August 31, 2018 | 0.072% | Official monthly estimate | |
| 116 | 5,443,120 | January 1, 2018 | 0.071% | Official estimate | |
| 117 | 5,399,895 | July 1, 2018 | 0.071% | UN projection | |
| 118 | 5,312,343 | July 1, 2018 | 0.069% | Official quarterly estimate | |
| 119 | 5,187,948 | July 1, 2018 | 0.068% | UN projection | |
| 120 | 5,003,393 | June 30, 2018 | 0.065% | Official annual projection | |
| 121 | 4,912,560 | October 20, 2018 | 0.0641% | Official population clock | |
| 122 | 4,857,000 | April 1, 2018 | 0.063% | Official estimate | |
| 123 | 4,780,978 | December 1, 2017 | 0.062% | Official census result | |
| 124 | 4,737,423 | July 1, 2018 | 0.062% | UN projection | |
| 125 | 4,651,706 | September 29, 2018 | 0.061% | Official estimate | |
| 126 | 4,382,387 | July 1, 2018 | 0.057% | Official projection[Note 14] | |
| 127 | 4,226,920 | January 1, 2018 | 0.055% | Official annual estimate | |
| 128 | 4,158,783 | July 1, 2018 | 0.054% | Official annual projection | |
| 129 | 4,105,493 | December 31, 2017 | 0.054% | Official estimate | |
| 130 | 3,984,233 | July 1, 2018 | 0.052% | Official annual projection | |
| 131 | 3,729,600 | January 1, 2018 | 0.049% | Official annual estimate | |
| 132 | 3,550,900 | January 1, 2017 | 0.046% | Official estimate | |
| 133 | 3,511,372 | June 30, 2016 | 0.046% | Official estimate | |
| 134 | 3,505,985 | June 30, 2018 | 0.046% | Official annual projection | |
| – | 3,337,177 | July 1, 2017 | 0.044% | Official estimate | |
| 135 | 3,232,050 | October 20, 2018 | 0.042% | Official population clock | |
| 136 | 2,969,800 | June 30, 2018 | 0.039% | Official quarterly estimate | |
| 137 | 2,870,324 | January 1, 2018 | 0.037% | Official annual estimate | |
| 138 | 2,797,184 | October 1, 2018 | 0.037% | Monthly official estimate | |
| 139 | 2,728,864 | December 31, 2017 | 0.036% | Official estimate | |
| 140 | 2,561,643 | August 31, 2018 | 0.033% | Monthly official estimate | |
| 141 | 2,413,643 | July 1, 2018 | 0.032% | Official projection | |
| 142 | 2,302,878 | July 1, 2018 | 0.03% | Official annual projection | |
| 143 | 2,263,010 | July 1, 2018 | 0.03% | UN projection | |
| 144 | 2,163,765 | July 1, 2018 | 0.028% | UN projection | |
| 145 | 2,075,301 | December 31, 2017 | 0.027% | Official estimate | |
| 146 | 2,067,561 | July 1, 2018 | 0.027% | UN projection | |
| 147 | 2,067,284 | April 1, 2018 | 0.027% | Official estimate | |
| 148 | 1,923,400 | September 1, 2018 | 0.025% | Monthly official estimate | |
| – | 1,798,506 | December 31, 2017 | 0.023% | Official annual estimate | |
| 149 | 1,584,763 | July 1, 2018 | 0.021% | Official annual projection | |
| 150 | 1,496,300 | July 1, 2018 | 0.02% | Official annual projection | |
| 151 | 1,359,193 | July 1, 2018 | 0.018% | Official estimate | |
| 152 | 1,319,133 | January 1, 2018 | 0.017% | Official estimate | |
| 153 | 1,264,887 | July 1, 2017 | 0.017% | Official estimate | |
| 154 | 1,261,407 | July 1, 2018 | 0.016% | Official projection | |
| 155 | 1,222,442 | July 4, 2015 | 0.016% | Preliminary 2015 census result | |
| 156 | 1,159,250 | July 1, 2018 | 0.015% | Official projection | |
| 157 | 1,049,001 | July 1, 2018 | 0.014% | Official annual projection | |
| 158 | 884,887 | September 17, 2017 | 0.012% | Official census result | |
| 159 | 854,800 | December 31, 2016 | 0.011% | Official estimate | |
| 160 | 850,688 | July 1, 2018 | 0.011% | Official estimate | |
| 161 | 782,225 | July 1, 2018 | 0.0102% | UN projection | |
| 162 | 727,145 | May 30, 2017 | 0.009% | Official census result | |
| 163 | 667,044 | July 1, 2018 | 0.0087% | Official annual projection | |
| – | 658,900 | June 30, 2018 | 0.0086% | Official quarterly estimate | |
| 164 | 622,359 | January 1, 2018 | 0.0081% | Official estimate | |
| 165 | 602,005 | January 1, 2018 | 0.0079% | Official estimate | |
| 166 | 568,301 | July 1, 2018 | 0.0074% | UN projection | |
| – | 567,421 | July 1, 2018 | 0.0074% | UN projection | |
| 167 | 544,081 | July 1, 2018 | 0.0071% | Official annual projection | |
| 168 | 475,701 | December 31, 2017 | 0.0062% | Official estimate | |
| – | 470,600 | July 1, 2016 | 0.0061% | Official estimate | |
| 169 | 422,678 | July 1, 2016 | 0.0055% | Official estimate | |
| 170 | 395,882 | April 1, 2018 | 0.0052% | Official estimate | |
| 171 | 381,320 | July 1, 2018 | 0.005% | Official annual projection | |
| 172 | 378,114 | December 31, 2017 | 0.0049% | Official annual estimate | |
| 173 | 353,070 | June 30, 2018 | 0.0046% | Official quarterly estimate | |
| – | 335,455 | July 1, 2016 | 0.0044% | Official estimate | |
| 174 | 304,500 | July 1, 2018 | 0.004% | Official annual estimate | |
| 175 | 286,388 | July 1, 2018 | 0.0037% | UN projection | |
| – | 278,500 | January 1, 2017 | 0.0036% | Official annual estimate | |
| – | 275,918 | August 17, 2017 | 0.0036% | 2017 census results | |
| – | 240,705 | February 28, 2011 | 0.0031% | 2011 census result | |
| 176 | 199,052 | July 1, 2018 | 0.0026% | Official projection | |
| 177 | 197,700 | July 1, 2017 | 0.0026% | Official estimate | |
| 178 | 179,667 | July 1, 2018 | 0.0023% | UN projection | |
| – | 172,400 | July 1, 2018 | 0.0023% | Official annual estimate | |
| – | 160,337 | January 1, 2017 | 0.0021% | Official annual estimate | |
| – | 145,053 | December 1, 2015 | 0.0019% | 2015 census result | |
| 179 | 120,100 | July 1, 2018 | 0.0016% | Official annual estimate | |
| – | 111,350 | March 31, 2018 | 0.0015% | Official quarterly estimate | |
| 180 | 109,557 | July 1, 2015 | 0.0014% | Official estimate | |
| 181 | 105,300 | July 1, 2018 | 0.0014% | Official annual estimate | |
| – | 104,914 | July 1, 2018 | 0.0014% | UN projection | |
| – | 104,200 | December 31, 2016 | 0.0014% | Official estimate | |
| 182 | 103,328 | May 12, 2011 | 0.0013% | 2011 census result | |
| 183 | 100,651 | November 30, 2016 | 0.0013% | 2016 census result | |
| 184 | 94,205 | December 31, 2016 | 0.0012% | Official estimate | |
| 185 | 86,295 | May 27, 2011 | 0.0011% | Preliminary 2011 census result | |
| – | 83,314 | April 24, 2016 | 0.0011% | 2016 census result | |
| 186 | 78,264 | December 31, 2016 | 0.001% | Official estimate | |
| 187 | 71,293 | May 14, 2011 | 0.00093% | Preliminary 2011 census result | |
| – | 64,420 | March 31, 2018 | 0.00084% | Official estimate | |
| – | 63,779 | May 21, 2016 | 0.00083% | 2016 Census Preliminary Report | |
| – | 62,723 | March 31, 2016 | 0.00082% | Official estimate | |
| – | 56,700 | July 1, 2018 | 0.00074% | Official annual estimate | |
| – | 56,200 | July 1, 2018 | 0.00073% | Official annual estimate | |
| – | 56,025 | July 1, 2018 | 0.00073% | Official estimate | |
| 188 | 55,500 | July 1, 2018 | 0.00072% | Official annual estimate | |
| – | 53,532 | October 15, 2015 | 0.0007% | Preliminary 2015 census result | |
| – | 51,258 | August 1, 2018 | 0.00067% | Monthly official estimate | |
| 189 | 46,204 | May 15, 2011 | 0.0006% | 2011 census result | |
| – | 39,410 | January 1, 2016 | 0.00051% | Official estimate | |
| 190 | 38,300 | December 31, 2017 | 0.0005% | Official annual estimate | |
| 191 | 38,111 | December 31, 2017 | 0.0005% | Official semi annual estimate | |
| – | 37,910 | July 1, 2016 | 0.00049% | Official estimate | |
| – | 36,457 | January 1, 2015 | 0.00048% | Official estimate | |
| – | 33,573 | December 31, 2015 | 0.00044% | Official estimate | |
| 192 | 33,344 | May 31, 2018 | 0.00044% | Monthly official estimate | |
| – | 28,514 | July 1, 2013 | 0.00037% | Official estimate | |
| – | 18,100 | December 1, 2016 | 0.00024% | 2016 Census Preliminary Report | |
| 193 | 17,900 | July 1, 2018 | 0.00023% | Official annual estimate | |
| – | 13,452 | May 11, 2011 | 0.00018% | Preliminary 2011 census result | |
| – | 11,700 | July 1, 2018 | 0.00015% | Official annual estimate | |
| 194 | 10,640 | November 4, 2012 | 0.00014% | 2012 census result | |
| 195 | 10,084 | October 30, 2011 | 0.00013% | 2011 census result | |
| – | 9,417 | January 1, 2015 | 0.00012% | Official estimate | |
| – | 6,286 | January 1, 2015 | 0.000082% | Official estimate | |
| – | and Tristan da Cunha (UK) |
5,633 | February 7, 2016 | 0.000074% | 2016 census result |
| – | 4,922 | May 12, 2011 | 0.000064% | 2011 census result | |
| – | 3,198 | October 9, 2016 | 0.000042% | 2016 census result | |
| – | 1,843 | August 9, 2016 | 0.000024% | 2016 census result | |
| – | 1,748 | August 9, 2016 | 0.000023% | 2016 census result | |
| – | 1,611 | September 10, 2011 | 0.000021% | 2011 census result | |
| – | 1,499 | October 18, 2016 | 0.000020% | 2016 census result | |
| 196 | 800 | January 1, 2014 | 0.000010% | Official estimate | |
| – | 544 | August 9, 2016 | 0.0000071% | 2016 census result | |
| – | 50 | January 1, 2018 | 0.00000065% | Official estimate |
See also
- List of continents by population
- List of countries and dependencies by population density
- List of countries by past and future population
- List of countries by population growth rate
- List of countries by population (United Nations)
- List of countries by refugee population
- List of countries by urban population
- List of regional organizations by population
- List of religious populations
- List of sovereign states and dependencies by total fertility rate
- Various lists of countries by population
- World population
Lists of countries by population
Continental
Intercontinental
Notes
- ↑ The European Union is a sui generis supranational union whose sovereign members delegate to it by treaty certain powers that are often exercised by sovereign states. Its combined population has been estimated at 510,284,430 on January 1, 2016, and it would be ranked 3rd if it were included in the list. It has 6.66% of the world's population — see "Eurostat-Tables, Graphs and Maps Interface(TGM)table". European Commission.
- ↑ The census figure refers to mainland China, excluding its special administrative regions of Hong Kong and Macau, the former of which returned to Chinese sovereignty on 1 July 1997 and the latter on 20 December 1999.
- ↑ Does not include the figures of Lakshadweep and Andaman and Nicobar Islands.
- ↑ Population of the 50 states and the District of Columbia.
- ↑ Including the Republic of Crimea and Sevastopol, Russia's disputed administrative areas on the Crimean Peninsula. The Ukrainian government and many of the world's other states consider the Crimean Peninsula de jure a part of Ukraine's territory.
- ↑ Population of the 18 regions of France. Excluding Overseas Territories and Collectivities: French Polynesia, New Caledonia, French Southern and Antarctic Lands, Clipperton Island, Saint Barthélemy, Saint Martin, Saint Pierre and Miquelon and Wallis and Futuna.
- ↑ Excluding the 14 Overseas Territories, which are shown separately.
- ↑ Including Zanzibar.
- ↑ Excluding the Autonomous Republic of Crimea and City of Sevastopol, Ukraine's administrative areas on the Crimean Peninsula which are disputed with and de facto administered by Russia. However includes all territory in the Donbass region where there are ongoing insurgencies by separatist forces.
- ↑ Excluding the population of the disputed territory of Western Sahara (Sahrawi Arab Democratic Republic).
- ↑ Taiwan (Republic of China) also includes the minor islands of Kinmen, Matsu, Penghu, etc.
- ↑ Includes Puntland and Somaliland.
- ↑ Excludes Kosovo.
- ↑ Medium Variant
- ↑ Excludes Abkhazia (242,862, census 2011) and South Ossetia (53,559, census 2015).
- ↑ Excludes Transnistria.
- ↑ Kosovo is the subject of a territorial dispute between the Republic of Kosovo and the Republic of Serbia. The Republic of Kosovo unilaterally declared independence on 17 February 2008, but Serbia continues to claim it as part of its own sovereign territory. The two governments began to normalise relations in 2013, as part of the Brussels Agreement. Kosovo has received formal recognition as an independent state from 113 out of 193 United Nations member states.
- ↑ Administration is split between Morocco and the Sahrawi Arab Democratic Republic, both of which claim the entire territory.
- ↑ De facto independent, de jure part of Moldova.
- ↑ De facto independent, de jure part of Cyprus.
- ↑ Abkhazia is the subject of a territorial dispute between the Republic of Abkhazia and the Republic of Georgia. The Republic of Abkhazia unilaterally declared independence on 23 July 1992, but Georgia continues to claim it as part of its own sovereign territory. Abkhazia has received formal recognition as an independent state from 7 out of 193 United Nations member states, 2 of which have subsequently withdrawn their recognition.
- ↑ De facto independent, de jure part of Azerbaijan.
- ↑ South Ossetia's status is disputed. It considers itself to be an independent state, but this is recognised by only a few other countries. The Georgian government and most of the world's other states consider South Ossetia de jure a part of Georgia's territory.
References
- ↑ "China's Population: The Most Surprising Demographic Crisis". The Economist. 2013.
- ↑ "World Population Prospects 2018".
External links
- United Nations Analytical Report for the 2004 revision of World Population Prospects (the analytical report for the 2006 revision is not available online) — includes details of methodology and sources used for the population estimates above.