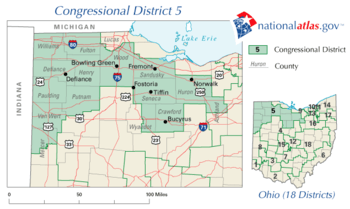
Ohio's 5th congressional district
| Ohio's 5th congressional district | |
|---|---|
.tif.png) Ohio's 5th congressional district - since January 3, 2013. | |
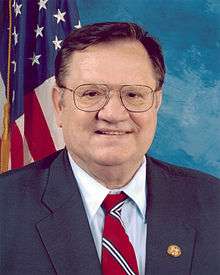
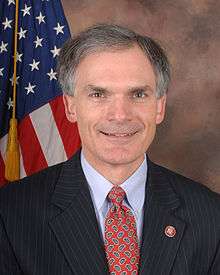
| Current Representative | Bob Latta (R–Bowling Green) |
| Distribution |
|
| Population (2016) | 720,730[2] |
| Median income | $57,171 |
| Ethnicity |
|
| Cook PVI | R+11[3] |
Ohio's 5th congressional district is in northwestern and north central Ohio and borders Michigan and Indiana. The district is currently represented by Republican Bob Latta. The district borders have changed somewhat from the previous redistrict as some of the easternmost counties were redistricted to other districts.
From 2003 to 2013 all of Crawford, Defiance, Fulton, Henry, Huron, Paulding, Putnam, Sandusky, Seneca, Van Wert, Williams, and Wood Counties were included in this district. Portions of Ashland, Lucas, Mercer, and Wyandot Counties were also a part of the 5th District.
List of Largest Municipalities
All or part of twenty-one cities (whose population is greater than 5,000) are in the district.
The largest municipalities[4] represented in this district include:
- Findlay, population 41,202
- Bowling Green, population 29,636
- Perrysburg, population 16,945
- Fremont, population 16,734
- Defiance, population 17,400
- Norwalk, population 16,238
- Fostoria(*), population 13,931
- Bucyrus, population 13,224
- Galion(*), population 11,341
- Van Wert, population 10,690
- Napoleon, population 9,318
- Bryan, population 8,333
- Wauseon, population 7,091
- Upper Sandusky(*), population 6,533
- Rossford, population 6,406
- Northwood, population 5,471
(*) Denotes that areas of the city are located in another Congressional District.
List of representatives
| Representative | Party | Years | Congress | Electoral history |
|---|---|---|---|---|
| District created | March 4, 1813 | |||
.png) |
Democratic- Republican |
March 4, 1813 – March 3, 1817 |
13 14 |
First elected in 1812 [Data unknown/missing.] |
 |
March 4, 1817 – March 3, 1821 |
15 16 |
First elected in 1816 Lost re-election | |
 |
March 4, 1821 – March 3, 1823 |
17 | Elected in 1820 Redistricted to the 4th district | |
 |
Jacksonian Republican |
March 4, 1823 – March 3, 1825 |
18 | Redistricted from the 2nd district Did not seek re-election. |
| Adams | March 4, 1825 – March 3, 1827 |
19 | ||
.jpg) |
Jacksonian | March 4, 1827 – March 3, 1833 |
20 21 22 |
First elected in 1826 Lost re-election |
 |
March 4, 1833 – March 3, 1837 |
23 24 |
First elected in 1832 [Data unknown/missing.] | |
| Democratic | March 4, 1837 – March 3, 1839 |
25 | ||
|
March 4, 1839 – March 3, 1843 |
26 27 |
First elected in 1838 Did not seek re-election | |
 |
March 4, 1843 – March 3, 1845 |
28 | Elected in 1842 Did not seek re-election | |
|
March 4, 1845 – March 3, 1849 |
29 30 |
First elected in 1844 Lost re-election | |
|
March 4, 1849 – March 3, 1851 |
31 | Elected in 1848 [Data unknown/missing.] | |
 |
March 4, 1851 – March 3, 1855 |
32 33 |
First elected in 1850 [Data unknown/missing.] | |
 |
Opposition | March 4, 1855 – March 3, 1857 |
34 | First elected in 1854 [Data unknown/missing.] |
| Republican | March 4, 1857 – March 3, 1859 |
35 | ||
 |
March 4, 1859 – March 3, 1863 |
36 37 |
First elected in 1858 Redistricted to the 10th district | |
 |
Democratic | March 4, 1863 – March 3, 1867 |
38 39 |
First elected in 1862 [Data unknown/missing.] |
 |
March 4, 1867 – March 3, 1871 |
40 41 |
First elected in 1866 [Data unknown/missing.] | |
 |
March 4, 1871 – March 3, 1875 |
42 43 |
First elected in 1870 [Data unknown/missing.] | |
 |
March 4, 1875 – March 3, 1879 |
44 45 |
First elected in 1874 [Data unknown/missing.] | |
 |
March 4, 1879 – March 4, 1883 |
46 47 |
Redistricted to the 4th district | |
.png) |
March 4, 1883 – March 3, 1885 |
48 | Redistricted to the 7th district | |
|
March 4, 1885 – March 3, 1887 |
49 | Redistricted from the 4th district | |
 |
March 4, 1887 – March 3, 1891 |
50 51 |
Redistricted from the 7th district | |
 |
March 4, 1891 – March 3, 1893 |
52 | Redistricted to the 4th district | |
 |
March 4, 1893 – March 3, 1895 |
53 | Redistricted from the 6th district | |
|
Republican | March 4, 1895 – March 3, 1897 |
54 | Elected in 1894 [Data unknown/missing.] |
 |
Democratic | March 4, 1897 – March 3, 1901 |
55 56 |
First elected in 1896 [Data unknown/missing.] |
 |
March 4, 1901 – March 3, 1905 |
57 58 |
First elected in 1900 Retired | |
 |
Republican | March 4, 1905 – March 3, 1907 |
59 | Elected in 1904 [Data unknown/missing.] |
 |
Democratic | March 4, 1907 – January 9, 1915 |
60 61 62 63 |
First elected in 1906 Resigned when appointed to the Ohio Court of Appeals |
| Vacant | January 9, 1915 – March 4, 1915 |
63 | ||
|
Republican | March 4, 1915 – March 3, 1917 |
64 | Elected in 1914 [Data unknown/missing.] |
|
Democratic | March 4, 1917 – March 3, 1919 |
65 | Elected in 1916 Retired |
 |
Republican | March 4, 1919 – March 3, 1931 |
66 67 68 69 70 71 |
First elected in 1918 [Data unknown/missing.] |
 |
Democratic | March 4, 1931 – January 3, 1939 |
72 73 74 75 |
First elected in 1900 Lost re-election |
 |
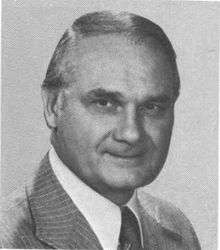
Republican | January 3, 1939 – January 3, 1959 |
76 77 78 79 80 81 82 83 84 85 |
First elected in 1938 Retired |
 |
January 3, 1959 – January 3, 1989 |
86 87 88 89 91 92 93 94 95 96 97 98 99 100 |
First elected in 1958 Retired | |
 |
January 3, 1989 – September 5, 2007 |
101 102 103 104 105 106 107 108 109 110 |
First elected in 1988 Died | |
| Vacant | September 5, 2007 – December 11, 2007 |
110 | ||
 |
Republican | December 11, 2007 – Present |
110 111 112 113 114 |
First elected in a 2007 special election |
Election results
The following chart shows historic election results. Bold type indicates victor. Italic type indicates incumbent.
| Year | Democratic | Republican | Other |
|---|---|---|---|
| 1812 | District created following the 1810 Census. | ||
| … | |||
| 1920 | Newt Bronson: 25,395 | Charles J. Thompson: 40,381 | |
| 1922 | Frank C. Kniffin: 28,067 | Charles J. Thompson: 31,700 | |
| 1924 | Frank C. Kniffin: 29,245 | Charles J. Thompson: 31,045 | |
| 1926 | Frank C. Kniffin: 23,022 | Charles J. Thompson: 23,638 | |
| 1928 | Frank C. Kniffin: 31,385 | Charles J. Thompson: 36,096 | |
| 1930 | Frank C. Kniffin: 29,117 | Charles J. Thompson: 27,497 | |
| 1932 | Frank C. Kniffin: 44,433 | William L. Manahan: 29,605 | |
| 1934 | Frank C. Kniffin: 34,249 | Davis B. Johnson: 27,423 | |
| 1936 | Frank C. Kniffin: 41,693 | Stephan S. Beard: 33,212 | Fred L. Hay: 3,663 |
| 1938 | Frank C. Kniffin: 28,109 | Cliff Clevenger: 37,027 | |
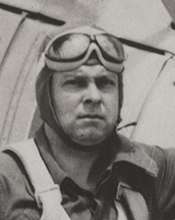
| 1940 | C. H. Armbruster: 31,063 | Cliff Clevenger: 48,040 | |
| 1942 | Ferdinand E. Warren: 17,514 | Cliff Clevenger: 30,667 | |
| 1944 | T. Walter Williams: 22,740 | Cliff Clevenger: 48,490 | |
| 1946 | Willard Thomas: 20,163 | Cliff Clevenger: 30,623 | |
| 1948 | Dan Batt: 32,076 | Cliff Clevenger: 34,950 | |
| 1950 | Dan Batt: 26,689 | Cliff Clevenger: 36,096 | |
| 1952 | Dan Batt: 42,104 | Cliff Clevenger: 72,168 | |
| 1954 | Martin W. Feigert: 33,483 | Cliff Clevenger: 49,265 | |
| 1956 | George E. Rafferty: 42,181 | Cliff Clevenger: 69,774 | |
| 1958 | George E. Rafferty: 44,971 | Delbert L. Latta: 52,612 | |
| 1960 | Tom T. McRitchie: 41,375 | Delbert L. Latta: 85,175 | |
| 1962 | William T. Hunt: 29,114 | Delbert L. Latta: 69,272 | |
| 1964 | Milford Landis: 41,621 | Delbert L. Latta: 80,394 | |
| 1966 | John H. Shock: 26,503 | Delbert L. Latta: 80,906 | |
| 1968 | Louis Richard Batzler: 45,884 | Delbert L. Latta: 113,381 | |
| 1970 | Carl G. Sherer: 37,545 | Delbert L. Latta: 92,577 | |
| 1972 | Bruce Edwards: 49,465 | Delbert L. Latta: 132,032 | |
| 1974 | Bruce Edwards: 53,391 | Delbert L. Latta: 89,161 | |
| 1976 | Bruce Edwards: 60,304 | Delbert L. Latta: 124,910 | |
| 1978 | James R. Sherck: 51,071 | Delbert L. Latta: 85,547 | |
| 1980 | James R. Sherck: 57,704 | Delbert L. Latta: 137,003 | |
| 1982 | James R. Sherck: 70,120 | Delbert L. Latta: 86,450 | |
| 1984 | James R. Sherck: 78,809 | Delbert L. Latta: 132,582 | |
| 1986 | Tom Murray: 54,864 | Delbert L. Latta: 102,016 | |
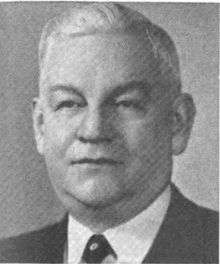
| 1988 | Tom Murray: 80,472 | Paul E. Gillmor: 128,838 | |
| 1990 | P. Scott Mange: 41,693 | Paul E. Gillmor: 113,615 | John E. Jackson: 10,612 |
| 1992 | Paul E. Gillmor: 187,860 | ||
| 1994 | Jarrod Tudor: 49,335 | Paul E. Gillmor: 135,879 | |
| 1996 | Annie Saunders: 81,170 | Paul E. Gillmor: 145,892 | David J. Schaffer (N): 11,461 |
| 1998 | Susan Davenport Darrow: 61,926 | Paul E. Gillmor: 123,979 | |
| 2000 | Dannie Edmon: 62,138 | Paul E. Gillmor: 169,857 | John F. Green (L): 5,464 David J. Schaffer (N): 5,881 |
| 2002 | Roger Anderson: 51,872 | Paul E. Gillmor: 126,286 | John F. Green: 10,096 |
| 2004 | Robin Weirauch: 95,481 | Paul E. Gillmor: 194,559 | |
| 2006 | Robin Weirauch: 95,955 | Paul E. Gillmor : 126,898 | |
| 2007* | Robin Weirauch: 32,246 | Robert E. Latta: 41,740 | |
| 2008 | George Mays: 105,840 | Robert E. Latta: 188,905 | [5] |
| 2012[6] | Angela Zimmann: 137,806 | Robert E. Latta: 201,514 | Eric Eberly (L) : 12,558 |
| 2014[7] | Robert Fry: 57,328 | Robert E. Latta: 132,448 | Eric Eberly (L) : 9,142 |
2010
| Party | Candidate | Votes | % | |
|---|---|---|---|---|
| Republican | Bob Latta* | 140,703 | 67.82 | |
| Democratic | Caleb Finkenbiner | 54,919 | 26.47 | |
| Libertarian | Brian Smith | 11,831 | 5.70 | |
| Total votes | 207,453 | 100.00 | ||
| Turnout | ||||
| Republican hold | ||||
Historical district boundaries
See also
References
- ↑ Geography, US Census Bureau. "Congressional Districts Relationship Files (state-based)". www.census.gov. Retrieved 9 April 2018.
- ↑ Bureau, Center for New Media & Promotion (CNMP), US Census. "My Congressional District". www.census.gov. Retrieved 9 April 2018.
- ↑ "Partisan Voting Index – Districts of the 115th Congress" (PDF). The Cook Political Report. April 7, 2017. Retrieved April 7, 2017.
- ↑ "U.S. Census Bureau, Census 2000" (PDF). census.gov. Retrieved 9 April 2018.
- ↑ Federal Elections 2008. Federal Elections Commission, Washington DC, July 2009
- ↑ "2012 Election Results". Ohio Secretary of State.
- ↑ "2014 Election Results". Ohio Secretary of State.
- Martis, Kenneth C. (1989). The Historical Atlas of Political Parties in the United States Congress. New York: Macmillan Publishing Company.
- Martis, Kenneth C. (1982). The Historical Atlas of United States Congressional Districts. New York: Macmillan Publishing Company.
- Congressional Biographical Directory of the United States 1774–present
Coordinates: 41°09′21″N 84°02′41″W / 41.15583°N 84.04472°W