Birmingham City Council election, 2012
|
| |||||||||||||||||||||||||
| |||||||||||||||||||||||||
One third (40) seats to Birmingham City Council 61 seats needed for a majority | |||||||||||||||||||||||||
|---|---|---|---|---|---|---|---|---|---|---|---|---|---|---|---|---|---|---|---|---|---|---|---|---|---|
| |||||||||||||||||||||||||
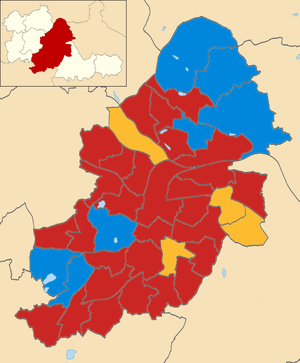 2012 local election results in Birmingham. | |||||||||||||||||||||||||
| |||||||||||||||||||||||||
Elections to Birmingham City Council in England were held on 3 May 2012 on the same day as other United Kingdom local elections, 2012.[1] One third of the council was up for election and the Labour Party gained overall control of the council from No Overall Control.
These election results are directly comparable with the corresponding elections held in 2008
Election summary
| Party | Seats | Gains | Losses | Net gain/loss | Seats % | Votes % | Votes | +/− | |
|---|---|---|---|---|---|---|---|---|---|
| Labour | 77 | 51 | 109,841 | ||||||
| Conservative | 28 | 24 | 51,490 | ||||||
| Liberal Democrat | 15 | 14 | 34,707 | ||||||
| Green | 0 | 0 | 4.5 | 9,703 | |||||
| UKIP | 0 | 0 | 2.3 | 4,915 | |||||
| BNP | 0 | 0 | 1.5 | 3,306 | |||||
| Socialist Labour | 0 | 0 | 429 | ||||||
| Communities Against the Cuts | 0 | 0 | 385 | ||||||
| English Democrat | 0 | 0 | 226 | ||||||
| National Front | 0 | 0 | 143 | ||||||
| SDP | 0 | 0 | 64 | ||||||
| TUSC | 0 | 0 | 58 | ||||||
| Independent | 0 | 0 | withdrawn | ||||||
Resulting Political Composition
| Party | Seats | Council Composition 3 May 2012 | |||||||||||||||||||||||||||||||||||||||||||||||||||||||||||||||||
|---|---|---|---|---|---|---|---|---|---|---|---|---|---|---|---|---|---|---|---|---|---|---|---|---|---|---|---|---|---|---|---|---|---|---|---|---|---|---|---|---|---|---|---|---|---|---|---|---|---|---|---|---|---|---|---|---|---|---|---|---|---|---|---|---|---|---|---|
| 2010 | 2011 | 2012 | |||||||||||||||||||||||||||||||||||||||||||||||||||||||||||||||||
| Labour | 41 | 57 | 77 | ||||||||||||||||||||||||||||||||||||||||||||||||||||||||||||||||
| Conservative | 45 | 39 | 28 | ||||||||||||||||||||||||||||||||||||||||||||||||||||||||||||||||
| Liberal Democrats | 31 | 24 | 15 | ||||||||||||||||||||||||||||||||||||||||||||||||||||||||||||||||
Ward results
| Party | Candidate | Votes | % | ± | |
|---|---|---|---|---|---|
| Labour | John O'Shea | 2170 | 42.7% | ||
| Liberal Democrat | Roger Harmer | 1993 | 39.2% | ||
| UKIP | Chris Whitehouse | 269 | 5.3% | ||
| Conservative | Joe Edginton | 247 | 4.9% | ||
| Green | Amanda Baker | 168 | 3.3% | ||
| BNP | Stella Taylor | 166 | 3.3% | ||
| TUSC | Ben Rubery | 58 | 1.1% | ||
| SDP | Alan Ware | 15 | 0.3% | ||
| Majority | |||||
| Turnout | |||||
| Party | Candidate | Votes | % | ± | |
|---|---|---|---|---|---|
| Labour | Nagina Kauser | 3567 | 50.5% | ||
| Liberal Democrat | Ayoub Khan | 3123 | 44.2% | ||
| Independent | Abdusalam bin Smith | 145 | 2.1% | ||
| Conservative | Ian Colpman | 138 | 2.0% | ||
| Green | Ankaret Harmer | 94 | 1.3% | ||
| Majority | |||||
| Turnout | |||||
| Party | Candidate | Votes | % | ± | |
|---|---|---|---|---|---|
| Conservative | Vivienne Barton | 2716 | 56.2% | ||
| Labour | Nora Young | 1639 | 33.9% | ||
| BNP | John Grainger | 235 | 4.9% | ||
| Green | Adam Round | 155 | 3.2% | ||
| Liberal Democrat | Julia Garrett | 87 | 1.8% | ||
| Majority | |||||
| Turnout | |||||
| Party | Candidate | Votes | % | ± | |
|---|---|---|---|---|---|
| Labour | Phil Davies | 2586 | 49.7% | ||
| Conservative | Len Gregory | 1749 | 33.6% | ||
| UKIP | Adrian Duffen | 287 | 5.5% | ||
| BNP | Paul Hickman | 237 | 4.6% | ||
| Green | Anna Masters | 191 | 3.7% | ||
| Liberal Democrat | Simone Rudge-Beattie | 156 | 3.0% | ||
| Majority | |||||
| Turnout | |||||
| Party | Candidate | Votes | % | ± | |
|---|---|---|---|---|---|
| Labour | Uzma Ahmed | 5042 | 61.2% | ||
| Liberal Democrat | Shaukat Ali Khan | 2701 | 32.8% | ||
| Green | Huw Davies | 180 | 2.3% | ||
| Conservative | Andrew Hardie | 176 | 2.1% | ||
| UKIP | Dale Wynde | 144 | 1.7% | ||
| Majority | |||||
| Turnout | |||||
| Party | Candidate | Votes | % | ± | |
|---|---|---|---|---|---|
| Labour | Phil Walking | 3185 | 44.3% | ||
| Conservative | Nigel Dawkins | 2878 | 40.0% | ||
| Green | Joe Rooney | 417 | 5.8% | ||
| Liberal Democrat | Tim Stimpson | 272 | 3.8% | ||
| Communities Against the Cuts | Lynne Habermacher | 256 | 3.6% | ||
| BNP | Darren Allen | 188 | 2.6% | ||
| Majority | |||||
| Turnout | |||||
| [[|N/A]] hold | Swing | ||||
| Party | Candidate | Votes | % | ± | |
|---|---|---|---|---|---|
| Labour | Eva Phillips | 3360 | 54.3% | ||
| Conservative | Neville Summerfield | 1978 | 31.9% | ||
| UKIP | James Wood | 335 | 5.4% | ||
| Green | Jane Bradshaw | 317 | 5.1% | ||
| Liberal Democrat | Chris Burgess | 202 | 3.3% | ||
| Independent | Karen Osborne | withdrawn | |||
| Majority | |||||
| Turnout | |||||
| Party | Candidate | Votes | % | ± | |
|---|---|---|---|---|---|
| Conservative | Deirdre Alden | 2,240 | 46.2% | ||
| Labour | Dennis Minnis | 1,999 | 41.3% | ||
| Green | Bill van Marle | 279 | 5.8% | ||
| Liberal Democrat | Colin Green | 196 | 4.0% | ||
| UKIP | David Bridges | 131 | 2.7% | ||
| Majority | |||||
| Turnout | |||||
| Party | Candidate | Votes | % | ± | |
|---|---|---|---|---|---|
| Conservative | Bob Beauchamp | 2300 | 50.3 | ||
| Labour | Elaine Jackson | 1854 | 40.6 | ||
| Liberal Democrat | Philip Mills | 114 | 2.5 | ||
| BNP | Morris Vincent | 142 | 3.1 | ||
| Green | David Williams | 161 | 3.5 | ||
| Majority | 446 | 9.7 | |||
| Turnout | |||||
| Party | Candidate | Votes | % | ± | |
|---|---|---|---|---|---|
| Labour | Barry Bowles | 2613 | 41.2 | ||
| Conservative | Bob Harvey | 2127 | 33.6 | ||
| Liberal Democrat | Paul Smith | 1302 | 20.6 | ||
| Green | Charles Alldrick | 294 | 4.6 | ||
| Majority | |||||
| Turnout | |||||
| Party | Candidate | Votes | % | ± | |
|---|---|---|---|---|---|
| Labour | Gurdial Atwal | 3779 | 65.5 | ||
| Conservative | Amrik Singh Sahota | 1199 | 20.8 | ||
| Socialist Labour | John Tyrrell | 350 | 6.0 | ||
| Green | Hugh Williams | 300 | 5.2 | ||
| Liberal Democrat | Malti Dhiman | 142 | 2.5 | ||
| Majority | 1,780 | 44.7 | |||
| Turnout | |||||
| Party | Candidate | Votes | % | ± | |
|---|---|---|---|---|---|
| Labour | Elaine Williams | 3264 | 50.2 | ||
| Conservative | John Alden | 2441 | 37.5 | ||
| Green | Phil Simpson | 394 | 6.1 | ||
| UKIP | Keith Rowe | 233 | 3.6 | ||
| Liberal Democrat | Alaine Christian | 178 | 2.6 | ||
| Majority | 823 | 17.7 | |||
| Turnout | |||||
| Party | Candidate | Votes | % | ± | |
|---|---|---|---|---|---|
| Labour Co-op | Anita Ward | 3345 | 65.7 | ||
| Liberal Democrat | Gwyn Neilly | 836 | 16.4 | ||
| Conservative | Derek Johnson | 384 | 7.5 | ||
| UKIP | John Butler | 270 | 5.3 | ||
| BNP | David Campion | 139 | 2.7 | ||
| Green | Anne Margaret Okole | 102 | 2.0 | ||
| SDP | Peter Johnson | 14 | 0.3 | ||
| Majority | 2509 | 49.3 | |||
| Turnout | |||||
| Party | Candidate | Votes | % | ± | |
|---|---|---|---|---|---|
| Labour | Valerie Seabright | 2047 | 43.7 | ||
| Conservative | Barbara Wood | 1764 | 37.7 | ||
| UKIP | Peter Hughes | 297 | 6.3 | ||
| Liberal Democrat | Claire Berwick | 170 | 3.6 | ||
| BNP | Frances Waldron | 145 | 3.1 | ||
| Green | Ged Hickman | 131 | 2.8 | ||
| Communities Against the Cuts | Christopher Hughes | 129 | 2.7 | ||
| Majority | 283 | 6.0 | |||
| Turnout | |||||
| Party | Candidate | Votes | % | ± | |
|---|---|---|---|---|---|
| Labour | Catharine Grundy | 2014 | 49.6 | ||
| Conservative | Gary Sambrook | 1609 | 39.7 | ||
| BNP | Lynette Orton | 213 | 5.3 | ||
| Green | Tony O'Sullivan | 106 | 2.6 | ||
| Liberal Democrat | Graham Lippiatt | 80 | 2.0 | ||
| National Front | Terry Williams | 34 | 0.8 | ||
| Majority | 405 | 9.9 | |||
| Turnout | |||||
| Party | Candidate | Votes | % | ± | |
|---|---|---|---|---|---|
| Labour | Kath Hartley | 2174 | |||
| Conservative | Parveen Hassan | 474 | |||
| Green | Hazel Clawley | 268 | |||
| UKIP | Matthew Roach | 215 | |||
| Liberal Democrat | Cabdulqaadir Ruumi | 185 | |||
| Majority | |||||
| Turnout | |||||
| Party | Candidate | Votes | % | ± | |
|---|---|---|---|---|---|
| Labour | Jess Phillips | 2,069 | 46.9% | ||
| Conservative | Ken Wood | 1,536 | 34.8% | ||
| UKIP | Graeme Carruthers | 305 | 6.9% | ||
| Green | Susan Pearce | 168 | 3.8% | ||
| BNP | Christopher Pritchard | 173 | 3.9% | ||
| Liberal Democrat | Andy Thompson | 163 | 3.7% | ||
| Majority | 533 | 12.1% | |||
| Turnout | |||||
| Party | Candidate | Votes | % | ± | |
|---|---|---|---|---|---|
| Labour | Mahmood Hussain | 4889 | |||
| Conservative | Ravi Chumber | 400 | |||
| Green | Emma Round | 275 | |||
| Liberal Democrat | Sharon Trench | 187 | |||
| Majority | |||||
| Turnout | |||||
| Party | Candidate | Votes | % | ± | |
|---|---|---|---|---|---|
| Labour | Lisa Trickett | 3432 | |||
| Liberal Democrat | Martin Mullaney | 2137 | |||
| Green | William Lilley | 594 | |||
| Conservative | John Turner | 472 | |||
| UKIP | Alan Blumenthal | 199 | |||
| Majority | |||||
| Turnout | |||||
| Party | Candidate | Votes | % | ± | |
|---|---|---|---|---|---|
| Labour | Tahir Ali | 2831 | |||
| Liberal Democrat | Shazad Iqbal | 483 | |||
| Conservative | Aaron Powell | 282 | |||
| Green | Janet Assheton | 265 | |||
| Majority | |||||
| Turnout | |||||
| Party | Candidate | Votes | % | ± | |
|---|---|---|---|---|---|
| Labour | Brett O'Reilly | 2238 | |||
| Conservative | Les Lawrence | 2177 | |||
| UKIP | John Borthwick | 353 | |||
| Liberal Democrat | Andy Moles | 201 | |||
| BNP | Howard Hamilton | 201 | |||
| Green | Kirsty Axe | 179 | |||
| Majority | |||||
| Turnout | |||||
| Party | Candidate | Votes | % | ± | |
|---|---|---|---|---|---|
| Labour | Tristan Chatfield | 2,353 | |||
| Conservative | Graham Green | 1,456 | |||
| English Democrat | Chris Newey | 226 | |||
| BNP | Michael Jones | 225 | |||
| Green | Harry Eyles | 153 | |||
| Liberal Democrat | Nick Jolliffe | 132 | |||
| Majority | |||||
| Turnout | 5,280 | 29.2 | |||
| Party | Candidate | Votes | % | ± | |
|---|---|---|---|---|---|
| Liberal Democrat | Raymond Hassall | 2587 | |||
| Labour | Sarfraiz Hussain | 2054 | |||
| Conservative | Sukhwinder Singh Sungu | 309 | |||
| Green | Colin Marriott | 262 | |||
| Majority | |||||
| Turnout | |||||
| Party | Candidate | Votes | % | ± | |
|---|---|---|---|---|---|
| Labour | Caroline Badley | 3362 | |||
| Conservative | Peter Smallbone | 2226 | |||
| Green | Peter Beck | 255 | |||
| BNP | James Harvey | 200 | |||
| Liberal Democrat | Ian Garrett | 141 | |||
| Majority | |||||
| Turnout | |||||
| Party | Candidate | Votes | % | ± | |
|---|---|---|---|---|---|
| Labour Co-op | Karen McCarthy | 1833 | |||
| Liberal Democrat | Alistair Dow | 1332 | |||
| Conservative | Monica Hardle | 509 | |||
| Green | David Toke | 271 | |||
| UKIP | Robin Norton | 179 | |||
| Majority | |||||
| Turnout | |||||
| Party | Candidate | Votes | % | ± | |
|---|---|---|---|---|---|
| Labour | Marjorie Bridle | 2038 | |||
| UKIP | Iain Roden | 609 | |||
| Conservative | Jessie Holland | 396 | |||
| BNP | Kevin McHugh | 222 | |||
| Green | Tracie Hammond | 124 | |||
| National Front | Mark Neary | 38 | |||
| Majority | |||||
| Turnout | |||||
| Party | Candidate | Votes | % | ± | |
|---|---|---|---|---|---|
| Liberal Democrat | Sue Anderson | 2,737 | |||
| Labour | Christopher Dalton | 957 | |||
| UKIP | Richard Allen | 274 | |||
| BNP | Ian Starks | 191 | |||
| Conservative | Amil Khan | 168 | |||
| Green | Alan Clawley | 77 | |||
| National Front | Paul Morris | 28 | |||
| SDP | Joylan Ware | 17 | |||
| Majority | |||||
| Turnout | |||||
| Party | Candidate | Votes | % | ± | |
|---|---|---|---|---|---|
| Labour | Chaman Lal | 3828 | |||
| Liberal Democrat | Mohammed Usman | 507 | |||
| Conservative | Manjeet Kumari-Lal | 375 | |||
| Green | Steve Austin | 243 | |||
| Socialist Labour | Shangara Singh Bhatoe | 79 | |||
| Majority | |||||
| Turnout | |||||
| Party | Candidate | Votes | % | ± | |
|---|---|---|---|---|---|
| Labour | Zafar Iqbal | 2938 | |||
| Liberal Democrat | Daphne Gaved | 2315 | |||
| UKIP | Albert Duffen | 237 | |||
| BNP | Timothy Glover | 161 | |||
| Green | Rianne Ten Veen | 152 | |||
| Conservative | Afzal Shah | 152 | |||
| National Front | Adrian Davidson | 43 | |||
| Majority | |||||
| Turnout | |||||
| Party | Candidate | Votes | % | ± | |
|---|---|---|---|---|---|
| Labour | Mohammed Azim | 5164 | |||
| Green | Peter Tinsley | 326 | |||
| Conservative | Hussein Hussein | 298 | |||
| Liberal Democrat | Blair Kesseler | 221 | |||
| Majority | |||||
| Turnout | |||||
| Party | Candidate | Votes | % | ± | |
|---|---|---|---|---|---|
| Liberal Democrat | Jerry Evans | 3278 | |||
| Labour | Nabila Bano | 3183 | |||
| Conservative | Abdul Rashid | 519 | |||
| Green | Ian Jamieson | 232 | |||
| Majority | |||||
| Turnout | |||||
| Party | Candidate | Votes | % | ± | |
|---|---|---|---|---|---|
| Liberal Democrat | Neil Eustace | 2584 | |||
| Labour | Lorraine Owen | 1690 | |||
| UKIP | Graham Duffen | 393 | |||
| Conservative | Robert Clark | 218 | |||
| BNP | Dean Edwards | 197 | |||
| Green | Eric Fairclough | 89 | |||
| SDP | Joyce Ware | 18 | |||
| Majority | |||||
| Turnout | |||||
| Party | Candidate | Votes | % | ± | |
|---|---|---|---|---|---|
| Labour | Josh Jones | 2457 | |||
| Conservative | Matt Bennett | 1527 | |||
| Green | Elly Stanton | 234 | |||
| Liberal Democrat | Franklyn Aaron | 170 | |||
| Majority | |||||
| Turnout | |||||
| Party | Candidate | Votes | % | ± | |
|---|---|---|---|---|---|
| Conservative | Meirion Jenkins | 3699 | |||
| Labour | Manish Puri | 869 | |||
| Green | David Ratcliff | 638 | |||
| Liberal Democrat | Hubert Duffy | 427 | |||
| Majority | |||||
| Turnout | |||||
| Party | Candidate | Votes | % | ± | |
|---|---|---|---|---|---|
| Conservative | Guy Roberts | 2524 | |||
| Labour | Ian Brindley | 1599 | |||
| Green | Samantha Winsper | 336 | |||
| Liberal Democrat | Lynn Williams | 249 | |||
| Majority | |||||
| Turnout | |||||
| Party | Candidate | Votes | % | ± | |
|---|---|---|---|---|---|
| Conservative | Philip Parkin | 2639 | |||
| Labour | Roger Barley | 1541 | |||
| Green | Ulla Grant | 421 | |||
| Liberal Democrat | Sally Lippiatt | 415 | |||
| Majority | |||||
| Turnout | |||||
| Party | Candidate | Votes | % | ± | |
|---|---|---|---|---|---|
| Labour | Robert Pocock | 3231 | |||
| Conservative | Malcolm Cornish | 2426 | |||
| Green | James Orford | 285 | |||
| Liberal Democrat | Gareth Hardy | 241 | |||
| Majority | |||||
| Turnout | |||||
| Party | Candidate | Votes | % | ± | |
|---|---|---|---|---|---|
| Labour Co-op | Mick Brown | 1924 | |||
| Liberal Democrat | Ann Holtom | 982 | |||
| Conservative | Doug Pullen | 467 | |||
| BNP | Peter Hickman | 248 | |||
| Green | Lee Moore | 144 | |||
| Majority | |||||
| Turnout | |||||
| Party | Candidate | Votes | % | ± | |
|---|---|---|---|---|---|
| Labour | Mariam Khan | 6608 | |||
| Liberal Democrat | Mohammad Azam | 1049 | |||
| UKIP | Arthur Davis | 185 | |||
| Green | John Bentley | 184 | |||
| Conservative | Allister du Plessis | 178 | |||
| Majority | |||||
| Turnout | |||||
| Party | Candidate | Votes | % | ± | |
|---|---|---|---|---|---|
| Conservative | Eddie Freeman | 2117 | |||
| Labour | Steve Booton | 2115 | |||
| Green | Ross Axe | 239 | |||
| Liberal Democrat | Steven Haynes | 216 | |||
| BNP | Leslie Orton | 213 | |||
| Majority | |||||
| Turnout | |||||
References
- ↑ City Council elections informations Birmingham City Council
- Birmingham City Council election service (with links to results)
This article is issued from
Wikipedia.
The text is licensed under Creative Commons - Attribution - Sharealike.
Additional terms may apply for the media files.