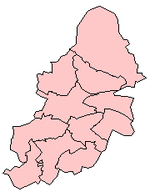
Aston is a ward covering an area of north east Birmingham, including the districts of Aston.
Ward demographics
From the census of 2001:[1]
- White British - 26.00%
- White Irish - 2.58%
- White Other - 0.87%
- Asian or Asian British - 42.41%
- Black or Black British - 21.51%
- Mixed - 3.69%
- Chinese or other - 2.02%
Ward history
The ward was created in 1911, when Birmingham gained the Aston Manor Urban District. As a typical inner city ward, which tends to lose population the boundaries have been altered on a number of occasions.
Election results
2010s
Birmingham City Council election: Aston Ward - 22 May 2014
Electorate
Turnout
| Party |
Candidate |
Votes |
% |
± |
|
Labour |
Ziaul Islam |
4175 |
68.7 |
+18.2 |
|
Liberal Democrat |
Sham Uddin |
1341 |
22.0 |
-22.2 |
|
Conservative |
Thomas Pike |
452 |
7.4 |
+5.4 |
|
Independent |
Abdusalam bin Smith |
108 |
1.7 |
-0.4% |
| Majority |
|
|
|
|
Labour hold |
Swing |
|
|
Birmingham City Council election: Aston Ward - 3 May 2012
Electorate
Turnout
| Party |
Candidate |
Votes |
% |
± |
|
Labour |
Nagina Kauser |
3567 |
50.5 |
-11.9 |
|
Liberal Democrat |
Ayoub Khan |
3123 |
44.2 |
+14.3 |
|
Independent |
Abdusalam bin Smith |
145 |
2.1 |
- |
|
Conservative |
Ian Colpman |
138 |
2.0 |
-2.2 |
|
Green |
Ankaret Harmer |
94 |
1.3 |
-1.6 |
| Majority |
|
|
|
|
Labour hold |
Swing |
|
|
Birmingham City Council election: Aston Ward - 5 May 2011
Electorate 19,982
Turnout 36.6%,
| Party |
Candidate |
Votes |
% |
± |
|
Labour |
Muhammad Afzal |
4,562 |
62.4 |
+7.6 |
|
Liberal Democrat |
Monhammed Hanif |
2,187 |
29.9 |
-3.5 |
|
Conservative |
Adam Felman |
304 |
4.2 |
-1.2 |
|
Green |
Aby Alamgir |
209 |
2.9 |
+0.6 |
| Majority |
2,375 |
|
|
|
Labour hold |
Swing |
|
|
Birmingham City Council election: Aston Ward - 6 May 2010
Electorate 19,877
Turnout 53.1%,
| Party |
Candidate |
Votes |
% |
± |
|
Labour |
Ziaul Islam |
5,683 |
54.8 |
|
|
Liberal Democrat |
Sham Uddin |
3,360 |
32.4 |
|
|
Conservative |
Gareth Moore |
564 |
5.4 |
|
|
Independent |
Abdusalam Smith |
321 |
3.1 |
|
|
Green |
Alan Bale |
242 |
2.3 |
|
| Majority |
2,323 |
22.4 |
|
|
Labour hold |
Swing |
|
|
1990s
7 May 1998
Electorate 17,023
Turnout 20.7%,
| Party |
Candidate |
Votes |
% |
± |
|
Labour |
A Kennedy |
2,504 |
71.1% |
|
|
Conservative |
O Shariff |
656 |
18.6% |
|
|
Independent |
J Foster |
334 |
9.5% |
|
| Majority |
1,848 |
52.5% |
|
|
Labour hold |
Swing |
|
|
1980s
7 May 1987
Electorate 18,621
Turnout 34.3%,
| Party |
Candidate |
Votes |
% |
± |
|
Labour |
F Carter |
4,517 |
70.7% |
|
|
Liberal |
T Nightingale |
871 |
13.6% |
|
|
Conservative |
S Ratra |
774 |
12.1% |
|
|
Green |
G Grainger |
219 |
3.4% |
|
| Majority |
3,646 |
57.1% |
|
|
Labour hold |
Swing |
|
|
1 May 1986
Electorate 18,869
Turnout 31.7%,
| Party |
Candidate |
Votes |
% |
± |
|
Labour |
E Carless |
4,342 |
72.6% |
|
|
Liberal |
G Crosbee |
1,012 |
16.9% |
|
|
Conservative |
C Harrison |
515 |
8.6% |
|
| Majority |
3,230 |
55.7% |
|
|
Labour hold |
Swing |
|
|
3 May 1984
Electorate 19,300
Turnout 32.3%,
| Party |
Candidate |
Votes |
% |
± |
|
Labour |
M Afzal |
3,949 |
63.3% |
|
|
Liberal |
G Crosbee |
1,580 |
25.3% |
|
|
Conservative |
J Dad |
701 |
11.2% |
|
| Majority |
2,369 |
38.0% |
|
|
Labour hold |
Swing |
|
|
5 May 1983
Electorate 19,069
Turnout 38.7%,
| Party |
Candidate |
Votes |
% |
± |
|
Labour |
F Carter |
5,218 |
70.7% |
|
|
Liberal |
S Anderson |
1,170 |
15.9% |
|
|
Conservative |
G Bayliss |
939 |
12.7% |
|
| Majority |
4,038 |
54.8% |
|
|
Labour hold |
Swing |
|
|
6 May 1982
Electorate 19,187
Turnout 35.9%,
| Party |
Candidate |
Votes |
% |
± |
|
Labour |
E Carless |
3,209 |
46.6% |
|
|
Labour |
M Afzal |
3,119 |
45.3% |
|
|
Labour |
F Carter |
3,038 |
44.1% |
|
|
Liberal |
Paul Tilsley |
2,546 |
37.0% |
|
|
Liberal |
R Millichip |
2,171 |
31.5% |
|
|
Liberal |
M Sharpe |
2,040 |
29.6% |
|
|
Conservative |
G Bayliss |
884 |
12.8% |
|
|
Conservative |
M Price |
695 |
10.1% |
|
|
Conservative |
H Hordern |
594 |
8.6% |
|
| Majority |
663, 573 & 492 |
9.6%, 8.3% & 7.1% |
|
|
Labour gain from Liberal |
Swing |
|
|
|
Labour hold |
Swing |
|
|
|
Labour hold |
Swing |
|
|
1970s
1 May 1975
Electorate 7,635
Turnout 35.7%,
| Party |
Candidate |
Votes |
% |
± |
|
Liberal |
G Hughes |
1,527 |
56.1% |
|
|
Labour |
E Carless |
944 |
34.7% |
|
|
Conservative |
Wilkins |
253 |
9.3% |
|
| Majority |
583 |
21.4% |
|
|
Liberal hold |
Swing |
|
|
2 May 1974
Electorate 7,635
Turnout 35.7%,
| Party |
Candidate |
Votes |
% |
± |
|
Liberal |
G Hughes |
1,527 |
56.1% |
|
|
Labour |
E Carless |
944 |
34.7% |
|
|
Conservative |
Wilkins |
253 |
9.3% |
|
| Majority |
583 |
21.4% |
|
|
Liberal hold |
Swing |
|
|
3 May 1973
Electorate 7,736
Turnout 35.7%,
| Party |
Candidate |
Votes |
% |
± |
|
Liberal |
Paul Tilsley |
2,000 |
72.4% |
|
|
Liberal |
G Gopsill |
1,884 |
68.2% |
|
|
Liberal |
G Hughes |
1,846 |
66.8% |
|
|
Labour |
B Downey |
743 |
26.9% |
|
|
Labour |
F Deakin |
727 |
26.3% |
|
|
Labour |
J Brooke |
677 |
24.5% |
|
|
Conservative |
R Harris |
127 |
4.6% |
|
|
Conservative |
J Kemp |
119 |
4.3% |
|
|
Conservative |
S Wilkins |
104 |
3.8% |
|
|
Independent |
K Taylor |
60 |
2.2% |
|
| Majority |
1,257, 1,141 & 1,103 |
45.5%, 41.3% &39.9% |
|
|
Liberal hold |
Swing |
|
|
|
Liberal hold |
Swing |
|
|
|
Liberal hold |
Swing |
|
|
4 May 1972
Electorate 8,464
Turnout 37.1%,
| Party |
Candidate |
Votes |
% |
± |
|
Liberal |
G Gopsill |
1,707 |
54.4% |
|
|
Labour |
F Bagshaw |
1,199 |
38.2% |
|
|
Conservative |
R Jauncey |
231 |
7.4% |
|
| Majority |
508 |
16.2% |
|
|
Liberal hold |
Swing |
|
|
13 May 1971
Electorate 10,188
Turnout 36.8%,
| Party |
Candidate |
Votes |
% |
± |
|
Liberal |
Paul Tilsley |
2,225 |
59.3% |
|
|
Labour |
F Bagshaw |
1,213 |
32.3% |
|
|
Conservative |
F O’Brien |
312 |
8.3% |
|
| Majority |
1,012 |
27.0% |
|
|
Liberal hold |
Swing |
|
|
1960s
11 May 1967
Electorate 16,977
Turnout 20.5%,
| Party |
Candidate |
Votes |
% |
± |
|
Labour |
S Styles |
1,525 |
43.8% |
|
|
Conservative |
F O’Brien |
1,045 |
30.0% |
|
|
Liberal |
Paul Tilsley |
780 |
22.4% |
|
|
Communist |
J Leishman |
131 |
3.8% |
|
| Majority |
480 |
13.8% |
|
|
Labour hold |
Swing |
|
|
12 May 1966
Electorate 17,605
Turnout 22.3%,
| Party |
Candidate |
Votes |
% |
± |
|
Labour |
E MacDonald |
2,383 |
60.7% |
|
|
Conservative |
F O’Brien |
1,355 |
34.5% |
|
|
Communist |
J Leishman |
185 |
4.7% |
|
| Majority |
1,028 |
26.2% |
|
|
Labour hold |
Swing |
|
|
13 May 1965
Electorate 17,996
Turnout 22.8%,
| Party |
Candidate |
Votes |
% |
± |
|
Labour |
F Gillespie |
2,077 |
50.5% |
|
|
Conservative |
F O’Brien |
1,696 |
41.3% |
|
|
Liberal |
R Bourne |
219 |
5.3% |
|
|
Communist |
J Leishman |
119 |
2.9% |
|
| Majority |
381 |
9.2% |
|
|
Labour hold |
Swing |
|
|
7 May 1964
Electorate 18,062
Turnout 23.8%,
| Party |
Candidate |
Votes |
% |
± |
|
Conservative |
F O’Brien |
1,212 |
28.2% |
|
|
Labour |
S Styles |
2,888 |
67.2% |
|
|
Communist |
J Leishman |
197 |
4.6% |
|
| Majority |
1,676 |
39.0% |
|
|
Labour hold |
Swing |
|
|
9 May 1963
Electorate 18.573
Turnout 23.9%,
| Party |
Candidate |
Votes |
% |
± |
|
Labour |
E MacDonald |
3,107 |
70.1% |
|
|
Conservative |
L Lanham |
1,096 |
24.7% |
|
|
Communist |
J Leishman |
227 |
5.1% |
|
| Majority |
2,111 |
45.4% |
|
|
Labour hold |
Swing |
|
|
10 May 1962
Electorate 19,129
Turnout 23.4%,
| Party |
Candidate |
Votes |
% |
± |
|
Labour |
F Gillespie |
2,775 |
61.9% |
|
|
Conservative |
F Gillespie |
1,140 |
25.4% |
|
|
Liberal |
K Day |
453 |
10.1% |
|
|
Communist |
J Leishman |
115 |
2.6% |
|
| Majority |
1,635 |
36.5% |
|
|
Labour hold |
Swing |
|
|
11 May 1961
Electorate 17,176
Turnout 29.2%,
| Party |
Candidate |
Votes |
% |
± |
|
Labour |
S Styles |
3,099 |
61.9% |
|
|
Conservative |
A Hinton |
1,275 |
25.5% |
|
|
Liberal |
G Wilson |
482 |
9.6% |
|
|
Communist |
J Leishman |
153 |
3.1% |
|
| Majority |
1,724 |
66.4% |
|
|
Labour hold |
Swing |
|
|
12 May 1960
Electorate 17,421
Turnout 20.1%,
| Party |
Candidate |
Votes |
% |
± |
|
Conservative |
A Hinton |
1,332 |
38.1% |
|
|
Labour |
E MacDonald |
1,998 |
57.2% |
|
|
Communist |
J Leishman |
166 |
4.7% |
|
| Majority |
666 |
19.1% |
|
|
Labour hold |
Swing |
|
|
1950s
14 May 1959
Electorate 17,808
Turnout 26.6%,
| Party |
Candidate |
Votes |
% |
± |
|
Conservative |
A Hinton |
1,409 |
29.7% |
|
|
Labour |
F Gillespie |
3,161 |
66.7% |
|
|
Communist |
J Leishman |
167 |
3.5% |
|
| Majority |
1,752 |
37.0% |
|
|
Labour hold |
Swing |
|
|
8 May 1958
Electorate 17,911
Turnout 31.0%,
| Party |
Candidate |
Votes |
% |
± |
|
Labour |
S Styles |
3,955 |
71.2% |
|
|
Conservative |
A Gilroy Bevan |
1,369 |
24.6% |
|
|
Communist |
J Leishman |
232 |
4.2% |
|
| Majority |
2,586 |
46.6% |
|
|
Labour hold |
Swing |
|
|
9 May 1957
Electorate 17,899
Turnout 25.7%,
| Party |
Candidate |
Votes |
% |
± |
|
Labour |
J Wood |
3,156 |
68.6% |
|
|
Conservative |
K Freshwater |
1,292 |
28.1% |
|
|
Communist |
J Leishman |
153 |
3.3% |
|
| Majority |
1,864 |
40.5% |
|
|
Labour hold |
Swing |
|
|
12 May 1955
Electorate 18,608
Turnout 32.1%,
| Party |
Candidate |
Votes |
% |
± |
|
Conservative |
C Whitehead |
2.009 |
33.6% |
|
|
Labour |
S Styles |
3,812 |
63.8% |
|
|
Communist |
J Leishman |
153 |
2.6% |
|
| Majority |
1,803 |
30.2% |
|
|
Labour hold |
Swing |
|
|
13 May 1954
Electorate 18,810
Turnout 32.7%,
| Party |
Candidate |
Votes |
% |
± |
|
Labour |
J Wood |
3,576 |
58.2% |
|
|
Conservative |
R Freshwater |
2,396 |
39.0% |
|
|
Communist |
J Leishman |
173 |
2.8% |
|
| Majority |
1,180 |
19.2% |
|
|
Labour hold |
Swing |
|
|
7 May 1953
Electorate 19,145
Turnout 30.5%,
| Party |
Candidate |
Votes |
% |
± |
|
Conservative |
C Whitehead |
1,834 |
31.4% |
|
|
Labour |
F Gillespie |
3,910 |
66.9% |
|
|
Communist |
W Evans |
100 |
1.7% |
|
| Majority |
2,076 |
35.5% |
|
|
Labour hold |
Swing |
|
|
8 May 1952
Electorate 19,508
Turnout 39.2%,
| Party |
Candidate |
Votes |
% |
± |
|
Labour |
S Styles |
5,586 |
73.0% |
|
|
Conservative |
C Whitehead |
1,964 |
25.7% |
|
|
Communist |
J Leishman |
101 |
1.3% |
|
| Majority |
3,622 |
47.3% |
|
|
Labour hold |
Swing |
|
|
10 May 1951
Electorate 19,572
Turnout 34.9%,
| Party |
Candidate |
Votes |
% |
± |
|
Labour |
J Wood |
3,720 |
54.4% |
|
|
Conservative |
F Lennon |
2,977 |
43.5% |
|
|
Communist |
O Dorman |
139 |
2.0% |
|
| Majority |
743 |
10.9% |
|
|
Labour hold |
Swing |
|
|
11 May 1950
Electorate 19,709
Turnout 35.7%,
| Party |
Candidate |
Votes |
% |
± |
|
Labour |
H Watton |
4,341 |
61.7% |
|
|
Conservative |
F Lannon |
2,577 |
36.6% |
|
|
Communist |
J Leishman |
117 |
1.7% |
|
| Majority |
1,764 |
25.1% |
|
|
Labour hold |
Swing |
|
|
1940s
12 May 1949
Electorate 19,643
Turnout 45.0%,
| Party |
Candidate |
Votes |
% |
± |
|
Labour |
F Moody |
5,075 |
57.4% |
|
|
Conservative |
I Shelley |
3,769 |
42.6% |
|
| Majority |
1,306 |
14.8% |
|
|
Labour hold |
Swing |
|
|