Harborne (ward)
| Harborne | |
|---|---|
| Ward | |
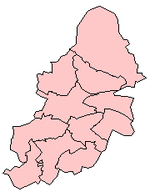
 Harborne Ward shown within Birmingham | |
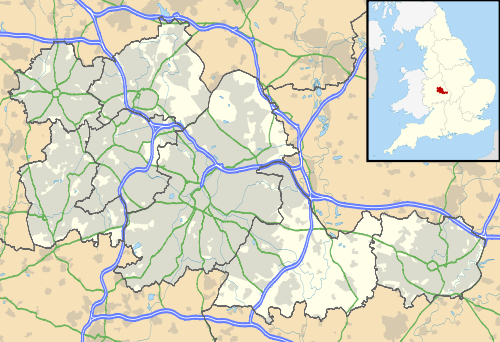 Harborne Harborne shown within the West Midlands | |
| Population | 23,001 (2011)[1] |
| OS grid reference | SP020836 |
| Metropolitan borough | |
| Metropolitan county | |
| Region | |
| Country | England |
| Sovereign state | United Kingdom |
| Post town | BIRMINGHAM |
| Postcode district | B17 |
| Dialling code | 0121 |
| Police | West Midlands |
| Fire | West Midlands |
| Ambulance | West Midlands |
| EU Parliament | West Midlands |
| UK Parliament | |
| Councillors |
|
Harborne ward is a local government district, one of 40 wards that make up Birmingham City Council. Harborne lies to the south west of Birmingham city centre. It has a slightly older age profile than the city average. The percentage of ethnic minority residents is below the city average.[2] Unemployment is below the city average.[3] The ward population at the 2011 census was 23,001.[4]
Politics
The Harborne ward is currently represented by one Labour Party Councillor; Jayne Francis (2016-)[5] and one Conservative Councillor; Peter Fowler (2018-).
The ward of Harborne forms part of the Parliamentary constituency of Birmingham Edgbaston along with Bartley Green, Edgbaston (ward), and Quinton, which has been represented by Labour Co-operative MP Preet Gill since 2017.
Election results
2010s
| Party | Candidate | Votes | % | ± | |
|---|---|---|---|---|---|
| Labour | Jayne Francis | 2623 | |||
| Conservative | Peter Fowler | 2533 | |||
| Conservative | Akaal Sidhu | 2390 | |||
| Labour | Sundip Meghani | 2061 | |||
| Liberal Democrat | Colin Green | 657 | |||
| Green | Phil Simpson | 650 | |||
| Liberal Democrat | Ian Garrett | 646 | |||
| Majority | |||||
| Turnout | |||||
| Labour hold | Swing | ||||
| Conservative gain from Labour | Swing | ||||
| Party | Candidate | Votes | % | ± | |
|---|---|---|---|---|---|
| Labour | Jayne Francis | 2,841 | 44.7 | ||
| Conservative | Akaal Sidhu | 2,404 | 37.8 | ||
| Green | Phil Simpson | 494 | 7.8 | ||
| UKIP | Mary Morris | 376 | 5.9 | ||
| Liberal Democrat | Philip Banting | 240 | 3.8 | ||
| Majority | 437 | 6.9 | |||
| Turnout | 6,355 | 39.23 | |||
| Labour hold | Swing | ||||
| Party | Candidate | Votes | % | ± | |
|---|---|---|---|---|---|
| Labour | James McKay | 4,922 | 43.0 | ||
| Conservative | Jane James | 4,384 | 38.3 | ||
| Green | Phil Simpson | 964 | 8.4 | ||
| UKIP | Charles Brecknell | 654 | 5.7 | ||
| Liberal Democrat | Philip Banting | 528 | 4.6 | ||
| Majority | 538 | 4.7 | |||
| Turnout | 11,452 | ||||
| Labour hold | Swing | ||||
| Party | Candidate | Votes | % | ± | |
|---|---|---|---|---|---|
| Conservative | John Alden | 2,816 | |||
| Labour | Nabila Zulfiqar | 2,518 | |||
| Green | Phil Simpson | 637 | |||
| UKIP | Charles Brecknell | 574 | |||
| Liberal Democrat | Philip Banting | 258 | |||
| Majority | 298 | ||||
| Turnout | |||||
| Conservative hold | Swing | ||||
| Party | Candidate | Votes | % | ± | |
|---|---|---|---|---|---|
| Labour | Elaine Williams | 3264 | 50.2 | ||
| Conservative | John Alden | 2441 | 37.5 | ||
| Green | Phil Simpson | 394 | 6.1 | ||
| UKIP | Keith Rowe | 233 | 3.6 | ||
| Liberal Democrat | Alaine Christian | 178 | 2.6 | ||
| Majority | 823 | 17.7 | |||
| Turnout | 6,529 | 37.95 | |||
| Labour gain from Conservative | Swing | ||||
| Party | Candidate | Votes | % | ± | |
|---|---|---|---|---|---|
| Labour | James McKay | 3,655 | 46.6 | ||
| Conservative | Geoff Hewitt | 3,071 | 39.15 | ||
| Green | Phil Simpson | 633 | 8.07 | ||
| Liberal Democrat | Christopher Bates | 426 | 5.4 | ||
| Majority | 584 | ||||
| Turnout | 7,844 | 46.04 | |||
| Labour gain from Conservative | Swing | ||||
| Party | Candidate | Votes | % | ± | |
|---|---|---|---|---|---|
| Conservative | Mike Whitby | 4,640 | |||
| Labour | James McKay | 3,766 | |||
| Liberal Democrat | Mohammed Sagier | 1,609 | |||
| Green | Phil Simpson | 744 | |||
| BNP | Roy Bevington | 289 | |||
| Majority | 874 | ||||
| Turnout | 11,078 | 66.3 | |||
| Conservative hold | Swing | ||||
2000s
| Party | Candidate | Votes | % | ± | |
|---|---|---|---|---|---|
| Conservative | John Alden | 2,717 | 49.5 | ||
| Labour | John Priest | 1,389 | 25.3 | ||
| Green | Phil Simpson | 691 | 12.6 | ||
| Liberal Democrat | Mohammed Sagier | 405 | 7.4 | ||
| BNP | Howard Hamilton | 193 | 3.5 | ||
| UKIP | Edward Siddall-Jones | 80 | 1.5 | ||
| Majority | 1,328 | 24.2 | |||
| Turnout | 5,475 | 33.4 | |||
| Conservative hold | Swing | ||||
| Party | Candidate | Votes | % | ± | |
|---|---|---|---|---|---|
| Conservative | Peter Hollingworth | 2,699 | |||
| Labour | John Priest | 1,662 | |||
| Green | Philip Simpson | 786 | |||
| Liberal Democrat | Miriam Banting | 649 | |||
| BNP | Lynette Orton | 265 | |||
| Majority | 1,937 | ||||
| Turnout | 6,083 | 36.98 | |||
| Conservative hold | Swing | ||||
| Party | Candidate | Votes | % | ± | |
|---|---|---|---|---|---|
| Conservative | Mike Whitby | 3,200 | |||
| Labour | John Priest | 1,823 | |||
| Green | Philip Simpson | 665 | |||
| Liberal Democrat | Mohammed Sagier | 577 | |||
| BNP | Josephine Larkin | 364 | |||
| Majority | |||||
| Turnout | |||||
| Conservative hold | Swing | ||||
| Party | Candidate | Votes | % | ± | |
|---|---|---|---|---|---|
| Conservative | John Alden | 3,268 | 16.93 | ||
| Conservative | Peter Hollingworth | 3,170 | 16.42 | ||
| Conservative | Mike Whitby | 3,100 | 16.06 | ||
| Majority | |||||
| Turnout | 41.33 | ||||
| Conservative hold | Swing | ||||
| Conservative hold | Swing | ||||
| Conservative hold | Swing | ||||
| Party | Candidate | Votes | % | ± | |
|---|---|---|---|---|---|
| Conservative | Peter Hollingworth | 3,008 | 52.4 | ||
| Labour | 1,816 | 31.7 | |||
| Liberal Democrat | 652 | 11.4 | |||
| Other | 261 | 4.5 | |||
| Majority | 1,192 | ||||
| Turnout | 5,737 | 33.4 | |||
| Conservative hold | Swing | ||||
| Party | Candidate | Votes | % | ± | |
|---|---|---|---|---|---|
| Conservative | 3,029 | 54.8 | |||
| Labour | 1,782 | 32.2 | |||
| Liberal Democrat | 512 | 9.3 | |||
| Other | 203 | 3.7 | |||
| Majority | |||||
| Turnout | 31.8 | ||||
| Conservative hold | Swing | ||||
1990s
| Party | Candidate | Votes | % | ± | |
|---|---|---|---|---|---|
| Conservative | 57.1 | ||||
| Labour | 32.9 | ||||
| Liberal Democrat | 10 | ||||
| Majority | |||||
| Turnout | |||||
| Conservative hold | Swing | ||||
| Party | Candidate | Votes | % | ± | |
|---|---|---|---|---|---|
| Conservative | Mike Whitby | 2,719 | 53.4 | ||
| Labour | Stephen Cormell | 1,859 | 36.5 | ||
| Liberal Democrat | Conall Boyle | 420 | 8.2 | ||
| Green | Peter Beck | 96 | 1.9 | ||
| Majority | 860 | 16.9 | |||
| Turnout | 5,094 | 29.0 | |||
| Conservative gain from Labour | Swing | ||||
References
- ↑ "Birmingham Ward population 2011". Retrieved 14 December 2015.
- ↑ "Birmingham Ward ethnic group 2011". Retrieved 6 April 2017.
- ↑ "Birmingham Ward last worked 2011". Retrieved 6 April 2017.
- ↑ "Birmingham Ward population 2011". Retrieved 6 April 2017.
- ↑ "Councillor Jayne Francis". Birmingham City Council. Retrieved 6 April 2017.
- ↑ "Birmingham City Council Election Results 2007". Birmingham City Council. Retrieved 6 April 2017.
- ↑ "Birmingham City Council Election Results 2006". Birmingham City Council. Retrieved 6 April 2017.
- ↑ "Birmingham City Council Election Results 2004". Birmingham City Council. Retrieved 6 April 2017.
- 1 2 3 "Birmingham City Council Election Results 1998-2002". Birmingham City Council. Retrieved 6 April 2017.