Birmingham City Council election, 2010
|
| |||||||||||||||||||||||||
| |||||||||||||||||||||||||
One third (40) seats to Birmingham City Council 61 seats needed for a majority | |||||||||||||||||||||||||
|---|---|---|---|---|---|---|---|---|---|---|---|---|---|---|---|---|---|---|---|---|---|---|---|---|---|
| |||||||||||||||||||||||||
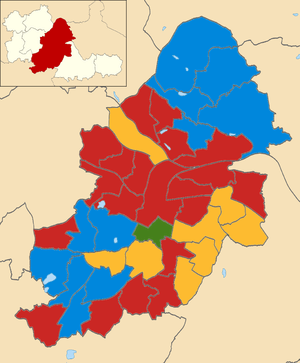 2010 local election results in Birmingham. | |||||||||||||||||||||||||
| |||||||||||||||||||||||||
The 2010 Birmingham City Council Election took place on 6 May 2010 to elect members of Birmingham City Council in the West Midlands, England. One third of the council was up for election, one seat in each of the city's 40 council wards,[1] with the election taking place at the same time as the general election.
Campaign
Before the election the council was under no overall control with the composition of the council being Conservative 49, Labour 36, Liberal Democrat 32 and Respect 3.[2] The Conservatives and Liberal Democrats ran the council in coalition, while Labour formed the main opposition.[3] 40 seats were up for election with 16 Conservative, 15 Labour, 9 Liberal Democrat and 1 Respect seats being defended.
Election results
| Party | Seats | Gains | Losses | Net gain/loss | Seats % | Votes % | Votes | +/− | |
|---|---|---|---|---|---|---|---|---|---|
| Conservative | 45 | 37.5 | 27.1 | 115,742 | |||||
| Labour | 41 | 34.2 | 36.8 | 156,951 | |||||
| Liberal Democrat | 31 | 25.8 | 24.6 | 104,902 | |||||
| Respect | 3 | 2.5 | 2.5 | 10,646 | |||||
| BNP | 0 | 0 | 4.8 | 20,578 | |||||
| Green | 0 | 0 | 2.5 | 10,651 | |||||
| UKIP | 0 | 0 | 0.7 | 3,136 | |||||
| Independent | 0 | 0 | 0.5 | 2,199 | |||||
| National Front | 0 | 0 | 0.17 | 727 | |||||
| Christian People's Alliance | 0 | 0 | 0.08 | 321 | |||||
| Social Democratic | 0 | 0 | 0.07 | 294 | |||||
| English Democrat | 0 | 0 | 0.06 | 272 | |||||
Council Composition
Prior to the election the composition of the council was:
| 49 | 36 | 32 | 3 |
| Conservative | Labour | Lib Dem | Respect |
After the election the composition of the council was:
| 45 | 41 | 31 | 3 |
| Conservative | Labour | Lib Dem | Respect |
Ward results
| Party | Candidate | Votes | % | ± | |
|---|---|---|---|---|---|
| Liberal Democrat | Iain David Bowen | 4,374 | 41.9 | ||
| Labour | Stewart Charles Stacey | 3,400 | 32.5 | ||
| Conservative | Joe Edginton | 1,416 | 13.6 | ||
| BNP | Carl Brisker | 686 | 6.6 | -5.0 | |
| Green | Amanda Baker | 280 | 2.7 | ||
| UKIP | John Butler | 233 | 2.2 | ||
| SDP | Alan Ware | 21 | 0.2 | +0.2 | |
| Majority | 974 | 9.4 | -21.0 | ||
| Liberal Democrat hold | Swing | ||||
| Party | Candidate | Votes | % | ± | |
|---|---|---|---|---|---|
| Labour | Ziaul Islam | 5,683 | 54.8 | ||
| Liberal Democrat | Sham Uddin | 3,360 | 32.4 | ||
| Conservative | Gareth Moore | 564 | 5.4 | ||
| Independent | Abdusalam Smith | 321 | 3.1 | ||
| Green | Alan Bale | 242 | 2.3 | ||
| Majority | 2,323 | 22.4 | |||
| Turnout | 53.1 | ||||
| Labour hold | Swing | ||||
| Party | Candidate | Votes | % | ± | |
|---|---|---|---|---|---|
| Conservative | Bruce Lines | 4,508 | 45.0 | ||
| Labour | Caroline Badley | 3,290 | 32.9 | ||
| Liberal Democrat | Julia Garrett | 1,267 | 12.8 | ||
| BNP | Trevor Sidney Lloyd | 807 | 8.0 | ||
| Green | Alan Clawley | 180 | 1.4 | ||
| Majority | |||||
| Turnout | 10,052 | 56.9 | |||
| Party | Candidate | Votes | % | ± | |
|---|---|---|---|---|---|
| Labour | Alexander Buchanan | 4,043 | |||
| Conservative | Susan Axford | 3,832 | |||
| Liberal Democrat | Philip Banting | 1,692 | |||
| BNP | Howard Hamilton | 1,235 | |||
| Green | John Bentley | 229 | |||
| Independent | Lol Stait | 149 | |||
| Majority | |||||
| Turnout | 58.8 | ||||
| Party | Candidate | Votes | % | ± | |
|---|---|---|---|---|---|
| Labour | Mohammed Aikhlaq | 5,486 | |||
| Liberal Democrat | Zaker Choudhry | 4,358 | |||
| Conservative | Aqil Zada | 896 | |||
| Green | Hazel Clawley | 376 | |||
| UKIP | Elaine Duffen | 299 | |||
| Majority | |||||
| Turnout | |||||
| Party | Candidate | Votes | % | ± | |
|---|---|---|---|---|---|
| Conservative | Rob Sealey | 4,781 | |||
| Labour Co-op | Nathan Matthew | 4,077 | |||
| Liberal Democrat | Tim Stimpson | 2,844 | |||
| Green | Charlene Bale | 752 | |||
| BNP | Paul Oakley | 670 | |||
| Majority | |||||
| Turnout | 67.9 | ||||
| Party | Candidate | Votes | % | ± | |
|---|---|---|---|---|---|
| Labour | Mike Leddy | 4,706 | |||
| Conservative | Derek Johnson | 3,772 | |||
| Liberal Democrat | Brian Peace | 1,929 | |||
| BNP | Lynette Orton | 731 | |||
| Green | Steven Austin | 347 | |||
| Christian Peoples | Morag Marinoni | 108 | |||
| Majority | |||||
| Turnout | 62.9 | ||||
| Party | Candidate | Votes | % | ± | |
|---|---|---|---|---|---|
| Conservative | Fergus David Robinson | 3,832 | |||
| Labour | Niki Constantinou | 3,036 | |||
| Liberal Democrat | Rob Hunter | 2,053 | |||
| Green | Ed Moss | 378 | |||
| BNP | Elizabeth Wainwright | 181 | |||
| Majority | |||||
| Turnout | 51.8 | ||||
| Party | Candidate | Votes | % | ± | |
|---|---|---|---|---|---|
| Conservative | Robert Alden | 4,539 | |||
| Labour | Mark McKenzie | 2,990 | |||
| Liberal Democrat | Philip Mills | 1,265 | |||
| BNP | Amanda Offord | 512 | |||
| Christian Peoples | Michael Warom | 133 | |||
| Majority | |||||
| Turnout | 57.3 | ||||
| Party | Candidate | Votes | % | ± | |
|---|---|---|---|---|---|
| Liberal Democrat | Paula Smith | 4,691 | |||
| Conservative | Bob Harvey | 3,336 | |||
| Labour | Rod Dungate | 2,882 | |||
| Respect | Rana Nazir | 1,136 | |||
| BNP | Brian Frank Maund | 538 | |||
| Green | Johnny Rafter | 225 | |||
| Majority | |||||
| Turnout | |||||
| Party | Candidate | Votes | % | ± | |
|---|---|---|---|---|---|
| Labour | Narinder Kooner | 6,741 | |||
| Liberal Democrat | Baljinder Kaur | 2,080 | |||
| Conservative | Mahinderpal Singh | 1,953 | |||
| Green | Elizabeth Sharman | 504 | |||
| Majority | |||||
| Turnout | |||||
| Party | Candidate | Votes | % | ± | |
|---|---|---|---|---|---|
| Conservative | Michael John Whitby | 4,640 | |||
| Labour | James McKay | 3,766 | |||
| Liberal Democrat | Mohammed Sagier | 1,609 | |||
| Green | Phil Simpson | 744 | |||
| BNP | Roy Bevington | 289 | |||
| Majority | |||||
| Turnout | |||||
| Party | Candidate | Votes | % | ± | |
|---|---|---|---|---|---|
| Labour | Tim Evans | 4,336 | |||
| Liberal Democrat | Hakil Ahmed | 2,830 | |||
| Conservative | Arshed Zaman | 1,598 | |||
| BNP | David Campion | 875 | |||
| UKIP | Waheed Rafiq | 214 | |||
| SDP | Peter Johnson | 192 | |||
| Green | Anna Masters | 154 | |||
| Majority | |||||
| Turnout | |||||
| Party | Candidate | Votes | % | ± | |
|---|---|---|---|---|---|
| Labour Co-op | Steve Bedser | 3,710 | |||
| Conservative | Jacquie Fear | 3,531 | |||
| Liberal Democrat | Nicholas Roberts | 1,548 | |||
| BNP | Malcolm Doughty | 541 | |||
| Green | Ged Hickman | 302 | |||
| Majority | |||||
| Turnout | |||||
| Party | Candidate | Votes | % | ± | |
|---|---|---|---|---|---|
| Labour | Des Hughes | 3,372 | |||
| Conservative | Gary Sambrook | 2,792 | |||
| BNP | Kevin McHugh | 891 | |||
| Liberal Democrat | Hubert Duffy | 866 | |||
| National Front | Terry Williams | 160 | |||
| Green | Lee Moore | 103 | |||
| Majority | |||||
| Turnout | |||||
| Party | Candidate | Votes | % | ± | |
|---|---|---|---|---|---|
| Labour | Carl Rice | 3,504 | |||
| Liberal Democrat | David Nikel | 2,338 | |||
| Conservative | Sharon Pennant | 1,684 | |||
| Green | James Robertson | 378 | |||
| Majority | |||||
| Turnout | |||||
| Party | Candidate | Votes | % | ± | |
|---|---|---|---|---|---|
| Labour | Ian Cruise | 3,769 | |||
| Conservative | Sue Barton | 3,652 | |||
| Liberal Democrat | Kevin Hannon | 1,601 | |||
| BNP | Michael Bell | 906 | |||
| Green | Joel Large | 175 | |||
| English Democrat | Vincent Schittone | 174 | |||
| Majority | |||||
| Turnout | |||||
| Party | Candidate | Votes | % | ± | |
|---|---|---|---|---|---|
| Labour | Hendrina Quinnen | 6,362 | |||
| Liberal Democrat | Mehnaz Khan | 1,704 | |||
| Conservative | Raja Khan | 1,646 | |||
| Independent | Abdul Azad | 308 | |||
| Green | Kirsty Tedstone | 301 | |||
| Majority | |||||
| Turnout | |||||
| Party | Candidate | Votes | % | ± | |
|---|---|---|---|---|---|
| Liberal Democrat | Ernie Hendricks | 4,300 | |||
| Labour | Martin Welds | 4,061 | |||
| Conservative | Maura Judges | 1,888 | |||
| Respect | Tahir Rehman | 1,420 | |||
| Green | William Lilley | 697 | |||
| BNP | Brian Haynes | 256 | |||
| Majority | |||||
| Turnout | |||||
| Party | Candidate | Votes | % | ± | |
|---|---|---|---|---|---|
| Labour | Chauhdry Abdul Rashid | 4,402 | |||
| Conservative | Mohammed Shahban | 1,203 | |||
| Liberal Democrat | Shazad Iqbal | 1,197 | |||
| Independent | Mohamed Sharif | 534 | |||
| Green | Janet Assheton | 478 | |||
| Majority | |||||
| Turnout | |||||
| Party | Candidate | Votes | % | ± | |
|---|---|---|---|---|---|
| Conservative | Randal Brew | 4,344 | |||
| Labour Co-op | Andrew Coulson | 3,631 | |||
| Liberal Democrat | Andrew Moles | 1,872 | |||
| BNP | Leslie Orton | 993 | |||
| UKIP | John Borthwick | 526 | |||
| Green | Tracie Hammond | 215 | |||
| Majority | |||||
| Turnout | |||||
| Party | Candidate | Votes | % | ± | |
|---|---|---|---|---|---|
| Labour | Barbara Dring | 4,048 | |||
| Conservative | Maria Green | 3,457 | |||
| Liberal Democrat | Nick Jolliffe | 1,501 | |||
| BNP | Richard Morris | 992 | |||
| National Front | Keith Axon | 241 | |||
| Green | Harry Eyles | 194 | |||
| Majority | |||||
| Turnout | |||||
| Party | Candidate | Votes | % | ± | |
|---|---|---|---|---|---|
| Liberal Democrat | Karen Hamilton | 4,163 | |||
| Labour | Brian Rhoden | 3,307 | |||
| Conservative | Paul Burke | 1,660 | |||
| BNP | Susan Morris | 620 | |||
| Green | Karl MacNaughton | 199 | |||
| Majority | |||||
| Turnout | |||||
| Party | Candidate | Votes | % | ± | |
|---|---|---|---|---|---|
| Labour | Matthew Gregson | 4,298 | |||
| Conservative | Jennifer James | 4,142 | |||
| Liberal Democrat | Ian Garrett | 1,413 | |||
| BNP | Stuart Bates | 647 | |||
| Green | Peter Beck | 354 | |||
| Majority | |||||
| Turnout | |||||
| Party | Candidate | Votes | % | ± | |
|---|---|---|---|---|---|
| Liberal Democrat | David Radcliffe | 4,536 | |||
| Labour | Brigid Jones | 3,142 | |||
| Conservative | Andrew Hardie | 2,214 | |||
| Green | James Burn | 453 | |||
| BNP | Zane Patchell | 230 | |||
| Christian Peoples | David Booth | 80 | |||
| Majority | |||||
| Turnout | |||||
| Party | Candidate | Votes | % | ± | |
|---|---|---|---|---|---|
| Labour | John Cotton | 3,824 | |||
| Conservative | Jessie Holland | 1,980 | |||
| BNP | Richard Lumby | 1,177 | |||
| Liberal Democrat | Christopher Barber | 1,110 | |||
| UKIP | Iain Roden | 308 | |||
| National Front | Mark Neary | 98 | |||
| English Democrat | Frank Parker | 98 | |||
| Green | Colette Tedstone | 70 | |||
| SDP | Joyce Ware | 35 | |||
| Majority | |||||
| Turnout | |||||
| Party | Candidate | Votes | % | ± | |
|---|---|---|---|---|---|
| Liberal Democrat | Mike Ward | 4,860 | |||
| Labour | Keith Culliford | 1,920 | |||
| Conservative | Amil Khan | 1,261 | |||
| BNP | Mark Wilson | 831 | |||
| UKIP | Richard Allen | 376 | |||
| National Front | Paul Morris | 101 | |||
| Green | Samantha Winsper | 79 | |||
| SDP | Joylan Ware | 46 | |||
| Majority | |||||
| Turnout | |||||
| Party | Candidate | Votes | % | ± | |
|---|---|---|---|---|---|
| Labour | Dorothy Hargreaves | 5,762 | |||
| Liberal Democrat | Mohammed Yaseen | 2,641 | |||
| Conservative | Robert Higginson | 957 | |||
| Green | Huw Davies | 262 | |||
| Majority | |||||
| Turnout | |||||
| Party | Candidate | Votes | % | ± | |
|---|---|---|---|---|---|
| Liberal Democrat | David Willis | 5,298 | |||
| Labour | Nawaz Ali | 3,212 | |||
| Conservative | Pervez Akhtar | 1,155 | |||
| BNP | Tanya Lumby | 681 | |||
| UKIP | Albert Duffen | 341 | |||
| Green | Helen Sauntson | 187 | |||
| National Front | Adrian Davidson | 127 | |||
| Majority | |||||
| Turnout | |||||
| Party | Candidate | Votes | % | ± | |
|---|---|---|---|---|---|
| Respect | Salma Yaqoob | 5,119 | |||
| Labour | Mohammed Azim | 3,878 | |||
| Conservative | Abdul Kadir | 1,027 | |||
| Liberal Democrat | Naeem Qureshi | 973 | |||
| Green | Charles Alldrick | 349 | |||
| Majority | |||||
| Turnout | |||||
| Party | Candidate | Votes | % | ± | |
|---|---|---|---|---|---|
| Labour | Mohammed Fazal | 4,225 | |||
| Liberal Democrat | Mohammed Fiaz | 3,362 | |||
| Respect | Saleem Younis | 2,971 | |||
| Conservative | Tim Hasker | 924 | |||
| BNP | Darren Allen | 328 | |||
| Green | David Ratcliff | 282 | |||
| Majority | |||||
| Turnout | |||||
| Party | Candidate | Votes | % | ± | |
|---|---|---|---|---|---|
| Liberal Democrat | Carol Jones | 4,834 | |||
| Labour | Gill Beddows | 2,470 | |||
| Conservative | Robert Clark | 1,353 | |||
| BNP | Ben Lumby | 911 | |||
| UKIP | Graham Duffen | 350 | |||
| Majority | |||||
| Turnout | |||||
| Party | Candidate | Votes | % | ± | |
|---|---|---|---|---|---|
| Labour | Penny Holbrook | 4,513 | |||
| Conservative | Simon Phillips | 2,753 | |||
| Liberal Democrat | Franklyn Aaron | 1,335 | |||
| BNP | Robert Offord | 514 | |||
| Green | Elly Stanton | 210 | |||
| Majority | |||||
| Turnout | |||||
| Party | Candidate | Votes | % | ± | |
|---|---|---|---|---|---|
| Conservative | Anne Underwood | 8,168 | |||
| Liberal Democrat | Richard Pearson | 2,396 | |||
| Labour | Manish Puri | 1,616 | |||
| BNP | Robert Grierson | 652 | |||
| Green | Ben Bradley | 430 | |||
| Majority | |||||
| Turnout | |||||
| Party | Candidate | Votes | % | ± | |
|---|---|---|---|---|---|
| Conservative | James Bird | 6,058 | |||
| Labour | Richard Costello | 2,179 | |||
| Liberal Democrat | Robert Hardware | 1,792 | |||
| Independent | Maureen Murphy | 887 | |||
| BNP | Roger Turner | 667 | |||
| Green | Jim Orford | 184 | |||
| Majority | |||||
| Turnout | |||||
| Party | Candidate | Votes | % | ± | |
|---|---|---|---|---|---|
| Conservative | Alberta Waddington | 6,468 | |||
| Labour | Roger Barley | 2,580 | |||
| Liberal Democrat | Maureen Parker | 2,518 | |||
| BNP | Michael Jones | 656 | |||
| Green | Joe Rooney | 313 | |||
| Majority | |||||
| Turnout | |||||
| Party | Candidate | Votes | % | ± | |
|---|---|---|---|---|---|
| Conservative | Alan Rudge | 6,346 | |||
| Labour | Robert Pocock | 3,798 | |||
| Liberal Democrat | Sidney Woods | 2,526 | |||
| Majority | |||||
| Turnout | |||||
| Party | Candidate | Votes | % | ± | |
|---|---|---|---|---|---|
| Labour | Lynda Clinton | 3,846 | |||
| Conservative | Tim Wilson | 2,217 | |||
| Liberal Democrat | Trevor Holtom | 1,911 | |||
| BNP | Graham Jones | 688 | |||
| Majority | |||||
| Turnout | |||||
| Party | Candidate | Votes | % | ± | |
|---|---|---|---|---|---|
| Labour | Mohammed Idrees | 7,511 | |||
| Liberal Democrat | Saleem Malik | 3,057 | |||
| Conservative | Asifa Khan | 998 | |||
| UKIP | Adrian David Duffen | 489 | |||
| Majority | |||||
| Turnout | |||||
| Party | Candidate | Votes | % | ± | |
|---|---|---|---|---|---|
| Conservative | Peter Osborn | 3,639 | |||
| Labour | Christopher Hillcox | 3,575 | |||
| Liberal Democrat | Trevor Sword | 1,694 | |||
| BNP | Trevor Shearer | 873 | |||
| Green | David Toke | 277 | |||
| Majority | |||||
| Turnout | |||||
References
- ↑ "Councillors by Ward". Birmingham City Council. Retrieved 2010-04-13.
- ↑ "Birmingham City Council - Composition". Birmingham City Council. Retrieved 2010-04-13.
- ↑ "Birmingham City Council elections - who is standing in your area". Birmingham Mail. 2010-04-13. Retrieved 2010-04-13.
- ↑ "Local Elections 2010 - Results". Birmingham City Council. Retrieved 2010-05-08.