1996 Lake Huron cyclone
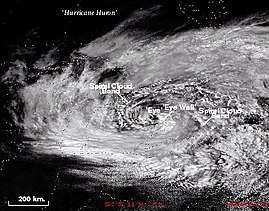 "Hurricane Huron" at peak intensity on September 14. | |
| Formed | September 11, 1996 |
|---|---|
| Dissipated | September 15, 1996 |
| Lowest pressure | 993 mb (29.32 inHg) |
| Highest winds | |
| Damage | Unknown (flooding) |
| Total fatalities | None |
| Areas affected | Great Lakes region |
| Unofficially part of the 1996 Atlantic hurricane season | |
The 1996 Lake Huron cyclone (commonly known as Hurricane Huron, or the Huroncane) was a strong cyclonic storm system that developed over Lake Huron in September 1996. The system resembled a subtropical cyclone at its peak, having some characteristics of a tropical cyclone.[1]
Meteorological history
On September 11, 1996, a weak low-pressure area was situated close to Lake Superior.[2] Near the surface, its central pressure was 1,012.0 hectopascals (29.88 inHg) over Lake Michigan. There was also a shortwave at the 500 hPa level (18,000 ft above mean sea level) over Ontario. The northwest tilt of the low with height indicated that the surface center was in a stage of baroclinic development. In addition to this, analysis concluded that the cyclone had a cold core in the mid-troposphere. Analysis at the 700 (around 10,000 ft above mean sea level) and 850 millibar (around 5,000 ft above mean sea level) pressure levels indicated that the cyclone also had a cold core within the lower troposphere.[2]
The cyclone's overall strength increased, with surface winds building from 11 mph (18 km/h) to 67 mph (108 km/h).[2] This occurred while positive vorticity and thermal advection were causing moderate rain showers over Ontario, with a broken area of thunderstorms present just ahead of an advancing cold front. By September 12, the cyclone moved southward to a position over Lake Huron, with upper portions centered to the west over Michigan. During this 24-hour period, the cyclone's central pressure fell from 1,012.0 hectopascals (29.88 inHg) to 1,006.0 hectopascals (29.71 inHg). After 1200 UTC September 12, the low moved southeastward and became vertically stacked from the surface up to the 500 millibar pressure surface (located 18,000 ft above mean sea level).[2]
For a brief time, the portions of the cyclone at the 300 and 200 mbar pressure levels moved southeastward over Lake Huron.[2] The greatest intensification occurred below the 500 mbar level. As the cyclone's tilt was neutral, or stacked with height, the storm was in the occlusion (or warm seclusion) stage of cyclone development. As the cyclone proceeded through this stage, the cold front, which was connected to the surface low, became an occluded front as it caught up with the surface warm front. The occluded front extended from Lake Huron to Pennsylvania on September 13. A 155-mile (250 km) swath of showers and thunderstorms was positioned across the frontal zone.[2] Also at this time, a third area of showers was centered near the occluded low.
Between 1200 UTC on September 13 and 0000 UTC on September 14, a shortwave rotated throughout the area of the occluded low. This caused the mid-level portion of the cyclone to move eastward, centering itself just east of Lake Huron.[2] During the same period, the surface low moved slowly over Lake Huron and fell five more millibars to 999.0 hectopascals (29.50 inHg). In response to this change, the maximum sustained winds increased as well. After 0000 UTC September 14, the lower and mid-tropospheric portions of the cyclone moved westward, becoming stacked atop one another again, but this time up through the 200 mbar pressure level. In contrast to the earlier developments, the baroclinicity of the system diminished rapidly. However, the lower tropospheric area continued to intensify, dropping to 993.0 hectopascals (29.32 inHg), with major height falls seen aloft.[2] The lowered baroclinicity determined that the heat fluxes may have spawned the intensification. At the time of its peak intensity, the cyclone had maximum sustained winds of 73 miles per hour (117 km/h), equivalent to that of a powerful tropical storm.[3]
Between 1200 UTC on September 14 and 0000 UTC on September 15, visible satellite imagery of the vortex revealed a resemblance to a tropical cyclone, with an eye-like feature about 19 miles (30 km) wide.[2] In addition to the eye, convective clouds had also formed, creating an eyewall resembling that of a tropical cyclone.[4] Furthermore, feeder bands of convective showers continued extending westward to about 310 miles (500 km). Soon after the cyclone passed Buoy 45008, winds turned to the east-northeast and rapidly increased. In contrast to the earlier period of the storm's life, which had more energy in the high levels (like a cold-core low), now the system was now stronger near the surface (similar to a warm-core low). Surface analysis indicated that a weaker cyclonic circulation persisted over the eastern shore of Lake Huron, with another center north of Lake Ontario.[2] During this 12-hour period, the cyclone diminished rapidly, mainly in the lower troposphere. Twelve-hour cloud height rises also occurred, ranging from 66–197 feet (20–60 m). On September 15, the cyclone decayed and left Lake Huron.[2]
Impact
Excessive rain of over 4 inches (100 mm) fell over the land surrounding the Great Lakes. This caused flooding in both the United States around Buffalo, New York and on the eastern shore of Lake Huron in Ontario.[2]
See also
- 1996 Atlantic hurricane season
- Hurricane Fran
- Subtropical cyclone
- Extratropical cyclone
- 2006 Central Pacific cyclone
- Subtropical Cyclone Katie
- 2018 Southeast Pacific subtropical cyclone
- South Atlantic tropical cyclone
- Mediterranean tropical-like cyclone
- List of storms on the Great Lakes
- List of Canada hurricanes
- Brown ocean effect
References
- ↑ Jonathan Erdman; Eric Chaney (17 November 2016). "'Hurricane Huron': The Oddest Storm to Ever Hit the Great Lakes?". Weather Underground. Retrieved 22 November 2017.
- 1 2 3 4 5 6 7 8 9 10 11 12 Todd J. Miner (Penn State University); Peter J. Sousounis; James Wallman; Greg Mann. "Hurricane Huron". AMS Online Journals. Retrieved 25 August 2016.
- ↑ Miland Brown (6 August 2009). "World History Blog: The Great Lakes Hurricane of 1996". Retrieved 25 August 2016.
- ↑ William R. Deedler. "Hurricanes in Michigan???". National Oceanic and Atmospheric Administration. Archived from the original on 20 December 2014. Retrieved 25 August 2016.
External links
- Peter J. Sousounis, James Wallman, Greg E. Mann, and Todd J. Miner (March 2001). ""Hurricane Huron": An Example of an Extreme Lake-Aggregate Effect in Autumn". American Meteorological Society. Retrieved September 30, 2017.
- "WHYY Franklin Facts: Thursday September 12 – "Hurricane Huron"". 12 September 2002. Retrieved 25 August 2016.
- "Hurricane Huron – September 1996". YouTube. 5 December 2009. Retrieved 25 August 2016.
- Miland Brown (6 August 2009). "World History Blog: The Great Lakes Hurricane of 1996". Retrieved 25 August 2016.
- John Taylor; Jay Larson; Sheri Voeltz (2001). "Climate Modelling at the Regional Scale" (PDF). Argonne National Laboratory. Retrieved 25 August 2016. (Paper discussing computer simulations of "Hurricane Huron").