1976 Atlantic hurricane season
| 1976 Atlantic hurricane season | |
|---|---|
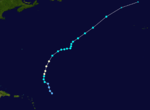
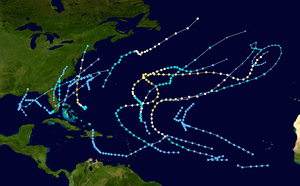 Season summary map | |
| Seasonal boundaries | |
| First system formed | May 21, 1976 |
| Last system dissipated | October 28, 1976 |
| Strongest storm | |
| Name | Belle |
| • Maximum winds |
120 mph (195 km/h) (1-minute sustained) |
| • Lowest pressure | 957 mbar (hPa; 28.26 inHg) |
| Seasonal statistics | |
| Total depressions | 23 |
| Total storms | 10 |
| Hurricanes | 6 |
| Major hurricanes (Cat. 3+) | 2 |
| Total fatalities | 72 total |
| Total damage | $100 million (1976 USD) |
| Related articles | |
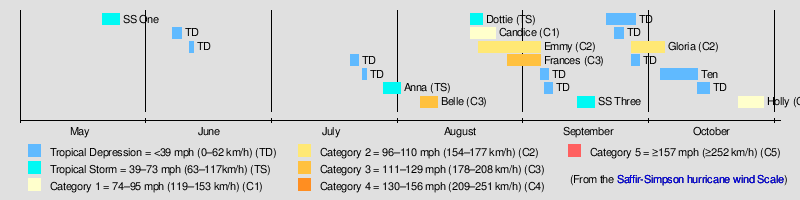
The 1976 Atlantic hurricane season was an average Atlantic hurricane season, officially starting on June 1, 1976, and ending on November 30, dates which conventionally limit the period of each year when most tropical cyclones develop in the Atlantic Ocean. The season produced 23 tropical cyclones, of which ten developed into named storms; six became hurricanes, and two attained major hurricane status. The strongest hurricane of the season was Hurricane Belle, which reached Category 3 status on the Saffir-Simpson Hurricane Scale east of North Carolina; Belle later struck Long Island, New York, as a Category 1 hurricane, causing $100 million in damage (1976 USD) and a total of five deaths across the New England region of the United States.
The season began with Subtropical Storm One on May 21, prior to the official start of the season; the bounds of the season are from June 1 to November 30, which conventionally delimit the period of each year when most tropical cyclones form in the Atlantic basin. Tropical Storm Dottie caused flooding rains in Florida that caused a total of four deaths. In early September, Hurricane Emmy caused 68 indirect deaths when a Venezuelan Air Force plane carrying a school choir crashed on a landing attempt at Lajes Air Base in the Azores during the storm.
Seasonal summary
Officially, the 1976 hurricane season began on June 1 and ended November 30;[1][2] however, the first system – Subtropical Storm One – developed on May 21.[3] Conditions across the Atlantic were somewhat unfavorable for tropical cyclogenesis throughout the year, with high wind shear dominating the Caribbean Sea and Gulf of Mexico. The bulk of the season's activity was confined to August when five named storms formed.[4]
Compared the previous ten year average of storms per season, the 1976 season was considered an average one. However, the lack of activity in both the Caribbean Sea and Gulf of Mexico was considered a rare event that had only occurred one other time in 1962 since 1900.[4]
The year's activity was reflected with a cumulative accumulated cyclone energy (ACE) rating of 84,[5] classifying it as a "near-normal" season.[6] ACE is, broadly speaking, a measure of the power of the hurricane multiplied by the length of time it existed, so storms that last a long time, as well as particularly strong hurricanes, have high ACEs. It is only calculated on tropical systems at or exceeding 39 mph (63 km/h), which is tropical storm strength.[7]
Systems
Subtropical Storm One
| Subtropical storm (SSHWS) | |
  | |
| Duration | May 21 – May 25 |
|---|---|
| Peak intensity | 50 mph (85 km/h) (1-min) 994 mbar (hPa) |
On May 19 an upper-level trough produced widespread thunderstorms over the Gulf of Mexico. Slowly, the system organized, first to a subtropical depression on May 21, then to a subtropical storm on May 23. The storm began to move faster, and on May 23, it hit the Florida Panhandle. After moving across Georgia at a forward motion of 25 mph (40 km/h) the storm reached its peak of maximum sustained winds reaching 50 mph (85 km/h) while southeast of the Carolinas on May 24.[8] After transitioning into an extratropical cyclone, the system traveled generally northeast and ultimately dissipated on May 31 south of Iceland.[9]
Heavy rainfall was associated with the system, but the precipitation was generally beneficial due to dry conditions.[8] The storm spawned nine tornadoes in Florida,[10] one of which destroyed 6 mobile homes and damaged 40 others; demolished 6 large chicken houses; and severely damaged a paint plant in Hillsborough County. Overall, the tornadoes left about $628,000 in damage.[11] A total of 3,364 household lost power in the Hillsborough County after three circuits were blown down.[12] Some wind damage occurred in northeastern Palm Beach County, mostly limited to a few roofs damaged and downed trees, electrical poles, and power lines.[13] The storm left about 15,000 people without electricity in Broward County, though most outages were restored quickly. Boat traffic along the New River was backed-up due to the storm causing the draw bridge to malfunction.[14]
Tropical Storm Anna
| Tropical storm (SSHWS) | |
  | |
| Duration | July 28 – August 1 |
|---|---|
| Peak intensity | 45 mph (75 km/h) (1-min) 999 mbar (hPa) |
A non-tropical low pressure area developed over the central Atlantic in late July. After merging the low merged with a polar trough on July 28,[15] a subtropical depression developed about 800 mi (1,300 km) east-southeast of Bermuda at 18:00 UTC. The subtropical depression moved eastward and strengthened, becoming a subtropical storm early on July 30.[3] At 02:00 UTC, the ship M.S. Pointe Allegre observed a barometric pressure of 999 mbar (29.5 inHg) and wind gusts as high as 69 mph (111 km/h).[16] The cyclone peaked with maximum sustained winds of 45 mph (75 km/h) at 12:00 UTC on July 30. Curving east-northeastward, the system also acquired tropical characteristics, with a transition to Tropical Storm Anna becoming complete about six hours later.[3] The surface ridge to the north and east caused Anna to begin curving northeastward on August 1.[16] Anna soon lost tropical characteristics and became an extratropical cyclone while situated about 110 mi (180 km) east-southeast of the Azores. The remnants moved in a circular path and approached the Azores from the north, before dissipating on August 16.[3] Gale-force winds were reported in the Azores after Anna became extratropical.[16]
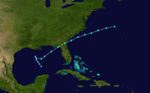
Hurricane Belle
| Category 3 hurricane (SSHWS) | |
 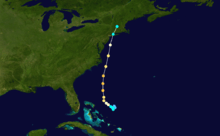 | |
| Duration | August 6 – August 10 |
|---|---|
| Peak intensity | 120 mph (195 km/h) (1-min) 957 mbar (hPa) |
In late July, a tropical wave emerged off the west coast of Africa. Traversing the Atlantic Ocean for more than a week, the system eventually consolidated into a tropical depression near the Bahamas on August 6. Remaining nearly stationary for a day, the depression strengthened into a tropical storm on August 7 and a hurricane later that day as it acquired a northwest motion. Formation of an eye accompanied quick intensification and Belle reached its peak the following day with winds of 120 mph (195 km/h).[3][17] The hurricane subsequently turned north and accelerated, skirting the Outer Banks of North Carolina. Early on August 10, Belle made landfall in Long Island, New York, as a minimal hurricane before moving inland over southern New England as a tropical storm hours later. Thereafter, Belle transitioned into an extratropical cyclone before moving over Atlantic Canada.[17] The system turned east while over the north Atlantic and ultimately dissipated on August 15 to the south of Iceland.[18]
Threatening much of the East Coast of the United States, hurricane warnings were issued from Georgia to Maine. An estimated 500,000 people evacuated coastal areas accordingly.[17] Five people lost their lives in a car accident on a rain-slicked highway near the North Carolina–Virginia state line;[19] another person died due to a car accident in Norfolk, Virginia.[17] In New York, damage on Long Island reached $8 million, of which $3 million stemmed from erosion at Rockaway Beach.[20] One person was killed in New York when a branch snapped off a tree due to high winds and fell on her.[17] Approximately 36,000 residents in the lower Hudson Valley lost electricity.[21] In Connecticut, strong winds in Bridgeport downed trees, which fell on barns, porches, and homes.[22] About 247,000 people lost electricity throughout the state.[23] Three deaths occurred in Connecticut, one from an accident caused by slippery roads and the other two from carbon monoxide poisoning from a generator.[17][24] Flooding was reported across New England and was especially severe in Vermont. The hardest hit town was Chester, where 35 of its 85 roads flooded and 5 bridges were washed out. Two people died in Huntington after the footbridge they were crossing collapsed into the Huntington River.[23] A total of 12 people lost their lives and damage reached an estimated $100 million.[17][19][24] Some damage also took place in New Brunswick from heavy rain.[25]
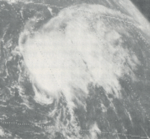
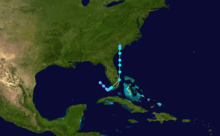
Tropical Storm Dottie
| Tropical storm (SSHWS) | |
  | |
| Duration | August 18 – August 21 |
|---|---|
| Peak intensity | 50 mph (85 km/h) (1-min) 996 mbar (hPa) |
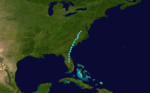
An area of low pressure in the southeastern Gulf of Mexico developed into a tropical depression early on August 18. The depression drifted east and northeastward over the next day, before beginning to accelerate on August 19. The cyclone further intensified into Tropical Storm Dottie by 12:00 UTC.[26] Shortly thereafter, Dottie made landfall in Florida over mainland Monroe County.[3] The cyclone quickly proceeded northeastward before re-emerging into the Atlantic near Palm Beach.[26] Dottie moved northward and peaked with winds of 50 mph (85 km/h) at 06:00 UTC on August 20,[27] before subsequently weakening due to wind shear. By the time Dottie made landfall in Charleston, South Carolina, early on August 21, it was barely of tropical storm intensity.[26] It deteriorated into a tropical depression on August 21 and dissipated shortly thereafter.[27] The remnant low pressure system turned southward and once again entered the Atlantic before turning westward and crossing the Florida peninsula.[28]
Dottie dropped heavy rainfall in South Florida, with a peak total of 10.86 in (276 mm).[29] However, impact from the precipitation was mainly limited to street flooding in several cities,[30] which delayed the commute of thousands of motorists during morning rush hour traffic, especially in Miami.[31] Tropical storm force wind gusts damaged a roof in Marathon, downed some trees,[30] and disrupted electricity in at least 20 neighborhoods,[32] though wind damage overall was minor.[30] In the Bahamas, a fishing boat capsized near Grand Bahama, drowning four of its occupants.[28] Rainfall was generally light in the Carolinas, though 7.78 in (198 mm) of precipitation fell in Carolina Beach, North Carolina,[26] flooding some areas of the city with up to 5 ft (1.5 m) of water.[30] However, rainfall was mostly beneficial due to a severe drought. Beach erosion occurred due to tides reaching 3.5 ft (1.1 m) normal at Atlantic Beach.[26]
Hurricane Candice
| Category 1 hurricane (SSHWS) | |
  | |
| Duration | August 18 – August 24 |
|---|---|
| Peak intensity | 90 mph (150 km/h) (1-min) 964 mbar (hPa) |
On August 11, a cold-core low was located south of Bermuda. Over the next week, the system warmed and moved toward the surface.[33] Around 12:00 UTC on August 18, the low developed into a tropical depression about 200 mi (320 km) west-southwest of the island,[3] after satellite imagery showed better organization and a ship reporting winds gusting to 46 mph (74 km/h).[33] Moving fairly quickly to the north-northeast, the depression intensified into Tropical Storm Candice about six hours later. Candice curved east-northeastward early on August 20 and weakened slightly, before re-strengthening later that day. By 06:00 UTC on August 20, the cyclone intensified into a hurricane. Around that time, Candice had decelerated and briefly turned to the southeast, before pivoting northeastward on August 21. Candice continued to intensify, peaking with sustained winds of 90 mph (150 km/h) and a minimum pressure of 964 mbar (28.5 inHg) later on the following day.[3] The hurricane then accelerated due to an approaching cold front, before merging with the front about 475 mi (765 km) east of Newfoundland at 12:00 UTC on August 24.[3][33]
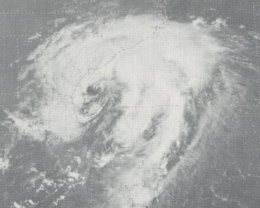
Hurricane Emmy
| Category 2 hurricane (SSHWS) | |
.JPG)  | |
| Duration | August 20 – September 4 |
|---|---|
| Peak intensity | 105 mph (165 km/h) (1-min) 974 mbar (hPa) |
A tropical wave emerged into the Atlantic from the west coast of Africa on August 15. The wave moved westward at 17 to 23 mph (27 to 37 km/h) before developing into a tropical depression on August 20,[34] while it was situated approximately 1,150 mi (1,850 km) east of the Lesser Antilles. The depression strengthened into Tropical Storm Emmy on August 22 as it moved west-northwestward, about two days before recurving to the northeastward. After intensifying into a Category 1 hurricane on August 25,[3] the storm began moving eastward due to a frontal low pressure system located to the northeast.[34] Late on August 26, Emmy strengthened into a Category 2 hurricane while moving northeastward.[3]
The hurricane resumed its west-northwestward course late on August 27,[3] before again turning to the east early on August 29 due to strong upper-level westerlies.[34] At 12:00 UTC, Emmy attained its peak intensity with maximum sustained winds of 105 mph (165 km/h) and a minimum barometric pressure of 974 mbar (28.8 inHg). The cyclone slowly weakened while moving eastward, falling to Category 1 intensity on September 1. Emmy briefly headed east-southeastward, before turning to the north-northeast on September 2.[3] Between late on the following day and early on September 4, Emmy passed through the Azores, before being absorbed by Hurricane Frances shortly after moving north of the islands. Damage in Azores was apparently not significant, though the storm caused 68 deaths when a Venezuelan Air Force plane carrying a school choir crashed on a landing attempt at Lajes Air Base.[34]
Hurricane Frances
| Category 3 hurricane (SSHWS) | |
.JPG) 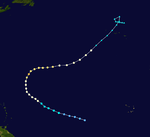 | |
| Duration | August 27 – September 4 |
|---|---|
| Peak intensity | 115 mph (185 km/h) (1-min) 963 mbar (hPa) |
Like Emmy, the tropical depression that became Hurricane Frances formed from a tropical wave on August 27, while midway between the Lesser Antilles and the coast of Africa. The next day, it became a tropical storm, and on August 30, Frances became a hurricane. As it recurved to the north and east, Frances reached its peak of 115 mph (185 km/h) on September 1. Steady weakening occurred afterwards, and Frances became extratropical on September 4.
Subtropical Storm Three
| Subtropical storm (SSHWS) | |
 | |
| Duration | September 13 – September 17 |
|---|---|
| Peak intensity | 45 mph (75 km/h) (1-min) 1011 mbar (hPa) |
On September 12, the interaction between mid-tropospheric low and a diffuse stationary front led to the formation of a low pressure system over central Florida. As it moved north-northeastward, it developed a circulation and became a subtropical depression on September 13. The next day it became a subtropical storm, and reached its peak of 45 mph (75 km/h) over the western tropical Atlantic, off the coast of Georgia. The storm quickly made landfall near Charleston, South Carolina, and dissipated over southern Virginia on September 17.
Hurricane Gloria
| Category 2 hurricane (SSHWS) | |
  | |
| Duration | September 26 – October 4 |
|---|---|
| Peak intensity | 105 mph (165 km/h) (1-min) 970 mbar (hPa) |
A tropical wave became a tropical depression on September 26, located 400 miles (640 km) northeast of the Lesser Antilles. On September 27 while moving northward, it strengthened to become Tropical Storm Gloria. After moving northwestward for a day, Gloria moved northeast, strengthening to a 105 mph (165 km/h) hurricane on September 30. Steady weakening ensued, and Gloria lost its tropical characteristics on October 4.
Hurricane Holly
| Category 1 hurricane (SSHWS) | |
  | |
| Duration | October 22 – October 28 |
|---|---|
| Peak intensity | 75 mph (120 km/h) (1-min) 990 mbar (hPa) |
A tropical wave emerged from the west coast of Africa on October 14. The wave initially remained relatively weak, until convection began concentrating near the center while it was situated well east of the Lesser Antilles on October 20. After further organization,[35] a tropical depression developed at 18:00 UTC on October 22 roughly 405 mi (650 km) east-northeast of the Leeward Islands. The depression moved north-northwestward and strengthened into Tropical Storm Holly about 24 hours later. Shortly thereafter, the storm curved north-northeastward and intensified at a faster pace. At 12:00 UTC on October 24, Holly became a Category 1 hurricane and peaked with maximum sustained winds of 75 mph (120 km/h) and a minimum barometric pressure of 990 mbar (29 inHg).[3] However, the system weakened back to a tropical storm about 24 hours later due to interaction with an upper trough. Early on October 27, Holly began accelerating northeastward ahead of a cold front.[35] The storm merged with the cold front late on October 28 about 400 mi (640 km) northwest of the Azores.[3] The remnants quickly became indistinguishable.[35]
Other systems
Throughout the 1976 season, there were 11 tropical depressions monitored that did not achieve gale intensity. The first such system developed just north of Grand Bahama in the Bahamas on June 7. Moving north-northeastward for much of its duration, the depression strengthened slightly to reach winds of 35 mph (55 km/h). However, it failed to become a tropical storm before weakening and dissipating about 155 mi (250 km) south of Nantucket island in Massachusetts on June 9. Two days after the previous depression dissipated, another tropical depression formed over Hendry County, Florida.[3] Light rainfall was recorded in West Palm Beach, while several waterspouts were reported in Lake Okeechobee near Clewiston.[36] The depression moved northeastward and quickly emerged into the Atlantic. About 30 hours after developing, the depression dissipated approximately 310 mi (500 km) northwest of Bermuda on June 12. Activity in the Atlantic then ceased for more than a month, until a tropical depression formed about 355 mi (571 km) southeast of Cape Hatteras in North Carolina on July 20. The depression moved north-northwestward, before turning northeastward on the following day. It dissipated about halfway between Cape Hatteras and Bermuda on July 22. The next depression formed about 300 mi (480 km) south of the Cape Verde Islands on July 23. Trekking just south of due west, the cyclone was short-lived and dissipated by the following day.[3]
Tropical Depression Ten in early October brought heavy rains to Puerto Rico.[37]
Storm names
The following names were used for named storms that formed in the Atlantic basin in 1976.[1] No storms were retired following the season; however, an overhaul of the naming system in 1979 to include male names resulted in the majority of this list being discarded.[38] The exceptions were Frances, Gloria, Kay, Maria, and Pamela.
|
|
Season effects
This is a table of all of the storms that have formed during the 1976 Atlantic hurricane season. It includes their names, duration, peak strength, areas affected, damage, and death totals. Deaths in parentheses are additional and indirect (an example of an indirect death would be a traffic accident), but were still related to that storm. Damage and deaths include totals while the storm was extratropical, a wave, or a low, and all of the damage figures are in 1976 USD.
| Saffir–Simpson scale | ||||||
| TD | TS | C1 | C2 | C3 | C4 | C5 |
| Storm name |
Dates active | Storm category
at peak intensity |
Max 1-min wind mph (km/h) |
Min. press. (mbar) |
Areas affected | Damage (USD) |
Deaths | Refs | ||
|---|---|---|---|---|---|---|---|---|---|---|
| One | May 21 – 25 | Subtropical storm | 50 (85) | 994 | Southeastern United States | Minimal | None | |||
| Depression | June 7 – 9 | Tropical depression | 35 (55) | N/A | None | None | None | |||
| Depression | June 11 – 12 | Tropical depression | 35 (55) | N/A | Florida | None | None | |||
| Depression | July 20 – 22 | Tropical depression | 30 (45) | N/A | None | None | None | |||
| Depression | July 23 – 24 | Tropical depression | 30 (45) | N/A | None | None | None | |||
| Anna | July 28 – August 1 | Tropical storm | 45 (75) | 999 | Azores | None | None | |||
| Belle | August 6 – 10 | Category 3 hurricane | 120 (195) | 957 | North Carolina, Mid-Atlantic states, New England, Atlantic Canada | 101 | 12 | |||
| Dottie | August 18 – 21 | Tropical storm | 50 (85) | 996 | Southeastern United States, Bahamas | Minimal | 4 | |||
| Candice | August 18 – 24 | Category 1 hurricane | 90 (150) | 964 | None | None | None | |||
| Emmy | August 20 – September 4 | Category 2 hurricane | 105 (165) | 974 | Lesser Antilles, Azores | Minimal | 68 | |||
| Frances | August 27 – September 4 | Category 3 hurricane | 115 (185) | 963 | Azores | None | None | |||
| Depression | September 4 – 6 | Tropical depression | 30 (45) | N/A | None | None | None | |||
| Depression | September 5 – 7 | Tropical depression | 30 (45) | N/A | None | None | None | |||
| Three | September 13 – 17 | Subtropical storm | 50 (85) | 1011 | Southeastern United States | None | None | |||
| Depression | September 20 – 27 | Tropical depression | 35 (55) | N/A | None | None | None | |||
| Depression | September 22 – 24 | Tropical depression | 30 (45) | N/A | None | None | None | |||
| Gloria | September 26 – October 4 | Category 2 hurricane | 105 (165) | 970 | None | None | None | |||
| Depression | September 26 – 28 | Tropical depression | 35 (55) | N/A | None | None | None | |||
| Ten | October 3 – 12 | Tropical depression | 35 (55) | N/A | Lesser Antilles, Hispaniola, Puerto Rico | None | None | |||
| Depression | October 12 – 15 | Tropical depression | 35 (55) | N/A | None | None | None | |||
| Holly | October 22 – 28 | Category 1 hurricane | 75 (120) | 990 | None | None | None | |||
| Season Aggregates | ||||||||||
| 21 systems | May 21 – October 29 | 120 (195) | 957 | 101 | 84 | |||||
See also
- List of Atlantic hurricanes
- List of Atlantic hurricane seasons
- 1976 Pacific hurricane season
- 1976 Pacific typhoon season
- 1976 North Indian Ocean cyclone season
- Southern Hemisphere tropical cyclone seasons: 1975–76, 1976–77
References
- 1 2 "Hurricane Unit Ready for 'Crying Wolf' Charges". The Danville Register. Miami, Florida. Associated Press. May 23, 1976. p. 8B. – via Newspapers.com (subscription required)
- ↑ "Hurricane Season Ends". The Naples Daily News. Miami, Florida. United Press International. November 30, 1976. p. 9A. – via Newspapers.com (subscription required)
- 1 2 3 4 5 6 7 8 9 10 11 12 13 14 15 16 17 "Atlantic hurricane best track (HURDAT version 2)". Hurricane Research Division (Database). National Hurricane Center. May 1, 2018. Retrieved October 13, 2018.
- 1 2 Miles B. Lawrence (April 1977). "Atlantic Hurricane Season of 1976: General Summary" (PDF). Monthly Weather Review. American Meteorological Society. 105 (4): 497–498. Bibcode:1977MWRv..105..497L. doi:10.1175/1520-0493(1977)105<0497:AHSO>2.0.CO;2. Retrieved June 17, 2015.
- ↑ "Atlantic basin Comparison of Original and Revised HURDAT". Hurricane Research Division. National Oceanic and Atmospheric Administration. March 2011. Retrieved June 17, 2015.
- ↑ "Background Information: The North Atlantic Hurricane Season". Climate Prediction Center. National Oceanic and Atmospheric Administration. August 7, 2014. Retrieved June 17, 2015.
- ↑ David Levinson (August 20, 2008). "2005 Atlantic Ocean Tropical Cyclones". National Climatic Data Center. Retrieved June 17, 2015.
- 1 2 Miles B. Lawrence (April 1977). "Atlantic Hurricane Season of 1976: Subtropical storm no. 1, 21-25 May" (PDF). Monthly Weather Review. American Meteorological Society. 105 (4): 507. Bibcode:1977MWRv..105..497L. doi:10.1175/1520-0493(1977)105<0497:AHSO>2.0.CO;2. Retrieved June 17, 2015.
- ↑ Elwyn E. Wilson, ed. (November 1976). "Marine Weather Review: Principal Tracks of Centers of Cyclones at Sea Level, North Atlantic May 1976". Mariners Weather Log. Washington, D.C. National Oceanic and Atmospheric Administration, Environmental Data Service. 20 (6): 354.
- ↑ "9 Tornadoes Hit Florida". The News-Press. Associated Press. May 24, 1976. p. 2A. Retrieved August 14, 2017 – via Newspapers.com.

- ↑ "Storm Data and Unusual Weather Phenomena" (PDF). Storm Data. Asheville, North Carolina: National Climatic Data Center. 18 (5). May 1976. ISSN 0039-1972. Retrieved August 14, 2017.
- ↑ "Tornado". St. Petersburg Times. May 24, 1976. p. 12. Retrieved August 14, 2017.
- ↑ Peter Cook and Dave Reddick (May 24, 1976). "High Winds Cause Damage in County". The Palm Beach Post. p. A1. Retrieved August 14, 2017 – via Newspapers.com.
- ↑ Steve Parker (May 24, 1976). "Storm Left Thousands Powerless". Fort Lauderdale News. p. 1. Retrieved August 14, 2017 – via Newspapers.com.
- ↑ A. James Wagner (October 1976). "Weather and Circulation of July 1976". Monthly Weather Review. Washington, D.C.: National Weather Service. 104 (10): 1340. Bibcode:1976MWRv..104.1333W. doi:10.1175/1520-0493(1976)104<1333:WACOJ>2.0.CO;2. Retrieved June 13, 2017.
- 1 2 3 Miles B. Lawrence (April 1977). "Atlantic Hurricane Season of 1976: Subtropical storm no. 1, 21-25 May" (PDF). Monthly Weather Review. American Meteorological Society. 105 (4): 499–500. Bibcode:1977MWRv..105..497L. doi:10.1175/1520-0493(1977)105<0497:AHSO>2.0.CO;2. Retrieved June 13, 2017.
- 1 2 3 4 5 6 7 Miles B. Lawrence (April 1977). "Atlantic Hurricane Season of 1976: Hurricane Belle, 6-10 August" (PDF). Monthly Weather Review. American Meteorological Society. 105 (4): 500–504. Bibcode:1977MWRv..105..497L. doi:10.1175/1520-0493(1977)105<0497:AHSO>2.0.CO;2. Retrieved June 4, 2015.
- ↑ Elwyn E. Wilson, ed. (January 1977). "Marine Weather Review: Principal Tracks of Centers of Cyclones at Sea Level, North Atlantic August 1976". Mariners Weather Log. Washington, D.C. National Oceanic and Atmospheric Administration, Environmental Data Service. 21 (1): 37.
- 1 2 "Hurricane Belle at Long Island Beach". Pittsburgh Post Gazette. Associated Press. August 10, 1976. p. 1. Retrieved June 4, 2015.
- ↑ "Cleanup Begins in Belle's Wake". Spokane Daily Chronicle. Associated Press. August 11, 1976. p. 28. Retrieved June 5, 2015.
- ↑ "Some area blackouts remain in wake of Belle". The Times Herald Record. August 12, 1976. p. 17. Retrieved August 14, 2017 – via Newspapers.com.
- ↑ Avril Westmoreland (August 10, 1976). "Storm Fells Trees and Limbs, Thousands Left Without Power". The Bridgeport Post. p. 1. Retrieved August 14, 2017 – via Newspapers.com.
- 1 2 "Hurricane Belle loses punch". Lodi News-Sentinel. United Press International. August 11, 1976. p. 1. Retrieved June 5, 2015.
- 1 2 "Belle leaves victims". The Portsmouth Herald. Vernon, Connecticut. Associated Press. August 16, 1976. p. 1. Retrieved August 14, 2017 – via Newspapers.com.
- ↑ "Rain damage". The Portsmouth Herald. Associated Press. August 17, 1976. p. 6. Retrieved August 14, 2017 – via Newspapers.com.
- 1 2 3 4 5 "Tropical Storm Dottie Preliminary Report Page 1". National Hurricane Center. Retrieved 2009-07-05.
- 1 2 "Tropical Storm Dottie Preliminary Report Page 3". National Hurricane Center. Retrieved 2009-07-05.
- 1 2 "Tropical Storm Dottie Preliminary Report Page 2". National Hurricane Center. Retrieved 2009-07-05.
- ↑ Roth, David M. (October 18, 2017). "Tropical Cyclone Point Maxima". Tropical Cyclone Rainfall Data. United States Weather Prediction Center. Retrieved November 26, 2017.
- 1 2 3 4 "Storm Data and Unusual Weather Phenomena" (PDF). Storm Data. Asheville, North Carolina: National Climatic Data Center. 18 (8). August 1976. ISSN 0039-1972. Retrieved July 5, 2017.
- ↑ John M. Purnell (August 20, 1976). "Dottie Pays PB County a Damp Visit". The Palm Beach Post. p. A1. Retrieved June 14, 2017 – via Newspapers.com.
- ↑ "Dottie: Storm Has Her Eye On Carolinas". The Evening Independent. Miami, Florida. Associated Press. August 20, 1976. p. 2. Retrieved July 5, 2017.
- 1 2 3 Miles B. Lawrence (April 1977). "Atlantic Hurricane Season of 1976: Hurricane Candice, 18-24 August" (PDF). Monthly Weather Review. American Meteorological Society. 105 (4): 504. Bibcode:1977MWRv..105..497L. doi:10.1175/1520-0493(1977)105<0497:AHSO>2.0.CO;2. Retrieved August 16, 2017.
- 1 2 3 4 Miles B. Lawrence (April 1977). "Atlantic Hurricane Season of 1976: Hurricane Emmy, 20 August-4 September" (PDF). Monthly Weather Review. American Meteorological Society. 105 (4): 505–506. Bibcode:1977MWRv..105..497L. doi:10.1175/1520-0493(1977)105<0497:AHSO>2.0.CO;2. Retrieved June 17, 2015.
- 1 2 3 Miles B. Lawrence (April 1977). "Atlantic Hurricane Season of 1976: Hurricane Holly, 22-28 October" (PDF). Monthly Weather Review. American Meteorological Society. 105 (4): 506 and 507. Bibcode:1977MWRv..105..497L. doi:10.1175/1520-0493(1977)105<0497:AHSO>2.0.CO;2. Retrieved August 16, 2017.
- ↑ "Annoying Weather Predicted". The Palm Beach Post. June 12, 1976. p. 50. Retrieved October 13, 2018 – via Newspapers.com.
- ↑ David M. Roth (2015). "Tropical Depression Ten - October 8-13, 1976". Weather Prediction Center. National Oceanic and Atmospheric Administration. Retrieved June 17, 2015.
- ↑ "Tropical Cyclone Naming History and Retired Names". National Hurricane Center. Miami, Florida: National Oceanic and Atmospheric Administration. April 17, 2015. Retrieved June 17, 2015.