2008 Atlantic hurricane season
| 2008 Atlantic hurricane season | |
|---|---|
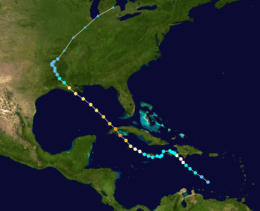
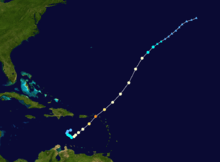
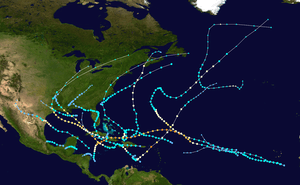 Season summary map | |
| Seasonal boundaries | |
| First system formed | May 31, 2008 |
| Last system dissipated | November 10, 2008 |
| Strongest storm | |
| Name | Ike[nb 1] |
| • Maximum winds |
145 mph (230 km/h) (1-minute sustained) |
| • Lowest pressure | 935 mbar (hPa; 27.61 inHg) |
| Seasonal statistics | |
| Total depressions | 17 |
| Total storms | 16 |
| Hurricanes | 8 |
| Major hurricanes (Cat. 3+) | 5 |
| Total fatalities | 1,047 total |
| Total damage | ~ $49.5 billion (2008 USD) |
| Related articles | |
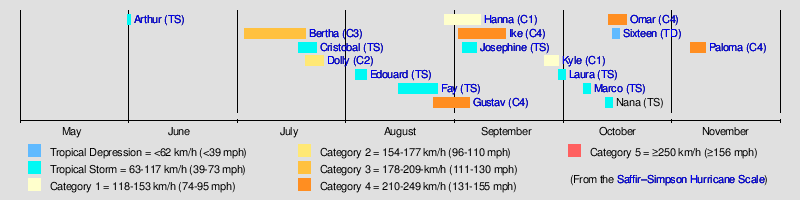
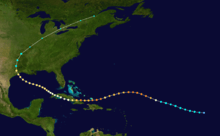
The 2008 Atlantic hurricane season was the most disastrous Atlantic hurricane season since 2005, causing over 1,000 deaths and nearly $50 billion in damages. It was an above-average season, featuring sixteen named storms, eight of which became hurricanes, and five which further became major hurricanes, the highest amount since the record-breaking 2005 season. It officially started on June 1 and ended on November 30. These dates conventionally delimit the period of each year when most tropical cyclones form in the Atlantic basin. However, the formation of Tropical Storm Arthur caused the season to start one day early. This season is the fifth most costly on record, behind only the 2004, 2005, 2012 and 2017 seasons, with over $49.5 billion in damage (2008 USD). It was the only year on record in which a major hurricane existed in every month from July through November in the North Atlantic.[1] Bertha became the longest lived July tropical cyclone on record for the basin, the first of several long-lived systems during 2008.
The season was devastating for Haiti, where over 800 people were killed by four consecutive tropical cyclones (Fay, Gustav, Hanna, and Ike), especially Hurricane Hanna, in August and September. Hurricane Paloma's outer rain bands also made landfall over Haiti. Ike was also the most destructive storm of the season, as well as the strongest in terms of minimum barometric pressure, devastating Cuba as a major hurricane and later making landfall near Galveston, Texas as a large high-end Category 2 hurricane. One very unusual feat was a streak of tropical cyclones affecting land. All but one system impacted land in 2008. The unprecedented number of storms with impact led to one of the deadliest and destructive seasons in the history of the Atlantic basin, especially with Ike, as its overall damages made it the second costliest hurricane in the Atlantic at the time, although it would later drop to sixth after hurricanes Sandy, Harvey, Irma, and Maria.
Seasonal forecasts
| Source | Date | Named storms |
Hurricanes | Major hurricanes |
| CSU | Average (1950–2000)[2] | 9.6 | 5.9 | 2.3 |
| NOAA | Average (1950–2005)[3] | 11.0 | 6.2 | 2.7 |
| Record high activity | 28 | 15 | 8 | |
| Record low activity | 4 | 2 | 0 | |
| –––––––––––––––––––––––––––––––––––––––––– | ||||
| CSU | December 7, 2007 | 13 | 7 | 3 |
| CSU | April 9, 2008 | 15 | 8 | 4 |
| NOAA | May 22, 2008 | 12–16 | 6–9 | 2–5 |
| CSU | June 3, 2008 | 15 | 8 | 4 |
| UKMO | June 18, 2008 | 15* | N/A | N/A |
| CSU | August 5, 2008 | 17 | 9 | 5 |
| NOAA | August 7, 2008 | 14-18 | 7-10 | 3-6 |
| Actual activity | 16 | 8 | 5 | |
| –––––––––––––––––––––––––––––––––––––––––– | ||||
| * July–November only: 15 storms observed in this period. | ||||
Forecasts of hurricane activity are issued before each hurricane season by noted hurricane experts Dr. Philip J. Klotzbach, Dr. William M. Gray, and their associates at Colorado State University; and separately by NOAA forecasters.
Dr. Klotzbach's team (formerly led by Dr. Gray) defined the average number of storms per season (1950 to 2000) as 9.6 tropical storms, 5.9 hurricanes, and 2.3 major hurricanes (storms reaching at least Category 3 strength in the Saffir-Simpson Hurricane Scale). A normal season, as defined by NOAA, has 9 to 12 named storms, with 5 to 7 of those reaching hurricane strength, and 1 to 3 major hurricanes.[2][3]
Pre-season forecasts
The first forecast for the 2008 hurricane season was released by Colorado State University on December 7, 2007. In its report, the organization predicted 13 named storms, 7 hurricanes, 3 major hurricanes, and an annual Accumulated Cyclone Energy index of 115 units. The odds of a major hurricane landfall in the Caribbean and along the United States were projected to be above average.[4] Three days later, Tropical Storm Risk—a public consortium consisting of experts on insurance, risk management, and seasonal climate forecasting at University College London—called for a very active season featuring 15.4 (±4.7) named storms, 8.3 (±3.0) hurricanes, 3.7 (±1.8) major hurricanes, and a cumulative ACE index of 149 (±66) units. Mirroring CSU, the group assigned high probabilities that the United States and Lesser Antilles landfalling ACE index would be above average.[5] On January 3, 2008, Weather Services International (WSI) projected 14 named storms, 7 hurricanes, and 3 major hurricanes.[6]
In April, CSU slightly raised their values owing to a favorable Atlantic sea surface temperature configuration during the preceding month.[7] WSI raised the expected number of hurricanes from 7 to 8 and major hurricanes from 3 to 4 while leaving the number of named storms unchanged.[8] TSR, in contrast, slightly reduced their numbers due to cooler projections for Atlantic ocean temperatures compared to their December forecast.[9] On May 22, the National Oceanic and Atmospheric Administration's Climate Prediction Center announced their first seasonal outlook for the 2008 season, highlighting 65 percent odds of an above-normal season, 25 percent odds for a near-normal season, and but 10 percent odds of a below-average season. A range of 12 to 16 named storms, 6 to 9 hurricanes, and 2 to 5 major hurricanes was provided, each with 60 to 70 percent probability. The CPC, alongside TSR and CSU, highlighted the ongoing multi-decadal period of enhanced Atlantic tropical cyclone activity, the ongoing La Niña in the Pacific, and warmer than average ocean temperatures across the eastern tropical Atlantic as the basis for their predictions.[10]
Midseason outlooks
On June 3, CSU released an updated outlook for the season but left their values from April unchanged. Examining conditions in April and May, the organization compiled a list of hurricane seasons with similar conditions: 1951, 1961, 2000, and 2001.[11] TSR slightly lowered their numbers in their June 5 update but continued to predict an above-average season.[12] Meanwhile, on June 18, the United Kingdom Met Office (UKMO) released their seasonal forecast, assessing a 70 percent probability the number of tropical storms would fall between 10 and 20, with 15 tropical storms noted as the most likely value in 2008. No projections for the number of hurricanes, major hurricanes, or ACE were given.[13] On July 2, WSI held firm to their April forecast;[14] the organization was forced to slightly increase the number of named storms and hurricanes later that month.[15] On July 4, TSR slightly raised their forecast.[16] Following an active start to the season, CSU upped their predictions in a August 5 update, calling for 17 named storms, 9 hurricanes, 5 major hurricanes, and an ACE index of 175 units.[17] TSR released their final outlook for the season that day, raising their values to 18.2 (±2.9) named storms, 9.7 (±1.7) hurricanes, 4.5 (±1.4) major hurricanes, and an ACE index of 191 (±42) units.[18] On August 7, NOAA's CPC raised their probability of an above-average season from 65 percent to 85 percent. The final outlook yielded a 67 percent chance of 14 to 18 named storms, 7 to 10 hurricanes, and 3 to 6 major hurricanes.[19] WSI, meanwhile, issued their final seasonal outlook on August 27, reaffirming their numbers from the previous month.[20]
Seasonal summary
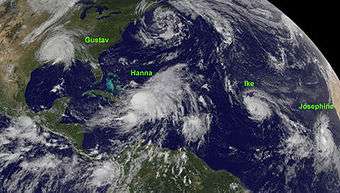
The 2008 hurricane season saw the first occurrence of major hurricanes in the months of July through November. Four storms formed before the start of August, and the season also had the earliest known date for three storms to be active on the same day: Hurricane Bertha, and Tropical Storms Cristobal and Dolly were all active on July 20. This season was also one of only nine Atlantic seasons on record to have a major hurricane form before August. This is also the first year four or more Category 4 storms have formed in a single year since 2005, which had 5, and was one of only 7 Atlantic seasons to feature a major hurricane in November.
The season was devastating for Haiti, where over 800 people were killed by four consecutive tropical cyclones (Fay, Gustav, Hanna, and Ike) in August and September. Hurricane Ike was the most destructive storm of the season, as well as the strongest, devastating Cuba as a major hurricane and later making landfall near Galveston, Texas at Category 2 (nearly Category 3) intensity. It caused a particularly devastating storm surge along the western Gulf Coast of the United States due to in part to its large size. Hanna was the deadliest storm of the season, killing 537 people, mostly in Haiti. Gustav was another very destructive storm, causing up to $8.31 billion in damage to Haiti, Jamaica, the Cayman Islands, Cuba, and the U.S. Dolly caused up to $1.6 billion in damage to south Texas and northeastern Mexico. Bertha was an early season Cape Verde-type hurricane that became the longest lived pre-August North Atlantic tropical cyclone on record, though it caused few deaths and only minor damage.
Other notable storms in the year included Tropical Storm Arthur, which marked the first recorded time the Atlantic saw a named storm form in May in consecutive years, Tropical Storm Fay, which became the first Atlantic tropical cyclone to make landfall in the same U.S. state on 4 separate occasions; Tropical Storm Marco, the smallest Atlantic tropical cyclone on record, Hurricane Omar, a powerful late-season major hurricane which caused moderate damage to the ABC islands, Puerto Rico, and the Virgin Islands in mid-October; and Hurricane Paloma, which became the third-strongest November hurricane in recorded history and caused about $900 million in damage to the Cayman Islands and Cuba. The only storm of the season to not reach tropical storm status, Tropical Depression Sixteen, caused significant flooding in Central America which killed more than 75 people and caused at least $150 million in damages.
Overall, the season's activity was reflected with a total cumulative accumulated cyclone energy (ACE) rating of 146, which was well above the normal average, and was the highest value since 2005.[21] ACE is, broadly speaking, a measure of the power of the hurricane multiplied by the length of time it existed, so storms that last a long time, as well as particularly strong hurricanes, have high ACEs. ACE is only calculated for full advisories on tropical systems at or exceeding 34 knots (39 mph, 63 km/h) or tropical storm strength. Although officially, subtropical cyclones are excluded from the total,[22] the figure above includes periods when storms were in a subtropical phase.
Systems
Tropical Storm Arthur
| Tropical storm (SSHWS) | |
  | |
| Duration | May 31 – June 1 |
|---|---|
| Peak intensity | 45 mph (75 km/h) (1-min) 1004 mbar (hPa) |
By May 27, a tropical wave was crossing the eastern Caribbean Sea and reached the western Caribbean on May 30. That day, the remnants of Tropical Storm Alma entered the region from the north coast of Honduras. Interaction between the wave and the remnants of Alma resulted in the development of a surface low pressure area, which quickly organized into Tropical Storm Arthur about 50 mi (80 km) east of Belize at 00:00 UTC on May 31. The storm intensified slightly further, attaining its peaking at 06:00 UTC with maximum sustained winds of 45 mph (75 km/h) and a minimum barometric pressure of 1,004 mbar (29.6 inHg). Around 09:00 UTC on May 31, Arthur made landfall in northeastern Belize. The cyclone weakened to a tropical depression at 12:00 UTC on June 1 and degenerated into a remnant low by 00:00 UTC on June 2.[23]
Arthur dropped heavy rainfall in Belize, with precipitation estimates as high as 15 in (380 mm).[23] Combined with recent heavy rains from Tropical Storm Alma, Arthur triggered flash flooding and caused rivers throughout the country to overflow. High water left dozens of people stranded on their rooftops and forced the evacuation of one village. The flooding also damaged a bridge and a highway, while several other bridges were inundated.[24] A total of 714 homes were flooded by Arthur.[23] Overall, damage in Belize totaled approximately $78 million and there were nine fatalities,[23][25] five of them were direct.[23]
Hurricane Bertha
| Category 3 hurricane (SSHWS) | |
  | |
| Duration | July 3 – July 20 |
|---|---|
| Peak intensity | 125 mph (205 km/h) (1-min) 952 mbar (hPa) |
A well-defined tropical wave left Africa on July 1 and organized into a tropical depression by 06:00 UTC on July 3. Six hours later, it intensified into Tropical Storm Bertha, the easternmost tropical storm on record in the Atlantic during July. Steered on a west-northwest or northwest course, Bertha reached hurricane strength around 06:00 UTC on July 7 before undergoing a period of rapid intensification that brought it to its peak as a Category 3 hurricane with winds of 125 mph (205 km/h) later that day. Structural changes and a more hostile environment caused the storm to fluctuate in intensity as it passed east of Bermuda. By July 19, however, the storm began to undergo extratropical transition, a process it completed by 12:00 UTC the next morning. The post-tropical storm continued northeast and merged with a larger extratropical low near Iceland on July 21. Lasting a duration of 17 days, Bertha became the longest-lived Atlantic tropical cyclone on record during the month of July.[26]
Tropical Storm Cristobal
| Tropical storm (SSHWS) | |
  | |
| Duration | July 19 – July 23 |
|---|---|
| Peak intensity | 65 mph (100 km/h) (1-min) 998 mbar (hPa) |
A trough of low pressure, the remnants of an old frontal boundary, extended along the East Coast of the United States on July 15. The trough extended into the Gulf of Mexico the following day and resulted in the development of a circulation that subsequently crossed Florida on July 17. Once in the Atlantic, the system became better organized and coalesced into a tropical depression around 00:00 UTC on July 19. It intensified into Tropical Storm Cristobal twelve hours later. After passing close to the Outer Banks of North Carolina, the storm continued northeast and reached peak winds of 65 mph (100 km/h) early on July 21, when an eye feature was evident on microwave imagery. Progressively cooler waters began to weaken Cristobal the next day, and it was then absorbed by a large extratropical cyclone south of Newfoundland around 12:00 UTC on July 23.[27]
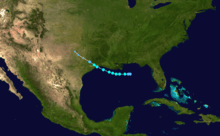
Hurricane Dolly
| Category 2 hurricane (SSHWS) | |
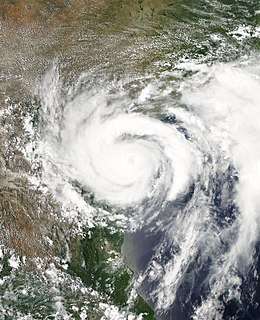  | |
| Duration | July 20 – July 25 |
|---|---|
| Peak intensity | 100 mph (155 km/h) (1-min) 963 mbar (hPa) |
A tropical wave emerged off Africa on July 11. As the wave moved west into the Caribbean, it produced gale-force winds and its satellite presentation resembled that of a tropical storm at times. However, the system did not develop a well-defined circulation until around 12:00 UTC on July 20, at which time it was designated as Tropical Storm Dolly. On a northwest course, the cyclone failed to organize initially; however, a more conducive environment in the Gulf of Mexico allowed Dolly to attain hurricane strength by 00:00 UTC on July 23 and reach its peak as a Category 2 hurricane with winds of 100 mph (155 km/h) twelve hours later. Dry air and cooler waters eroded the storm's eyewall after peak, but Dolly still harbored winds of 85 mph (140 km/h) at its landfall on South Padre Island, Texas, at 18:20 UTC. It made a second landfall on the Texas mainland at a slightly reduced strength two hours later. Once inland, Dolly weakened to a tropical storm early on July 24 and ultimately degenerated to a remnant low around 00:00 UTC on July 26. The remnant low turned north and crossed the Mexico–United States border before losing its identity over New Mexico early on July 27.[28]
Tropical Storm Edouard
| Tropical storm (SSHWS) | |
  | |
| Duration | August 3 – August 6 |
|---|---|
| Peak intensity | 65 mph (100 km/h) (1-min) 996 mbar (hPa) |
A trough developed northern Gulf of Mexico on August 2 and quickly developed into a tropical depression about 85 mi (140 km) southeast of the mouth of the Mississippi River on August 3. The depression moved westward and intensified into Tropical Storm Edouard on August 4. However, northerly wind shear initially halted any further significant intensification and also caused the storm to struggle to maintain deep convection over the center. Edouard eventually intensified further and peaked with winds of 65 mph (100 km/h) on August 5. Shortly thereafter, the storm made landfall near Gilchrist, Texas. Edouard quickly weakened and was downgraded to tropical depression by early on August 6, six hours before degenerated into a remnant low pressure area. The remnant low continued to move northwestward across Texas and dissipated later that day.[29]
Due to the relatively weak nature of the storm, damage was generally minor.[29] Rip currents in Alabama and Florida caused five fatalities,[30] while a sixth death occurred after a man fell overboard a shrimp boat in rough seas near the mouth of the Mississippi River in Louisiana. Storm surge and high tides also caused coastal flooding in the state, especially in Cameron Parish.[29] Relatively strong winds left more than 2,000 without electricity and damaged trees and the roofs of mobile homes.[30] Storm surge caused coastal flooding in eastern Texas, particularly in the Gilchrist area. At least 25 homes sustained damage, while portions of a few major roads, such as Interstate 10, were closed.[29] Minor inland flooding occurred due to heavy rainfall, with a portion of State Highway 36 being temporarily shutdown. Strong winds in the region damaged hundreds of homes, downed trees, and left about 300,000 people without electricity. Overall, damage from Edouard totaled slightly more than $550,000.[30]
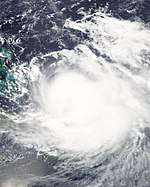
Tropical Storm Fay
| Tropical storm (SSHWS) | |
 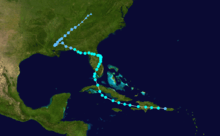 | |
| Duration | August 15 – August 27 |
|---|---|
| Peak intensity | 70 mph (110 km/h) (1-min) 986 mbar (hPa) |
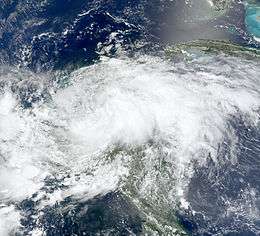
A tropical wave developed into a tropical depression just west of Puerto Rico on August 15. It soon intensified into Tropical Storm Fay, before striking Dominican Republic later that day. Fay re-emerged into the Caribbean early on August 16 after crossing Hispaniola. The cyclone clipped Cuba's Zapata Peninsula on August 17, before striking near Cienfuegos on August 18. Fay strengthened further after reaching the Straits of Florida on the following day. The system then struck Florida a record four times while zigzagging from water to land, beginning with a landfall near Key West on August 18. Fay peaked with winds of 70 mph (110 km/h) near Lake Okeechobee on the next day. After Fay's final Florida landfall near Carrabelle on August 23, the storm continued inland and weakened to a tropical depression early on August 24. Fay curved northeastward over Mississippi on August 25, before becoming extratropical over Tennessee on August 27. The remnants dissipated over Kentucky by the following day.[31]
In Dominican Republic, by wind and flood waters damaged or destroyed more than 2,400 homes. At least five people were killed, all of them from vehicles were swept off roads.[31] Fay's winds and rainfall in Haiti damaged the nation's agricultural sector, especially rice and banana crops.[32] Extensive flooding was reported on Gonâve Island.[31] The storm left at least 10 fatalities in Haiti.[31][33] One death occurred in Jamaica after floodwaters overturned a car.[33] With several weather stations across Cuba observing over 10 in (250 mm) of rain,[31] flooding with reported across the island. The storm damaged crops, flooded hundreds of homes, isolated several communities, and disrupted electricity and telephone communications.[34] Heavy rainfall was reported across Florida, with a peak total of 27.65 in (702 mm) near Melbourne.
Significant flooding resulted in much of eastern Florida, along with some wind damage. Fay was responsible for 36 deaths and at least $560 million in damage.
Hurricane Gustav
| Category 4 hurricane (SSHWS) | |
  | |
| Duration | August 25 – September 4 |
|---|---|
| Peak intensity | 155 mph (250 km/h) (1-min) 941 mbar (hPa) |
A tropical wave departed Africa on August 13, coalescing into a tropical depression south of Puerto Rico by 00:00 UTC on August 25 and intensifying into Tropical Storm Gustav twelve hours later. With a small inner core, the system rapidly strengthened to a hurricane by 06:00 UTC on August 26 before striking the southwestern peninsula of Haiti later that day. Gustav weakened while traversing Haiti and Jamaica, but quickly restrengthened over the northwestern Caribbean, reaching winds of 145 mph (230 km/h) before making landfall on the Isle of Youth, and striking the mainland just east of Los Palacios, Cuba, with winds of 155 mph (250 km/h) later on August 30. Plagued by wind shear and dry air, the hurricane did not re-intensify over the Gulf of Mexico, instead making a final landfall near Cocodrie, Louisiana, around 15:00 UTC on September 1, with winds of 105 mph (165 km/h). Gustav continued northwest, weakening to a tropical depression over northern Louisiana before merging with a cold front over northern Arkansas around 12:00 UTC on September 4. The extratropical remnants accelerated northeast and merged with another extratropical low over the Great Lakes later on September 5.[35]
Hurricane Hanna
| Category 1 hurricane (SSHWS) | |
  | |
| Duration | August 28 – September 7 |
|---|---|
| Peak intensity | 85 mph (140 km/h) (1-min) 977 mbar (hPa) |
A tropical wave entered the Atlantic on August 19, leading to the formation of a tropical depression around 00:00 UTC on August 28. Twelve hours later, the depression intensified into Tropical Storm Hanna. Interaction between the cyclone and an upper-level low kept Hanna fairly steady-state for several days, with its appearance briefly resembling that of a subtropical storm. Meanwhile, a building ridge over the eastern United States forced the storm to dive south. A reprieve in upper-level winds allowed Hanna to attain hurricane strength at 18:00 UTC on September 1 and reach peak winds of 85 mph (140 km/h) six hours later. However, the aforementioned ridge soon began to impart northerly wind shear, and the cyclone weakened accordingly. A second upper-level low caused Hanna to conduct a counter-clockwise loop north of Haiti before reaching the western periphery of the subtropical ridge, sending the storm ashore near the North Carolina–South Carolina border at 07:20 UTC on September 6, with winds of 70 mph (110 km/h). It curved northeast once inland, merging with one cold front over southern New England and a second near Newfoundland.[36]
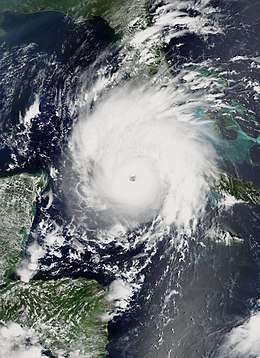
Hurricane Ike
| Category 4 hurricane (SSHWS) | |
  | |
| Duration | September 1 – September 14 |
|---|---|
| Peak intensity | 145 mph (230 km/h) (1-min) 935 mbar (hPa) |
At 06:00 UTC on September 1, the season's ninth tropical depression developed from a well-defined tropical wave that left Africa on August 28. A strong subtropical ridge to the depression's north directed it on a west-northwest path for several days, while environmental conditions allowed for quick intensification. It intensified into Tropical Storm Ike six hours after formation, and on September 3, began a 24-hour period of rapid intensification that saw its winds increase from 85 mph (140 km/h) to a peak of 145 mph (230 km/h). The ridge to Ike's north soon amplified, forcing the hurricane on an unusual, prolonged southwest track while also imparting increased wind shear. After briefly weakening below major hurricane strength, a relaxation in the upper-level winds allowed Ike to reattain Category 4 strength while entering the Turks and Caicos Islands; it then made several landfalls at a slightly reduced intensity. Winds again increased to 130 mph (215 km/h) as Ike moved ashore near Cabo Lucrecia, Cuba. Land interaction prompted structural changes to the storm's core, and Ike only slowly rebounded to an intensity of 110 mph (175 km/h) before its landfall on the northern end of Galveston Island, Texas, early on September 13. Ike curved northeast once inland, interacting with a front the next morning and merging with another low near the Saint Lawrence River on the afternoon of September 15.[37]
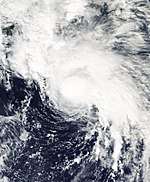
Tropical Storm Josephine
| Tropical storm (SSHWS) | |
  | |
| Duration | September 2 – September 6 |
|---|---|
| Peak intensity | 65 mph (100 km/h) (1-min) 994 mbar (hPa) |
A strong tropical wave accompanied by a surface low departed Africa late on August 31. The system began to organize almost immediately after entering the Atlantic, organizing into a tropical depression around 00:00 UTC on September 2 and intensifying into Tropical Storm Josephine six hours later. On a west to west-northwest heading, the cyclone steadily organized and attained peak winds of 65 mph (100 km/h) early on September 3. An exceptionally strong upper-level trough—aided by outflow from nearby Hurricane Ike—prompted a weakening trend thereafter. Despite intermittent bursts of convection, Josephine weakened to a tropical depression around 00:00 UTC on September 6 and degenerated to a remnant low six hours later. The low ultimately dissipated on September 10.[38]
As Josephine passed to the south of the Cape Verde islands on September 2, outer rain bands produced minor rainfall, totaling around 0.55 inches (14 mm).[39] There were no reports of damage or flooding from the rain and overall effects were minor.[40] Several days after the low dissipated, the remnant moisture from Josephine brought showers and thunderstorms to St. Croix where up to 1 in (25.4 mm) of rain fell. The heavy rains led to minor street flooding and some urban flooding. No known damage was caused by the flood.[41]
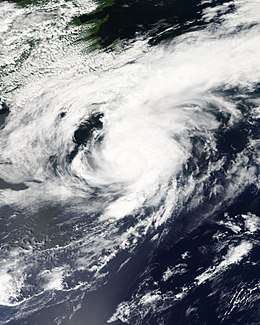
Hurricane Kyle
| Category 1 hurricane (SSHWS) | |
  | |
| Duration | September 25 – September 29 |
|---|---|
| Peak intensity | 85 mph (140 km/h) (1-min) 984 mbar (hPa) |
A tropical wave moved off the western coast of Africa on September 12. The westward-moving feature crossed the Windward Islands on September 19 and began to interact with a strong upper-level trough, leading to an increase in convection and a more evident circulation center. Steering currents directed the disturbance into the southwest Atlantic, where a decrease in wind shear led to the formation of a tropical depression by 00:00 UTC on September 25 and organization into Tropical Storm Kyle six hours later. Gradual intensification occurred as the cyclone passed well west of Bermuda; it attained hurricane strength around 12:00 UTC on September 27 and reached peak winds of 85 mph (140 km/h) a day later. After making landfall just north of Yarmouth, Nova Scotia, at 00:00 UTC on September 29, Kyle accelerated northeastward. The storm developed a frontal structure as convection became elongated and asymmetric, leading to its extratropical transition by 06:00 UTC on September 29. It was absorbed by a larger extratropical low a little over a day later.[42]
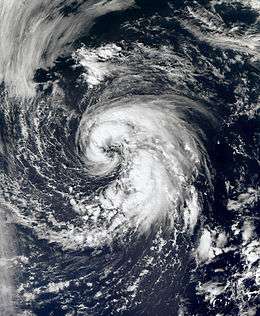
Tropical Storm Laura
| Tropical storm (SSHWS) | |
  | |
| Duration | September 29 – October 1 |
|---|---|
| Peak intensity | 60 mph (95 km/h) (1-min) 994 mbar (hPa) |
On September 26, a non-tropical low formed along a quasi-stationary front well west of the Azores. Over the coming days, frontal boundaries associated with the low gradually dissipated as it moved west. A distinct band of deep convection formed early on September 26, but activity was relegated well south of the center; in addition, the disturbance was collocated within a cold-core low. Both of these factors led to the designation of Subtropical Storm Laura by 06:00 UTC that day, at which time it possessed maximum winds of 60 mph (95 km/h). A ridge north of the Azores and an extratropical cyclone over the Canadian Maritimes directed the storm north into the far northern Atlantic. The cold-core low that had been aligned with Laura became displaced from the center of the cyclone on September 30, allowing the formation of central convection and transition to a fully tropical storm around 12:00 UTC on September 30. However, Laura tracked into progressively cooler waters and ultimately degenerated to a remnant low a day later. Laura's remnants merged with a front before becoming absorbed within a larger extratropical cyclone west of the British Isles on October 4.[43]
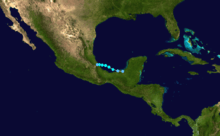
Tropical Storm Marco
| Tropical storm (SSHWS) | |
  | |
| Duration | October 6 – October 7 |
|---|---|
| Peak intensity | 65 mph (100 km/h) (1-min) 998 mbar (hPa) |
A broad area of low pressure persisted across the northwestern Caribbean Sea through the end of September. A westward-moving tropical wave reached the southwestern Caribbean on October 4, aiding in the formation of a circulation center near Belize. The low tracked across Yucatán Peninsula and, following an increase in convection while over the Laguna de Términos, organized into a tropical depression around 00:00 UTC on October 6. The newly-formed cyclone entered the Bay of Campeche a few hours later, quickly intensifying into a tropical storm—the smallest on record in the Atlantic Ocean. Favorable anticyclonic flow aloft aided in continued development of the tightly coiled storm, and Marco attained peak winds of 65 mph (100 km/h) early on October 7, an intensity it maintained through landfall east of Misantla around 12:00 UTC that day. Its tiny circulation quickly weakened once inland, dissipating by 00:00 UTC on October 8.[44]
Tropical Storm Nana
| Tropical storm (SSHWS) | |
  | |
| Duration | October 12 – October 14 |
|---|---|
| Peak intensity | 40 mph (65 km/h) (1-min) 1004 mbar (hPa) |
A tropical wave exited the west coast of Africa on October 6, accompanied by a broad area of low pressure. The system organized as bands of convection coalesced around the center, leading to the formation of a tropical depression around 06:00 UTC on October 12. On a west-northwest course toward a weakness in the subtropical ridge to its north, the depression quickly strengthened into Tropical Storm Nana and attained peak winds of 40 mph (65 km/h). The effects of strong wind shear mitigated further organization, weakening the storm back to tropical depression intensity by 12:00 UTC on October 13 and causing it to degenerate to a remnant low a day later. The low turned northwest and dissipated on October 15.[45]
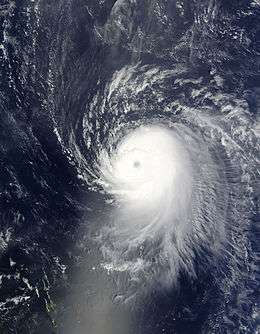
Hurricane Omar
| Category 4 hurricane (SSHWS) | |
  | |
| Duration | October 13 – October 18 |
|---|---|
| Peak intensity | 130 mph (215 km/h) (1-min) 958 mbar (hPa) |
A tropical wave moved off Africa on September 30 and failed to organize appreciably until reaching the eastern Caribbean Sea on October 9. There, an increase in convection led to the formation of a tropical depression around 06:00 UTC on October 13; it intensified into Tropical Storm Omar eighteen hours later. A broad, deep upper-level trough to the cyclone's northwest caused it to conduct a counter-clockwise turn and accelerate northeast while also aiding in the onset of an extended period of rapid intensification. Omar attained hurricane strength around 00:00 UTC on October 15 before ultimately reaching peak winds of 130 mph (215 km/h), Category 4 strength, a little over a day later. Uncharacteristically, the cyclone was plagued by moderate wind shear during its rapid intensification phase, and a further increase in upper-level winds abruptly weakened Omar by 50 mph (85 km/h) within a 24-hour period. The storm continued northeast into the central Atlantic, weakening to a tropical storm around 00:00 UTC on October 18 and degenerating to a remnant low twelve hours later. The low persisted for two days before dissipating.[46]
Tropical Depression Sixteen
| Tropical depression (SSHWS) | |
  | |
| Duration | October 14 – October 15 |
|---|---|
| Peak intensity | 30 mph (45 km/h) (1-min) 1004 mbar (hPa) |
A tropical wave left Africa on September 27 and moved into the southwestern Caribbean Sea on October 10, where a broad area of low pressure formed. The low paralleled the coastline of Nicaragua for a few days while associated convection became better organized; this ultimately led to the development of a tropical depression around 12:00 UTC on October 14. The storm maintained a poorly-organized structure throughout its duration, with the low-level center embedded within a larger gyre and little central thunderstorm activity. A reconnaissance aircraft measured peak winds of 30 mph (45 km/h), and the depression maintained these winds as it made landfall just west of Punta Patuca, Honduras, at 12:30 UTC on October 15. It moved west-southwest and ultimately degenerated over mountainous terrain around 06:00 UTC the next day.[47]
Hurricane Paloma
| Category 4 hurricane (SSHWS) | |
  | |
| Duration | November 5 – November 9 |
|---|---|
| Peak intensity | 145 mph (230 km/h) (1-min) 944 mbar (hPa) |
A broad area of disturbed weather developed in the southwestern Caribbean Sea on November 1, ultimately coalescing into a tropical depression around 18:00 UTC on November 5. It moved north amid a favorable environment, becoming Tropical Storm Paloma twelve hours after formation and attaining hurricane intensity by 00:00 UTC on November 7. An impinging upper-level trough directed Paloma toward the northeast while enhancing outflow, prompting a period of rapid intensification that brought the storm to its peak as a Category 4 hurricane with winds of 145 mph (230 km/h) around 12:00 UTC on November 8, the third strongest November hurricane on record in the Atlantic. An increase in wind shear soon began to take a toll on the cyclone, weakening Paloma to Category 2 strength as it made landfall near Santa Cruz del Sur, Cuba, and further to a tropical storm around 06:00 UTC on November 9. It ultimately degenerating to a remnant low early the next day. The low meandered around Cuba before entering the Gulf of Mexico, and it dissipated south of the Florida Panhandle on November 14.[48]
Storm names
The following list of names was used for named storms that formed in the North Atlantic in 2008. The names not retired from this list were used again in the 2014 season. This was the same list used in the 2002 season, with the exceptions of Ike and Laura, which replaced Isidore and Lili, respectively. The names Ike, Omar, and Paloma were used for the first (and only, in the cases of Ike and Paloma) time this year. The name Laura was previously used in 1971.
Retirement
On April 22, 2009, at the 31st Session of the RA IV Hurricane Committee, the World Meteorological Organization retired the names Gustav, Ike, and Paloma from its rotating name lists due to the amount of deaths and damage they caused, and they will not be used again for another Atlantic hurricane. They were replaced with Gonzalo, Isaias, and Paulette for the 2014 season.[49]
Season effects
This is a table of all of the storms that formed in the 2008 Atlantic hurricane season. It includes their duration, names, landfall(s) – denoted by bold location names – damages, and death totals. Deaths in parentheses are additional and indirect (an example of an indirect death would be a traffic accident), but were still related to that storm. Damage and deaths include totals while the storm was extratropical, a wave, or a low, and all of the damage figures are in 2008 USD.
| Saffir–Simpson scale | ||||||
| TD | TS | C1 | C2 | C3 | C4 | C5 |
| Storm name |
Dates active | Storm category
at peak intensity |
Max 1-min wind mph (km/h) |
Min. press. (mbar) |
Areas affected | Damage (USD) |
Deaths | Refs | ||
|---|---|---|---|---|---|---|---|---|---|---|
| Arthur | May 31 – June 2 | Tropical storm | 45 (75) | 1004 | Belize, Yucatan Peninsula, Southwestern Mexico | $78 million | 5 (4) | |||
| Bertha | July 3 – July 20 | Category 3 hurricane | 125 (205) | 952 | Cape Verde, Bermuda, United States East Coast | Minimal | 3 | |||
| Cristobal | July 19 – July 23 | Tropical storm | 65 (100) | 998 | Florida, The Carolinas, Atlantic Canada | $10 thousand | None | |||
| Dolly | July 20 – July 25 | Category 2 hurricane | 100 (155) | 963 | Guatemala, Yucatan Peninsula (Quintana Roo), Northeastern Mexico, South Texas, New Mexico, Arizona | $1.6 billion | 1 (21) | |||
| Edouard | August 3 – August 6 | Tropical storm | 65 (100) | 996 | United States Gulf Coast (Southeast Texas) | $5.5 million | 6 | |||
| Fay | August 15 – August 27 | Tropical storm | 70 (110) | 986 | Leeward Islands, Puerto Rico, Dominican Republic, Haiti, Jamaica, Cuba, Southeastern United States (Florida) | $560 million | 13 (23) | |||
| Gustav | August 25 – September 4 | Category 4 hurricane | 155 (250) | 941 | Lesser Antilles, Dominican Republic, Haiti, Jamaica, Cayman Islands, Western Cuba, United States Gulf Coast (Louisiana), Midwestern United States | $8.31 billion | 112 (41) | |||
| Hanna | August 28 – September 7 | Category 1 hurricane | 85 (140) | 977 | Puerto Rico, Turks and Caicos Islands, Bahamas, Haiti, Dominican Republic, United States East Coast (South Carolina), Atlantic Canada | $160 million | ≥532 (5) | |||
| Ike | September 1 – September 14 | Category 4 hurricane | 145 (230) | 935 | Dominican Republic, Turks and Caicos Islands, Haiti, The Bahamas, Cuba, United States Gulf Coast (Southeast Texas), Midwestern United States, Eastern Canada, Iceland | $38 billion | 103 (92) | |||
| Josephine | September 2 – September 6 | Tropical storm | 65 (100) | 994 | Cape Verde, Leeward Islands | Minimal | None | |||
| Kyle | September 25 – September 29 | Category 1 hurricane | 85 (140) | 984 | Puerto Rico, Dominican Republic, Haiti, Bermuda, New England, The Maritimes (Nova Scotia) | $57.1 million | 8 | |||
| Laura | September 29 – October 1 | Tropical storm | 60 (95) | 994 | British Isles, Netherlands, Norway | Minimal | None | |||
| Marco | October 6 – October 7 | Tropical storm | 65 (100) | 998 | Eastern Mexico (Veracruz) | Minimal | None | |||
| Nana | October 12 – October 14 | Tropical storm | 40 (65) | 1004 | None | None | None | |||
| Omar | October 13 – October 18 | Category 4 hurricane | 130 (215) | 958 | Leeward Antilles, Venezuela, Leeward Islands, Puerto Rico | $80 million | 0 (1) | |||
| Sixteen | October 14 – October 15 | Tropical depression | 30 (45) | 1004 | Honduras, Belize | ≥ $150 million | ≥ 75 | |||
| Paloma | November 5 – November 10 | Category 4 hurricane | 145 (230) | 944 | Nicaragua, Honduras, Cayman Islands, Jamaica, Cuba, The Bahamas, Florida | $454.5 million | 0 (1) | |||
| Season Aggregates | ||||||||||
| 17 systems | May 30 – November 9 | 155 (250) | 935 | ≥ $49.46 billion | ≥ 858 (188) | |||||
See also
- List of Atlantic hurricanes
- List of Atlantic hurricane seasons
- 2008 Pacific hurricane season
- 2008 Pacific typhoon season
- 2008 North Indian Ocean cyclone season
- South-West Indian Ocean cyclone seasons: 2007–08, 2008–09
- Australian region cyclone seasons: 2007–08, 2008–09
- South Pacific cyclone seasons: 2007–08, 2008–09
Footnotes
- ↑ The "strength" of a tropical cyclone is measured by the minimum barometric pressure, not wind speed. Most meteorological organizations rate the intensity of a storm by this figure, so the lower the minimum pressure of the storm, the more intense or "stronger" it is considered to be. The strongest winds were actually from Gustav, at 155 mph (250 km/h).
References
- ↑ Azadeh Ansari and Reynolds Wolf (2008-12-01). "An unusually destructive hurricane season ends". CNN. Archived from the original on 1 December 2008. Retrieved 2008-12-01.
- 1 2 Philip J. Klotzbach and William M. Gray (2007-12-07). "Extended Range Forecast of Atlantic Seasonal Hurricane Activity and U.S. Landfall Strike Probability for 2008" (PDF). Colorado State University. Retrieved 2007-12-07.
- 1 2 Climate Prediction Center (2006-08-08). "BACKGROUND INFORMATION: THE NORTH ATLANTIC HURRICANE SEASON". National Oceanic and Atmospheric Administration. Archived from the original on 2010-11-15. Retrieved 2006-12-08.
- ↑ William M. Gray; Phillip J. Klotzbach (December 7, 2007). Extended Range Forecast of Atlantic Seasonal Hurricane Activity and U.S. Landfall Strike Probability for 2008 (PDF) (Report). Fort Collins, Colorado: Colorado State University. Retrieved February 12, 2018.
- ↑ Mark Saunders; Dr. Adam Lea (December 10, 2007). Extended Range Forecast for Atlantic Hurricane Activity in 2008 (PDF) (Report). London, England: Tropical Storm Risk. Retrieved February 12, 2018.
- ↑ "Seven Atlantic Hurricanes This Year, WSI Says". Natural Gas Intelligence. January 3, 2008. Retrieved February 12, 2018.
- ↑ William M. Gray; Phillip J. Klotzbach (April 9, 2008). Extended Range Forecast of Atlantic Seasonal Hurricane Activity and U.S. Landfall Strike Probability for 2008 (PDF) (Report). Fort Collins, Colorado: Colorado State University. Retrieved February 12, 2018.
- ↑ "WSI Adds Another Intense Hurricane to Tropical Forecast". Natural Gas Intelligence. April 23, 2008. Retrieved February 12, 2018.
- ↑ Mark Saunders; Dr. Adam Lea (April 7, 2008). April Forecast Update for Atlantic Hurricane Activity in 2008 (PDF) (Report). London, England: Tropical Storm Risk. Retrieved February 12, 2018.
- ↑ Carmeyia Gillis; David Miller (May 22, 2008). NOAA Predicts Near Normal or Above Normal Atlantic Hurricane Season (Report). National Oceanic and Atmospheric Administration. Retrieved February 12, 2018.
- ↑ William M. Gray; Phillip J. Klotzbach (June 3, 2008). Extended Range Forecast of Atlantic Seasonal Hurricane Activity and U.S. Landfall Strike Probability for 2008 (PDF) (Report). Fort Collins, Colorado: Colorado State University. Retrieved February 12, 2018.
- ↑ Mark Saunders; Dr. Adam Lea (June 5, 2008). June Forecast Update for Atlantic Hurricane Activity in 2008 (PDF) (Report). London, England: Tropical Storm Risk. Retrieved February 12, 2018.
- ↑ "North Atlantic tropical storm seasonal forecast 2008". Met Office. June 18, 2008. Retrieved February 12, 2018.
- ↑ "WSI Still Sees 'Active' Hurricane Season Ahead". Natural Gas Intelligence. July 2, 2008. Retrieved February 12, 2018.
- ↑ "WSI Ups Forecast: Nine Hurricanes This Year". Natural Gas Intelligence. July 23, 2008. Retrieved February 12, 2018.
- ↑ Mark Saunders; Dr. Adam Lea (July 4, 2008). July Forecast Update for Atlantic Hurricane Activity in 2008 (PDF) (Report). London, England: Tropical Storm Risk. Retrieved February 12, 2018.
- ↑ William M. Gray; Phillip J. Klotzbach (August 5, 2008). Forecast of Atlantic Seasonal Hurricane Activity, August Monthly Activity and U.S. Landfall Strike Probability for 2008 (PDF) (Report). Fort Collins, Colorado: Colorado State University. Retrieved February 12, 2018.
- ↑ Mark Saunders; Dr. Adam Lea (August 5, 2008). August Forecast Update for Atlantic Hurricane Activity in 2008 (PDF) (Report). London, England: Tropical Storm Risk. Retrieved February 12, 2018.
- ↑ Carmeyia Gillis (August 7, 2008). "Strong Start Increases NOAA's Confidence for Above-Normal Atlantic Hurricane Season". National Oceanic and Atmospheric Administration. Retrieved February 12, 2018.
- ↑ "WSI Stands by 'Active' Hurricane Season Forecast". Natural Gas Intelligence. August 27, 2008. Retrieved February 12, 2018.
- ↑ Hurricane Research Division (March 2011). "Atlantic basin Comparison of Original and Revised HURDAT". National Oceanic and Atmospheric Administration. Archived from the original on 2011-11-29. Retrieved 2011-07-23.
- ↑ David Levinson (2008-08-20). "2005 Atlantic Ocean Tropical Cyclones". National Climatic Data Center. Retrieved 2011-07-23.
- 1 2 3 4 5 Eric S. Blake (July 28, 2008). Tropical Cyclone Report: Tropical Storm Arthur (PDF) (Report). National Hurricane Center. Retrieved August 19, 2017.
- ↑ Belize: Tropical Storm Arthur Information Bulletin No. 1. International Federation of Red Cross And Red Crescent Societies (Report). ReliefWeb. June 3, 2008. Retrieved August 19, 2017.
- ↑ "Alma and Arthur Bring Heavy Rains to Central America". National Aeronautics and Space Administration. June 5, 2008. Retrieved August 19, 2017.
- ↑ Jamie R. Rhome (October 15, 2008). Tropical Cyclone Report: Hurricane Bertha (PDF) (Report). Miami, Florida: National Hurricane Center. Retrieved February 11, 2018.
- ↑ Lixion A. Avila (December 15, 2008). Tropical Cyclone Report: Tropical Storm Cristobal (PDF) (Report). Miami, Florida: National Hurricane Center. Retrieved February 12, 2018.
- ↑ Richard J. Pasch; Todd B. Kimberlain (January 22, 2009). Tropical Cyclone Report: Hurricane Dolly (PDF) (Report). Miami, Florida: National Hurricane Center. Retrieved February 11, 2018.
- 1 2 3 4 James L. Franklin (November 14, 2008). Tropical Cyclone Report: Tropical Storm Edouard (PDF) (Report). National Hurricane Center. Retrieved August 20, 2017.
- 1 2 3 "Storm Data and Unusual Weather Phenomena" (PDF). Storm Data. Asheville, North Carolina: National Climatic Data Center. 50 (8): 19, 79, 88, 180, 413, and 417. August 2008. ISSN 0039-1972. Archived (PDF) from the original on 2017-08-20. Retrieved August 20, 2017.
- 1 2 3 4 5 Stacy R. Stewart and John L. Beven II (February 8, 2009). Tropical Cyclone Report: Tropical Storm Fay (PDF) (Report). National Hurricane Center. Retrieved August 20, 2017.
- ↑ Evens Sanon (August 16, 2008). "Tropical Storm Leaves 4 Dead in Haiti, DR". ABC News. Associated Press. Archived from the original on August 17, 2008. Retrieved August 20, 2017.
- 1 2 "Killer storm powers into hurricane mode for Florida landfall". Herald Sun. Agence France-Presse. August 19, 2008. Archived from the original on August 30, 2008. Retrieved August 20, 2017.
- ↑ Informe de Situación No 2 "Tormenta Tropical Fay" (PDF). Oficina de la Coordinadora Residente de Cuba (Report) (in Spanish). ReliefWeb. August 20, 2008. pp. 3 and 4. Retrieved August 20, 2017.
- ↑ John L. Beven II; Todd B. Kimberlain (January 22, 2009). Tropical Cyclone Report: Hurricane Gustav (PDF) (Report). Miami, Florida: National Hurricane Center. Retrieved February 11, 2018.
- ↑ Daniel P. Brown; Todd B. Kimberlain (December 17, 2008). Tropical Cyclone Report: Hurricane Hanna (PDF) (Report). Miami, Florida: National Hurricane Center. Retrieved February 11, 2018.
- ↑ Robbie J. Berg (January 23, 2009). Tropical Cyclone Report: Hurricane Ike (PDF) (Report). Miami, Florida: National Hurricane Center. Retrieved February 11, 2018.
- ↑ Eric S. Blake (December 5, 2008). Tropical Cyclone Report: Tropical Storm Josephine (PDF) (Report). Miami, Florida: National Hurricane Center. Retrieved February 10, 2018.
- ↑ Computer Generated (2008-09-02). "Weather History for Praia, Cape Verde, September 2". Wunderground. Retrieved 2008-09-14.
- ↑ Knabb (2008-09-02). "Tropical Depression Ten Public Advisory One". National Hurricane Center. Archived from the original on 8 September 2008. Retrieved 2008-09-04.
- ↑ Stuart Hinson (2008). "NCDC Event Report: Heavy Rain". National Climatic Data Center. Retrieved 2008-12-18.
- ↑ Lixion A. Avila (December 5, 2008). Tropical Cyclone Report: Hurricane Kyle (PDF) (Report). Miami, Florida: National Hurricane Center. Retrieved February 9, 2018.
- ↑ Richard J. Pasch (February 4, 2009). Tropical Cyclone Report: Tropical Storm Laura (PDF) (Report). Miami, Florida: National Hurricane Center. Retrieved February 7, 2018.
- ↑ James L. Franklin (November 14, 2008). Tropical Cyclone Report: Tropical Storm Marco (PDF) (Report). Miami, Florida: National Hurricane Center. Retrieved February 7, 2018.
- ↑ Stacy R. Stewart (November 28, 2008). Tropical Cyclone Report: Tropical Storm Nana (PDF) (Report). Miami, Florida: National Hurricane Center. Retrieved February 10, 2018.
- ↑ Jack L. Beven II; Christopher W. Landsea (February 3, 2009). Tropical Cyclone Report: Hurricane Omar (PDF) (Report). Miami, Florida: National Hurricane Center. Retrieved February 10, 2018.
- ↑ Daniel P. Brown (November 19, 2008). Tropical Cyclone Report: Tropical Depression Sixteen (PDF) (Report). Miami, Florida: National Hurricane Center. Retrieved February 10, 2018.
- ↑ Michael J. Brennan (January 26, 2009). Tropical Cyclone Report: Hurricane Paloma (PDF) (Report). Miami, Florida: National Hurricane Center. Retrieved February 10, 2018.
- ↑ "Gustav, Ike, and Paloma retired". National Oceanic and Atmospheric Administration. April 22, 2009. Archived from the original on August 11, 2009. Retrieved April 22, 2009.