Demographics of Asian Americans
The demographics of Asian Americans describe a heterogeneous group of people in the United States who trace their ancestry to one or more Asian countries.[1][2][3]
Manilamen began to reside in Louisiana as the first Asian Americans to live in the continental in the United States.[4] Most Asian Americans have arrived after 1965.[5] These individuals make up one-quarter of all immigrants who have arrived in the U.S. since 1965, and a majority of Asian Americans are foreign-born.[6] As of a 2016 census estimate there are nearly 21 million Asian Americans.[7] During the 2010 United States Census the largest ethnic groups were Chinese American, Filipino Americans, Indian Americans, Vietnamese Americans, Korean Americans, and Japanese Americans.[8]
The overall population is highly urbanized[9] and is concentrated in the Western United States and California.[6] Generally, Asian Americans are well educated,[10] and Asian American households have higher average incomes.[11] However, achievement is not uniform among their population.[12] No one religion has the majority of Asian Americans, however Christian Asian Americans make up a plurality of the population.[13] About 4% of Asian Americans identified as LGBT in 2012,[14] and nearly 5% of Asian Americans identified as LGBT in 2017.[15]
Background
The first recorded Asian Americans in the continental United States were a group of Filipino men who established the small settlement of Saint Malo, Louisiana, after fleeing mistreatment aboard Spanish ships.[4] Since there were no women with them, the Manilamen, as they were known, married Cajun and Native American women.[16] In 1778, Chinese and European explorers first arrived in Hawaii.[17][18] Numerous Chinese and Japanese began immigrating to the US in the mid-19th century;[19] numerous Chinese immigrants worked as laborers on the First Transcontinental Railroad, many who immigrated due to overpopulation and poverty experienced in Canton Province.[20] In the mid-20th century, refugees from Southeast Asia fled wars in the homelands to come to the United States.[21] Most Asian Americans who immigrated to the United States arrived after 1965, due to immigration reform that ended an earlier era of exclusion of Asian immigrants.[5]
Population
| Historical population | ||
|---|---|---|
| Year | Pop. | ±% |
| 1860 | 34,933 | — |
| 1870 | 63,254 | +81.1% |
| 1880 | 105,613 | +67.0% |
| 1890 | 109,527 | +3.7% |
| 1900 | 114,189 | +4.3% |
| 1910 | 146,863 | +28.6% |
| 1920 | 182,137 | +24.0% |
| 1930 | 264,766 | +45.4% |
| 1940 | 254,918 | −3.7% |
| 1950 | 321,033 | +25.9% |
| 1960 | 980,337 | +205.4% |
| 1970 | 1,538,721 | +57.0% |
| 1980 | 3,500,439 | +127.5% |
| 1990 | 6,908,638 | +97.4% |
| 2000 | 11,896,828 | +72.2% |
| 2010 | 17,320,856 | +45.6% |
| 2013 | 19,437,463 | +12.2% |
| 2016 | 20,901,780 | +7.5% |
| Sources[22][23][7] | ||
According to the United States Census Bureau, the Asian American population, including those of multiracial and Hispanic and Latino ancestry, per its 2017 American Community Survey was about 22,408,464.[26]
During the 2010 United States Census, there were a total of 17,320,856 Asian Americans, including Multiracial Americans identifying as part Asian. This made Asian Americans 5.6 percent of the total American population.[27] The largest ethnic groups represented in the census were Chinese (3.79 million), Filipino (3.41 million), Indian (3.18 million), Vietnamese (1.73 million), Korean (1.7 million), and Japanese (1.3 million).[8][28] Other sizable ethnic groups include Pakistani (409,000), Cambodian (276,000), Hmong (260,000), Thai (237,000), Laotian (232,000), Bangladeshi (147,000), and Burmese (100,000).[8] The total population of Asian Americans grew by 46 percent from 2000 to 2010 according to the Census Bureau, which constituted the largest increase of any major racial group during that period.[29] In 2010, there were an estimated 11,284,000 foreign born individuals who were born in Asia, of whom 57.7% had become naturalized citizens.[30] Additionally, 209,128 were Hispanic and Latino, of whom the largest population (101,654) claim Mexico as their nation of origin.[31]
The 2000 census recorded 11.9 million people (4.2 percent of the total population) who reported themselves as having either full or partial Asian heritage.[32] The largest ethnic subgroups were Chinese (2.7 million), Filipino (2.4 million), Indian (1.9 million), Vietnamese (1.2 million), Korean (1.2 million), and Japanese (1.1 million). Other sizable groups included Cambodians (206,000), Pakistanis (204,000), Lao (198,000), Hmong (186,000), and Thais (150,000).[32] About one-half of the Asian American population lived in the West, with California having the most total Asian Americans of any state, at 4.2 million.[32] As a proportion of the total population, Hawaii is the only state with an Asian American majority population, at 58 percent;[32] Honolulu County had the highest percentage of Asian Americans of any county in the nation, with 62 percent.[32] In 2000, 69 percent of all Asian Americans were foreign born, although Japanese Americans, 60 percent of whom were born in the United States, bucked this trend.[33]
The Twenty-first United States Census, conducted in 1990, recorded 6.9 million people who were called American Asians.[34] The largest ethnic groups were Chinese (23.8 percent), Filipino (20.4 percent), Japanese (12.3 percent), Indian (11.8 percent), Korean (11.6 percent), Vietnamese (8.9 percent), and Laotian (2.2 percent).[34] Smaller populations, of less than two percent, were documented of the following ethnicities: Cambodian, Thai, Hmong, Pakistani, Indonesian, Malay, Bangladeshi, Sri Lankan, and Burmese.[34] Two thirds of "American-Asians" lived in the five states of California, New York, Hawaii, Texas, and Illinois.[34] Additionally their highest population concentrations were in California, New York, and Hawaii.[34] In 1990, 66 percent of American Asians were foreign-born, with Vietnamese, Laotians, and Cambodians having this highest foreign born populations.[34]
Distribution
|
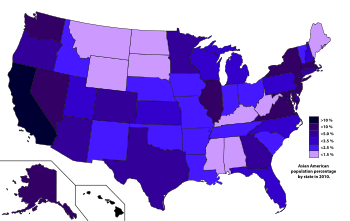
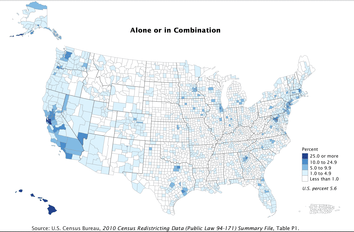
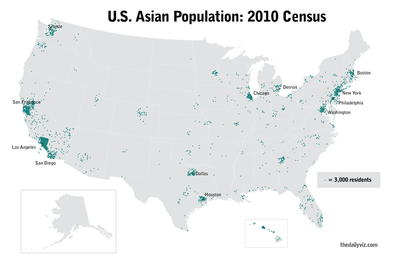
The Asian American population is greatly urbanized, with nearly three-quarters of them living in metropolitan areas with population greater than 2.5 million.[9] The three metropolitan areas with the highest Asian American populations are the Greater Los Angeles Area (1.868 million in 2007), the New York metropolitan area (1.782 million in 2007), and the San Francisco Bay Area (979,000 in 2007).[35] New York City proper, according to the United States 2010 Census, is home to more than one million Asian Americans, greater than the combined totals of San Francisco and Los Angeles.[36] This trend of a largely urban population continues to be observed in 2015, with significant populations in more expensive coastal cities, and less than five percent living in rural areas.[37] Among the ten largest US cities, San Diego has the greatest proportion of Asian Americans.[38] As of 2017, West (45%) and California (31%) had the most significant concentrations of the total Asian American populations;[6] this keeps with historic trends of Asian Americans primarily residing in the Western United States, although there is a shift towards other regions of the United States beginning in the late 20th century.[39] According to the 2010 Census almost three quarters of all Asian Americans live in California, New York, Texas, New Jersey, Hawaii, Illinois, Washington, Florida, Virginia, and Pennsylvania.[23] A large proportion of all Asian Americans live in California (5.6 million in 2010),[29][40] New York (1.6 million in 2010),[29] and Texas (1.1 million in 2010).[23] Another state with a significant Asian American population is Massachusetts.[41] Hawaii had the largest proportion of Asian Americans, with 57% of the state population identifying as Asian or multiracial with at least one part Asian.[29] In Vermont in 2008, Asian Americans were the largest minority.[42] Asian American populations have grown significantly since the 1970s. However, they are underrepresented in several large urban areas, such as Chicago, Philadelphia, Dallas and Atlanta, although in some cases, Asian Americans are concentrated in specific urban neighborhoods or suburbs of these cities. In regions with large numbers of Asian Americans, communities have developed that are heavily or predominantly Asian. Schools in these areas may offer instruction in languages such as Mandarin. These communities are often given unofficial names to reflect their populations, such as Chinatown, Little Manila, Little India, Little Pakistans, Koreatown, Little Saigons, and Cambodia Town. |
|
Trends
Asian Americans, on average, have higher incomes and education levels than White Americans. However, they paradoxically also have higher poverty rates and lower home ownership rates.[45] In addition, homeownership among Asian Americans has increased by twice as much as white Americans in recent years (see Homeownership in the United States).
Education
Asian Americans have the highest educational attainment of any racial group in the country; about 49.8% of them have at least a bachelor's degree.[10] Since the 1990s, Asian American students often have the highest math averages in standardized tests such as the SAT[46][47] and GRE.[48] Their combined scores are usually higher than those of white Americans.[46] The proportion of Asian Americans at many selective educational institutions exceeds the national population rate. Asians constitute around 10–20 percent of those attending Ivy League and other elite universities.[49][50] Asian Americans are the largest racial group on seven of the nine University of California campuses,[51] are the largest racial group of undergraduates in the system,[52] and make up more than a quarter of graduate and professional students.[53] Asian Americans are more likely to attend college,[54] are more likely to apply to competitive colleges,[55] and have significantly higher college completion level than other races.[10] According to a poll targeting Asian Americans in 14 states and the District of Columbia conducted by the Asian American Legal Defense and Education Fund in 2013, 40 percent of Asian Americans have a college degree, with almost a quarter of them having achieved an education attainment greater than a bachelor's degree.[56] That same year, Asian Americans in their late thirties had the highest percentage (65%) of college graduates for that age group than any other race or ethnicity in the United States.[57] These high education attainment statistics contribute to a stereotype of academic and vocational excellence for Asian Americans.[58]
However, there are concerns that the goal of diversity in American higher education has had a negative effect on Asians, with charges of quotas and discrimination starting in the 1980s.[59] Asian American test scores are also bimodal—Asians are over represented both at high scores and low scores.[60] A stereotype has been created that Asian Americans only study STEM and health-related fields at their universities (to become engineers, doctors, etc.).[61] But according to a report by the College Board, Asian Americans do have academic interest in fields like social science, humanities, and education.[62] According to an opinion piece written in The Harvard Crimson, Asian Americans are "over-represented" in higher education in the United States, specifically at elite colleges.[63] This includes Harvard University & Massachusetts Institute of Technology, where over a fifth of undergraduates are Asian American.[64] Similar increases in Asian American enrollment was found in the University of California system, especially in the late 20th century.[65] However, only a small number of institutions are presented, usually selective enrollment institutions, thus making it appear that Asian Americans make up a large part of a university's student population.[62] Moreover, this discrimination brought upon Asian Americans in education has encouraged the model minority stereotype in American society.[65][66] The high expectations placed on Asian American students often cause the problems faced by these students to be overlooked.[67] Issues related to social pressure and mental health are often overlooked due to the idea of the model minority.[68] Education is one of the main aspects that are given a high regard in the social expectations of Asian Americans.[69]
Income
|
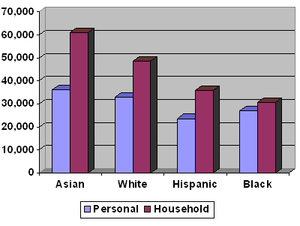
While Asian Americans have higher household and personal income levels than any other racial demographic, the Asian poverty rate is higher than that of European Americans.[70] In 2005, the median per capita income for Asian Americans was estimated at $27,331, compared to $26,496 for Whites, $16,874 for African Americans, and $14,483 for those identifying as Hispanic or Latino; the median household income of Asian Americans was estimated at $61,094, compared to $48,554 for European Americans.[11] Additionally 28 percent of Asian American households had incomes exceeding $100,000, compared to 18 percent of the overall population.[71] In 2006, Asian American households were slightly larger than other households, with fewer households with no earners.[72] In 2008, Asian American households had the highest median income in the US, at $65,637; however, 11.8 percent of Asians were in poverty in 2004, a higher than the 8.6 percent rate for non-Hispanic whites.[73] This is largely due to the fact that a high percentage of Asian Americans are immigrants, and independently of race, immigrants are more likely than the native-born to be poor. Once country of birth and other demographic factors are taken into account, Asian Americans are no more likely than non-Hispanic whites to live in poverty.[74] Much of this poverty is concentrated in ethnic enclaves, such as Chinatowns.[75] |
|
In 2010, the median household income of Asian Americans had increased to $67,022.[79] As with educational achievement, economic prosperity is not uniform among all Asian American groups.[80] In 2005 Census figures show that an average white male with a college diploma earns around $66,000 a year, while similarly educated Asian men earn around $52,000 a year.[81]
However by 2008, according to the College Board and United States Census Bureau, Asian American males with similar education achievement as their White American male counterparts earned more than their White American male counter parts (median AM = $71K, median WM = $66K). Asian American females also earned more than their White American female counterparts (median AF = $67K, median WF = $51K).[82]
Population growth
Asian American population growth is fueled largely by immigration. Natural population growth accounts for a small proportion of the 43 percent increase in total Asian American population between 2000 and 2010.[23][85][86]
Asian American alone
|
With multiracial identifiers
|
Population estimate in 2017 with multiracial identifiers
|
Language
According to the 2000 Census, the more prominent languages of the Asian American community include the Chinese languages (Mandarin, Cantonese, Taishanese, and Hokkien), Tagalog, Vietnamese, Korean, Japanese, Hindi, Urdu, and Gujarati.[88] In 2008, Chinese, Japanese, Korean, Tagalog, and Vietnamese languages were all used in elections in Alaska, California, Hawaii, Illinois, New York, Texas, and Washington state.[89]
In 2010, there were 2.8 million people (5 and older) who spoke a Chinese language at home;[90] after the English and Spanish languages, it is the third most common language in the United States.[90] Other sizeable Asian languages are Tagalog, Vietnamese, and Korean, with all three having more than 1 million speakers in the United States.[90][91][92]
In 2012, Alaska, California, Hawaii, Illinois, Massachusetts, Michigan, Nevada, New Jersey, New York, Texas and Washington were publishing election material in Asian languages in accordance with the Voting Rights Act.[93] These include Tagalog, Mandarin Chinese, Vietnamese, Hindi and Bengali.[93] Election materials were also available in Gujarati, Japanese, Khmer, Korean, and Thai.[94] According to a 2013 poll conducted by the Asian American Legal Defense and Education Fund, 48 percent of Asian Americans considered media in their native language as their primary news source.[95]
| Language | Population 2016 | Speak English "very well" | Speak English less than "very well" |
|---|---|---|---|
| Chinese | 3,372,930 | 1,518,619 | 1,854,311 |
| Tagalog | 1,701,960 | 1,159,211 | 542,749 |
| Vietnamese | 1,509,994 | 634,273 | 875,720 |
| Korean | 1,088,788 | 505,734 | 583,054 |
| Hindi | 810,877 | 642,855 | 172,182 |
| Urdu | 474,481 | 342,436 | 132,045 |
| Japanese | 464,535 | 265,552 | 197,983 |
| Gujarati | 407,520 | 265,219 | 139,612 |
| Telugu | 365,566 | 264,368 | 143,152 |
| Bengali | 324,008 | 182,447 | 141,561 |
| Tai-Kadai | 307,442 | 152,210 | 155,212 |
| Punjabi | 287,491 | 168,743 | 118,748 |
| Tamil | 273,332 | 221,997 | 51,355 |
| Hmong | 224,133 | 133,163 | 90,970 |
| Khmer | 203,115 | 102,364 | 100,751 |
| Other Austronesian languages | 467,718 | 291,405 | 176,313 |
| Other Indic languages | 409,631 | 244,847 | 164,784 |
| Other Dravidian languages | 241,678 | 184,233 | 57,445 |
| Other languages of Asia | 384,154 | 175,146 | 209,008 |
Religion
Asian American religious preferences are wide-ranging and tend to be more diverse than those other races in the United States.[96] The growth of Asian American immigration since 1965 has contributed to this diversity.[97] Until recently, a dearth of scholarship regarding Asian American religious beliefs led to a stereotype that Asian Americans are not religious or spiritual.[98] Although 59 percent of Asian Americans believe strongly in the existence of one or more gods, 30 percent identify as "secular" or "somewhat secular." Only 39 percent of Asian American households belong to a local church or temple, due to atheism or adherence to Eastern religions without congregational traditions.[99]
Although no one religious affiliation claims a majority of Asian Americans, about 45 percent of them adhere to some form of Christianity.[100][13] A Trinity College survey, conducted in 2008, found that 38 percent of Christian Asian Americans are Catholic;[101] Filipino Americans are majority Catholic, and a significant minority of Vietnamese Americans are as well.[97] It found that of all demographic populations, Asian Americans had the highest number of respondents who did not claim a religion or refused to divulge their religious affiliation.[101] Various surveys have put this number between 23 and 27 percent of Asian Americans.[13][101] It also found that 8% of Asian Americans are Muslim;[101] many of these Muslim Asian Americans come from, or trace their ancestry to, Bangladesh, China, India, Indonesia, Malaysia, and Pakistan.[102][103]
A Gallup poll conducted in 2010 found that Asian Americans were the group least likely to say that religion was important in their daily lives, although a 54 percent majority of respondents still said that religion was important in their daily lives.[104] In 2012, a survey was conducted by the Pew Research Center of the Faiths of Asian Americans, and it found that Christianity had the largest plurality (42%) of Asian American respondents, followed by those who were unaffiliated (26%).[105] The three next largest faiths, of those who responded, were Buddhist (14%), Hindu (10%), and Muslim (4%).[105]
Sexuality
According to a Gallup survey conducted from June to September 2012, 4.3 percent of Asian Americans self identify as LGBT. This compares with 4.6 percent of African-Americans, 4 percent of Hispanic-Americans, 3.2 percent of Caucasian-Americans, and the overall 3.4 percent of American adults that self identify as LGBT in the total population.[14]
In a Gallup survey conducted in 2017, 4.9 percent of Asian Americans identified as LGBT, representing the second-highest growth of LGBT representation among African Americans, Hispanic Americans, and Caucasian Americans.[106]
U.S. states and territories
| State/Territory | Asian American Population (2010)[23][107] | Percentage Asian American (2010)[23] | Chinese[108] | Filipino[109] | Indian[110] | Japanese[111] | Korean[112] | Vietnamese[113] | Other Asian |
|---|---|---|---|---|---|---|---|---|---|
| 67,036 | 1.4 | 11,154 | 8,224 | 14,951 | 4,336 | 10,624 | 8,488 | 9,259 | |
| 50,402 | 7.1 | 3,726 | 25,424 | 1,911 | 3,926 | 6,542 | 1,446 | 7,427 | |
| 1,994 | 3.6 | 440 | 1,217 | 3 | 11 | 217 | 34 | 72 | |
| 230,907 | 3.6 | 42,331 | 53,067 | 40,510 | 19,611 | 21,125 | 27,872 | 26,391 | |
| 44,943 | 1.5 | 6,301 | 6,396 | 7,973 | 2,384 | 3,247 | 6,302 | 12,340 | |
| 5,556,592 | 14.9 | 1,451,537 | 1,474,707 | 590,445 | 428,014 | 505,225 | 647,589 | 459,075 | |
| 185,589 | 3.7 | 33,344 | 26,242 | 24,135 | 22,714 | 28,177 | 23,933 | 27,044 | |
| 157,088 | 4.4 | 36,483 | 16,402 | 50,806 | 6,203 | 11,760 | 10,804 | 24,630 | |
| 33,701 | 3.8 | 7,033 | 4,637 | 12,344 | 1,196 | 3,099 | 1,688 | 3,704 | |
| 26,857 | 4.5 | 6,583 | 3,670 | 6,417 | 2,010 | 2,990 | 1,856 | 3,331 | |
| 573,083 | 3.0 | 94,244 | 122,691 | 151,438 | 25,747 | 35,629 | 65,772 | 77,562 | |
| 365,497 | 3.8 | 54,298 | 28,528 | 105,444 | 14,247 | 60,836 | 49,264 | 52,880 | |
| 51,381 | 32.2 | 2,617 | 41,944 | — | 2,368 | 3,437 | 337 | 678 | |
| 780,968 | 57.4 | 199,751 | 342,095 | 4,737 | 312,292 | 48,699 | 13,266 | 139,872 | |
| 29,698 | 1.9 | 5,473 | 6,211 | 2,786 | 5,698 | 2,806 | 2,154 | 4,570 | |
| 668,694 | 5.2 | 119,308 | 139,090 | 203,669 | 28,623 | 70,263 | 29,101 | 78,640 | |
| 126,750 | 2.0 | 26,038 | 16,988 | 30,947 | 8,437 | 13,685 | 8,175 | 22,480 | |
| 64,512 | 2.1 | 11,494 | 6,026 | 12,525 | 2,854 | 7,375 | 9,543 | 14,695 | |
| 83,930 | 2.9 | 13,448 | 9,399 | 15,644 | 4,178 | 7,756 | 16,074 | 17,431 | |
| 62,029 | 1.4 | 10,512 | 8,402 | 14,253 | 6,197 | 7,264 | 5,813 | 9,588 | |
| 84,335 | 1.9 | 11,953 | 10,243 | 13,147 | 3,117 | 4,752 | 30,202 | 10,921 | |
| 18,333 | 1.4 | 4,390 | 2,918 | 2,397 | 1,181 | 1,741 | 2,170 | 3,536 | |
| 370,044 | 6.4 | 79,660 | 56,909 | 88,709 | 12,826 | 55,051 | 26,605 | 50,284 | |
| 394,211 | 6.0 | 136,866 | 18,673 | 85,441 | 15,358 | 28,904 | 47,636 | 61,343 | |
| 289,607 | 2.9 | 51,525 | 32,324 | 84,750 | 17,412 | 30,292 | 19,456 | 53,848 | |
| 247,132 | 4.7 | 30,047 | 15,660 | 38,097 | 7,995 | 20,995 | 27,086 | 107,252 | |
| 32,560 | 1.1 | 5,333 | 5,638 | 6,458 | 807 | 2,301 | 7,721 | 4,302 | |
| 123,571 | 2.1 | 26,001 | 17,706 | 26,263 | 7,084 | 12,689 | 16,530 | 17,298 | |
| 10,482 | 1.1 | 1,919 | 2,829 | 930 | 1,854 | 1,369 | 481 | 1,100 | |
| 40,561 | 2.2 | 5,730 | 4,900 | 6,708 | 3,106 | 3,815 | 8,677 | 7,625 | |
| 242,916 | 9.0 | 39,448 | 123,891 | 14,290 | 21,364 | 18,518 | 12,366 | 13,039 | |
| 34,522 | 2.6 | 7,652 | 3,369 | 9,075 | 1,842 | 3,021 | 2,907 | 6,686 | |
| 795,163 | 9.0 | 149,356 | 126,793 | 311,310 | 19,710 | 100,334 | 23,535 | 64,125 | |
| 40,456 | 2.0 | 7,668 | 8,535 | 5,727 | 4,889 | 3,760 | 5,403 | 4,474 | |
| 1,579,494 | 8.2 | 615,932 | 126,129 | 368,767 | 51,781 | 153,609 | 34,510 | 228,763 | |
| 252,585 | 2.6 | 40,820 | 29,314 | 63,852 | 12,878 | 25,420 | 30,665 | 49,636 | |
| 9,193 | 1.4 | 1,762 | 1,704 | 1,740 | 628 | 933 | 791 | 1,635 | |
| 26,908 | 49.9 | 3,659 | 19,017 | — | 795 | 2,253 | — | 1,184 | |
| 238,292 | 2.1 | 50,870 | 27,661 | 71,211 | 16,995 | 21,207 | 15,639 | 34,706 | |
| 84,170 | 2.2 | 11,658 | 10,850 | 14,078 | 5,580 | 9,072 | 18,098 | 14,834 | |
| 186,281 | 4.9 | 41,374 | 29,101 | 20,200 | 24,535 | 20,395 | 29,485 | 21,191 | |
| 402,587 | 3.2 | 96,606 | 33,021 | 113,389 | 12,699 | 47,429 | 44,605 | 54,838 | |
| 10,464 | 0.3 | 2,751 | 445 | 5,475 | 313 | 205 | 232 | 1,043 | |
| 36,763 | 3.5 | 8,228 | 4,117 | 5,645 | 1,455 | 2,658 | 1,615 | 13,045 | |
| 75,674 | 1.6 | 11,706 | 15,228 | 17,961 | 4,745 | 7,162 | 7,840 | 11,032 | |
| 10,216 | 1.3 | 1,570 | 1,864 | 1,433 | 696 | 1,179 | 1,002 | 2,472 | |
| 113,398 | 1.8 | 18,313 | 14,409 | 26,619 | 6,955 | 13,245 | 11,351 | 22,506 | |
| 1,110,666 | 4.4 | 182,477 | 137,713 | 269,327 | 37,715 | 85,332 | 227,968 | 170,134 | |
| 77,748 | 2.8 | 16,358 | 10,657 | 7,598 | 12,782 | 7,888 | 9,338 | 13,127 | |
| 10,463 | 1.7 | 2,833 | 1,035 | 1,723 | 842 | 1,271 | 1,206 | 1,553 | |
| 1,457 | 1.4 | — | — | — | — | — | — | 1,457 | |
| 522,199 | 6.5 | 72,585 | 90,493 | 114,471 | 20,138 | 82,006 | 59,984 | 82,522 | |
| 604,251 | 9.0 | 120,814 | 137,083 | 68,978 | 67,597 | 80,049 | 75,843 | 53,887 | |
| 16,465 | 0.9 | 3,208 | 3,059 | 3,969 | 1,159 | 1,571 | 1,104 | 2,395 | |
| 151,513 | 2.7 | 21,054 | 13,158 | 25,998 | 5,967 | 10,949 | 6,191 | 68,196 | |
| 6,729 | 1.2 | 1,340 | 1,657 | 739 | 982 | 803 | 283 | 925 | |
| 17,320,856 | 5.6 | 4,010,114 | 3,416,840 | 3,183,063 | 1,304,286 | 1,706,822 | 1,737,433 | 1,962,298 |
The above list displays the population of Asian Americans ("Alone, or in combination") in US states, Puerto Rico, and the District of Columbia, according to the 2010 United States Census;
Chinese Americans figures include Taiwanese Americans; Data for the territories (except Puerto Rico) is from American FactFinder's 2010 United States Census data[115][116][117][118]
See also
- List of U.S. cities with Asian American majority populations
References
- Felicity Barringer (March 2, 1990). "Asian Population in U.S. Grew by 70% in the 80's". New York Times. Retrieved January 10, 2013.
- Lowe, Lisa (2004). "Heterogeneity, Hybridity, Multiplicity: Marking Asian American Differences". In Ono, Kent A. (ed.). A Companion to Asian American Studies. Blackwell Companions in Cultural Studies. John Wiley & Sons. p. 272. ISBN 978-1-4051-1595-7. Retrieved January 10, 2013.
- Lowe, Lisa (Spring 1991). "Heterogeneity, Hybridity, Multiplicity: Marking Asian American Differences". Diaspora: A Journal of Transnational Studies. 1 (1): 24–44. doi:10.1353/dsp.1991.0014. ISSN 1911-1568.
- "Filipinos in Louisiana". Retrieved January 5, 2011.
- Rebecca Trounson (June 18, 2012). "Fueled by immigration, Asians are fastest-growing U.S. group". Los Angeles Times. Retrieved January 6, 2013.
- Lopez, Gustavo; Ruiz, Niel G.; Patten, Eileen (8 September 2017). "Key facts about Asian Americans, a diverse and growing population". FactTank. Pew Research Center. Retrieved 10 April 2018.
- "American FactFinder - Results". Factfinder.census.gov. Archived from the original on February 14, 2020. Retrieved August 17, 2018.
- "ASIAN ALONE OR IN COMBINATION WITH ONE OR MORE OTHER RACES, AND WITH ONE OR MORE ASIAN CATEGORIES FOR SELECTED GROUPS". United States Census Bureau. United States Department of Commerce. 2011. Archived from the original on February 12, 2020. Retrieved December 25, 2011.
- Lott, Juanita Tamayo (9 January 2004). Asian-American Children Are Members of a Diverse and Urban Population (Report). Population Reference Bureau. Retrieved 6 April 2018.
Hune, Shirley (16 April 2002). "Demographics and Diversity of Asian American College Students". New Directions for Student Services. 2002 (97): 11–20. doi:10.1002/ss.35.
Franklin Ng (1998). The History and Immigration of Asian Americans. Taylor & Francis. p. 211. ISBN 978-0-8153-2690-8.
Xue Lan Rong; Judith Preissle (26 September 2008). Educating Immigrant Students in the 21st Century: What Educators Need to Know. SAGE Publications. p. 133. ISBN 978-1-4522-9405-6. - Stoops, Nicole (June 2004). "Educational Attainment in the United States: 2003" (PDF). United States Census Bureau. United States Department of Commerce. Retrieved February 26, 2012.
- Carmen DeNavas-Walt; Bernadette D. Proctor; Cheryll Hill Lee (August 2006). "Income, Poverty, and Health Insurance Coverage in the United States: 2005" (PDF). United States Census Bureau. Retrieved April 2, 2013.
- Weingarten, Liza; Smith, Raymond Arthur (2009). "Asian American Immigration Status" (PDF). Majority Rule and Minority Rights Issue Briefs. Columbia University. Retrieved March 4, 2012.
- Lugo, Luis; Sandra Stencel; John Green; Gregory Smith; Dan Cox; Allison Pond; Tracy Miller; Elizabeth Podrebarac; Michelle Ralston (February 2008). "U.S. Religious Landscape Survey: Religious Affiliation: Diverse and Dynamic" (PDF). Pew Forum on Religion & Public Life. Pew Research Center. Retrieved March 6, 2012.
- David Crary (October 18, 2012). "Gallup study: 3.4 percent of US adults are LGBT". WTOP. Associated Press. Retrieved October 23, 2012.
Gary J. Gates; Frank Newport (October 18, 2012). "Special Report: 3.4% of U.S. Adults Identify as LGBT". Gallup. Retrieved 17 March 2017.Nonwhites are more likely than white segments of the U.S. population to identify as LGBT. The survey results show that 4.6% of African-Americans identify as LGBT, along with 4.0% of Hispanics and 4.3% of Asians. The disproportionately higher representation of LGBT status among nonwhite population segments corresponds to the slightly below-average 3.2% of white Americans who identified as LGBT.
- Inc, Gallup (22 May 2018). "In U.S., Estimate of LGBT Population Rises to 4.5%". Gallup.com. Retrieved 10 December 2019.
- Wachtel, Alan (2009). Southeast Asian Americans. Marshall Cavendish. p. 80. ISBN 978-0-7614-4312-4. Retrieved December 5, 2010.
- Wai-Jane Cha. "Chinese Merchant-Adventurers and Sugar Masters in Hawaii: 1802–1852" (PDF). University of Hawaiʻi at Mānoa. Retrieved January 14, 2011.
- Kalikiano Kalei (August 12, 2010). "The Chinese Experience in Hawaii". University of Hawai'i Press. Archived from the original on January 17, 2013. Retrieved January 14, 2011.
- Walter, Yvonne (2000). "Asian Americans and American Immigration and Naturalization Policy". American Studies Journal. 45 (Summer). ISSN 1433-5239. Retrieved January 6, 2013.
- "General Article: Workers of the Central Pacific Railroad". WGBH Educational Foundation. Public Broadcasting Service. 2010. Retrieved January 6, 2013.
- "Southeast Asian Archive". University of California, Irvine Libraries. The Regents of the University of California. Retrieved January 6, 2013.
- Campbell Gibson; Kay Jung (September 2002). "Historical Census Statistics on Population Totals By Race, 1790 to 1990, and By Hispanic Origin, 1970 to 1990, For The United States, Regions, Divisions, and States" (PDF). Population Division. United States Census Bureau. Archived from the original (PDF) on 2010-03-27. Retrieved November 17, 2012.
- Elizabeth M. Hoeffel; Sonya Rastogi; Myoung Ouk Kim; Hasan Shahid (March 2012). "The Asian Population: 2010" (PDF). 2010 Census Briefs. United States Census Bureau. Retrieved November 17, 2012.
- "Most Children Younger Than Age 1 are Minorities, Census Bureau Reports – Population – Newsroom – U.S. Census Bureau". United States Census Bureau. May 17, 2012. Retrieved November 13, 2012.
- "American FactFinder - Results". Factfinder2.census.gov. Archived from the original on February 12, 2020. Retrieved August 17, 2018.
- "Asian Alone or in Any Combination by Selected Groups". American Fact Finder. United States Census Bureau. 2017. Archived from the original on 13 February 2020. Retrieved 24 February 2019.
Total Groups Tallied: 22,408,464 +/-43,477
- Humes, Karen R.; Jones, Nicholas A.; Ramirez, Roberto R. (March 2011). "Overview of Race and Hispanic Origin: 2010" (PDF). United States Census Bureau. United States Department of Commerce. Archived from the original (PDF) on 2011-04-29. Retrieved December 25, 2011.
- "The Asian Population in the United States" (PDF). United States Census Bureau. U.S. Department of Commerece. Archived from the original (PDF) on 19 August 2014. Retrieved 18 August 2014.
- "Asian/Pacific American Heritage Month: May 2011". Facts for Features. United States Census Bureau. December 7, 2011. Retrieved January 4, 2012.
- Elizabeth M. Grieco; Yesenia D. Acosta; G. Petricia de la Cruz; Christine Gambino; Thomas Gryn; Luke J. Larsen; Edward N. Trevelyan; Nathan P. Walters (May 2012). "The Foreign-Born Population in the United States: 2010" (PDF). American Community Survey Reports. United States Census Bureau. Archived from the original (PDF) on February 9, 2015. Retrieved April 5, 2013.
- Sharon R. Ennis; Merays Rios-Vargas; Nora G. Albert (May 2011). "The Hispanic Population: 2010" (PDF). United States Census Bureau. United States Department of Commerce. Retrieved May 26, 2013.
- Barnes, Jessica S.; Bennett, Claudette E. (February 2002). "The Asian Population: 2000" (PDF). Census 2000. United States Census Bureau. Retrieved January 10, 2013.
- "We the People: Asians in the United States" (PDF). United States Census Bureau. United States Department of Commerce. December 2004. Retrieved March 10, 2011.
- Paisano, Edna L.; Carroll, Deborah L.; June H., Cowles; DeBarros, Kymberly A.; Robinson, Ann J.; Miles, Kenya N.; Harrison, Roderick J. (September 1993). "We the Americans: Asians" (PDF). Bureau of the Census. United States Department of Commerce. Archived from the original (PDF) on March 18, 1997. Retrieved January 10, 2013.
- "Selected Population Profile in the United States". United States Census Bureau. United States Department of Commerce. Archived from the original on February 12, 2020. Retrieved June 25, 2011.
Lee, Sharon M. (1998). "Asian Americans: Diverse and Growing" (PDF). Population Bulletin. Population Reference Bureau. 53 (2). Retrieved March 9, 2013.
Ng, Franklin (1998). The History and Immigration of Asian Americans. Taylor & Francis. p. 211. ISBN 978-0-8153-2690-8. Retrieved March 9, 2013. - Semple, Kirk (June 23, 2011). "Asian New Yorkers Seek Power to Match Numbers". The New York Times. Retrieved June 24, 2011.
Asians, a group more commonly associated with the West Coast, are surging in New York, where they have long been eclipsed in the city's kaleidoscopic racial and ethnic mix. For the first time, according to census figures released in the spring, their numbers have topped one million — nearly 1 in 8 New Yorkers — which is more than the Asian population in the cities of San Francisco and Los Angeles combined.
- Guo, Jeff (29 December 2016). "The Asian American 'advantage' that is actually an illusion". Washington Post. Retrieved 17 March 2017.
- "Asian American Statistics". © 2011 Améredia Incorporated. Retrieved June 25, 2011.
Jessica S. Barnes (January 2010). Asian Population: 2000: Census 2000 Brief. DIANE Publishing. p. 7. ISBN 978-1-4379-2104-5. - Edith Wen-Chu Chen (2010). Encyclopedia of Asian American Issues Today. ABC-CLIO. p. 7. ISBN 978-0-313-34751-1.
Pyong Gap Min (2006). Asian Americans: Contemporary Trends and Issues. Pine Forge Press. p. 186. ISBN 978-1-4129-0556-5.
Mary Yu Danico; Franklin Ng (2004). Asian American Issues. Greenwood Publishing Group. p. 14. ISBN 978-0-313-31965-5. - Dan Walters (21 March 2012). "California has by far nation's largest Asian-American population". Sacramento Bee. Retrieved 22 January 2015.
- "Asian American/Pacific Islander Profile". Office of Minority Health. United States Department of Health and Human Services. January 24, 2012. Archived from the original on February 4, 2012. Retrieved February 7, 2012.
- Bernstein, Robert (May 1, 2008). "U.S. Hispanic Population Surpasses 45 Million". United States Census Bureau. United States Department of Commerce. Archived from the original on August 31, 2008. Retrieved August 24, 2009.
- "America's Asian Population Patterns 2000-2010". U.S. Census Bureau. Retrieved July 19, 2012.
- Anchorage (municipality) QuickFacts from the US Census Bureau
- "Broad racial disparities persist". NBC News. Retrieved December 18, 2006.
- "School Performance". The Multicultural Families and Adolescents Study. University of California, Riverside. 2004. Archived from the original on February 21, 2012. Retrieved February 26, 2012.
- Banchero, Stephanie (September 14, 2010). "Students' SAT Scores Stay in Rut". The Wall Street Journal. Retrieved February 26, 2012.
- Grandy, Jerille (July 1996). "Differences in the Survey Responses of Asian American and White Science and Engineering Students" (PDF). Graduate Record Examinations Board. Educational Testing Service. Retrieved February 26, 2012.
Self-perceived abilities were consistent with GRE scores. The Asian American sample did, in fact, earn higher average GRE quantitative scores and lower average verbal and analytical scores than the White sample did.
- Kara Miller (February 8, 2010). "Do colleges redline Asian-Americans?". The Boston Globe. Retrieved February 26, 2012.
Indeed, as Princeton's Nieli suggests, most elite universities appear determined to keep their Asian-American totals in a narrow range. Yale's class of 2013 is 15.5 percent Asian-American, compared with 16.1 percent at Dartmouth, 19.1 percent at Harvard, and 17.6 percent at Princeton.
- Ghosh, Palash R. (August 17, 2010). "Asian-Americans in the Ivy League: A Portrait of Privilege and Discrimination". International Business Times. Retrieved February 26, 2012.
- Charles C. Johnson (July 29, 2011). "The New Chinese Exclusion Act". The Wall Street Journal. Retrieved December 30, 2014.
- "Asian-Americans blast UC admissions policy". Associated Press. April 24, 2009. Retrieved February 26, 2012.
- "Diversity: Annual Accountability Sub-Report" (PDF). University of California. September 2010. Retrieved December 30, 2014.
- Brown, Michael K. (2003). Whitewashing race: the myth of a color-blind society. University of California Press. p. 121. ISBN 978-0-520-23706-3. Retrieved February 26, 2012.
While Asian Americans are far more likely to attend college and are somewhat more likely to complete it, Asian American college graduates earn slightly less than whites.
- Jaschik, Scott (August 22, 2011). "Who Applies (and Gets in)". Inside Higher Ed. Retrieved February 26, 2012.
- Doris Nhan (January 18, 2013). "10 Surprising Statistics on the Political Leanings of Asian-American Voters". National Journal. Archived from the original on February 16, 2013. Retrieved January 25, 2013.
- Sunstein, Cass (3 March 2015). "Asian-Americans will soon be wealthiest Americans". Chicago Tribune. Bloomberg. Retrieved 6 March 2015.
- Mekouar, Dora (11 April 2016). "Why Asian Americans Are the Most Educated Group in America". All About America. Voice of America. Retrieved 7 October 2018.
- Hong, Christine; Lee, Catherine; Leong, Andrew (January 17, 2011). "What Really Happened to Diversity?". Asian American and Asian Diaspora Studies. University of California, Berkeley. Retrieved February 26, 2012.
Hsu, Stephen (February 5, 2012). "What Harvard Owes Its Top Asian-American Applicants". San Francisco Chronicle. Retrieved February 26, 2012.
Jaschik, Scott (February 3, 2012). "Is it Bias? Is it Legal?". Inside Higher Ed. Retrieved February 26, 2012.
Joe, Don W. "Statistics on Reverse Discrimination". Asian-American Politics. Archived from the original on March 8, 2012. Retrieved February 26, 2012. - Junn, Jane; Masuoka, Natalie (2008). "Asian American Identity: Shared Racial Status and Political Context" (PDF). Perspectives on Politics. 6 (4): 729. doi:10.1017/s1537592708081887. Retrieved February 26, 2012.
Teranishi, Robert T. "The Need for Disaggregated and Cross-Tabulated Data in Higher Education Policymaking". National Commission on Asian American and Pacific Islander Research in Education. United States Department of Education. Retrieved February 26, 2012.
Krupnick, Matt (21 May 2015). "These groups of Asian-Americans rarely attend college, but California is trying to change that". News Hour. The Public Broadcasting Service. Retrieved 12 April 2018.
Mitchell Chang; Gordon Fung; Don Nakanishi; Rodney Ogawa; Katharya Um; Lois Takahashi; Melany De La Cruz-Viesca; Yen Ling Shek; Annie Kuo; Laura Russ (September 2012). The State of Asian American, Native Hawaiian, and Pacific Islander Education in California (PDF) (Report). University of California Asian American and Pacific Islander Policy Multicampus Research Program. Retrieved 7 October 2018. - Williams, Joan C.; Multhaup, Marina; Korn, Rachel (31 January 2018). "The Problem With 'Asians Are Good at Science'". The Atlantic. Washington, D.C.: The Atlantic Monthly Group. Retrieved 12 April 2018.
Weseley, Allyson J.; Chai, Daniel (2017). "Is STEM running out of steam for Asian Americans? College admissions officers' perceptions of applicants". Asian Journal of Social Psychology. 20 (1): 45–53. doi:10.1111/ajsp.12165. - Teranishi, Robert; Tchen, John Kuo Wei; OuYang, Elizabeth R.; Zia, Helen; Yoshino, Karen; Behringer, Laurie; Nguyen, Tu Lien; Tu, Thuy Linh Nguyen; Handel, Stephen J. (2008). Asian Americans and Pacific Islanders: Facts, Not Fiction: Setting The Record Straight (PDF) (Report). College Board. National Commission on Asian American and Pacific Islander Research in Education. Retrieved 12 April 2018.
- Coscetta, Michael T. (1 December 2006). "Asian Americans Are Overrepresented At Elite Colleges". The Crimson. Retrieved 12 April 2018.
- Jaschik, Scott (7 August 2017). "The Numbers and the Arguments on Asian Admissions". Inside Higher Ed. Quad Partners. Retrieved 12 April 2018.
- Lee, Sharon S. (January 2008). "The De-Minoritization of Asian Americans: A Historical Examination of the Representations of Asian Americans in Affirmative Action Admissions Policies at the University of California". Asian American Law Journal. 15 (1): 129–152. doi:10.15779/Z388P3M. Retrieved 12 April 2018.
- Joo, Nathan; Reeves, Richard V.; Rodrigue, Edward (20 April 2016). Asian-American success and the pitfalls of generalization (Report). Brookings Institution. Retrieved 12 April 2018.
- Raleigh, Helen (8 August 2017). "Race-Based Admissions Have Asian Students Hiding Their Ethnicity To Avoid Discrimination". The Federalist. Retrieved 12 April 2018.
"The model minority is losing patience". The Economist. London. 3 October 2015. Retrieved 12 April 2018.
Mooko, Daren R. (1995). "The Asian American College Student as Model Minority: The Myth, The Paradox and The Deception". The Vermont Connection. University of Vermont. Retrieved 12 April 2018.
Wong, Alia (3 August 2017). "The Thorny Relationship Between Asians and Affirmative Action". The Atlantic. Retrieved 12 April 2018. - Yeh, Theresa Ling (16 April 2002). "Asian American College Students Who Are Educationally at Risk". New Directions for Student Services. 2002 (97): 61–72. doi:10.1002/ss.39.
- Kiang, Lisa; Huynh, Virginia W.; Cheah, Charissa S. L.; Wang, Yijie; Yoshikawa, Hirokazu (2017). "Moving Beyond the Model Minority". Asian American Journal of Psychology. 8 (1): 1–6. doi:10.1037/aap0000070. Retrieved 12 April 2018.
- US Census Bureau publication p 60–231 "Income, Poverty and Health Insurance in the United States: 2005" (PDF). Retrieved December 18, 2006.
- "State of the Asian American Consumer" (PDF). The Nielsen Company. 2012. Retrieved April 2, 2013.
- Shiao-Lin Shirley Tsai; Lucilla Tan (June 2006). "Food-at-home expenditures of Asian households" (PDF). Bureau of Labor Statistics. Retrieved April 2, 2013.
- "Income, Poverty, and Health Insurance Coverage in the United States: 2008" (PDF). United States Census Bureau. 2009. p. 9.
- Takei, Isao; Sakamoto, Arthur (August 17, 2018). "Poverty among Asian Americans in the 21st Century". Sociological Perspectives. 54 (2): 251–276. doi:10.1525/sop.2011.54.2.251. JSTOR 10.1525/sop.2011.54.2.251.
- Financing Affordable Housing: A Primer By Rick Liu, Sampan (archived from the original on June 16, 2008)
- "Table PINC-03. Educational Attainment—People 25 Years Old and Over, by Total Money Earnings in 2005, Work Experience in 2005, Age, Race, Hispanic Origin and Sex". Annual Demographic Servey. U.S. Census. August 29, 2006. Archived from the original on January 4, 2007. Retrieved June 20, 2011.
- "Table HINC-06. Income Distribution to $250,000 or More for Households: 2005". Annual Demographic Servey. U.S. Census. August 29, 2006. Archived from the original on January 4, 2007. Retrieved June 20, 2011.
- "Table 690. Money Income of Households—Percent Distribution by Income Level, Race, and Hispanic Origin, in Constant (2009) Dollars: 1990 to 2009" (PDF). United States Census Bureau. United States Department of Commerce. 2012. Retrieved 22 October 2014.
- "Asian/Pacific American Heritage Month: May 2012". United States Census Bureau. United States Department of Commerce. March 21, 2012. Retrieved April 2, 2013.
- Weingarten, Liza; Smith, Raymond Arthur (2009). "Asian American Immigration Status" (PDF). Majority Rule and Minority Rights Issue Briefs. Columbia University. Retrieved March 4, 2012.
- George Padgett (2006). New Directions in Diversity: A New Approach to Covering America's Multicultural Communities. Marion Street Press. p. 85. ISBN 978-1-933338-04-0.
T. Denean Sharpley-Whiting (September 2008). Pimps Up, Ho's Down: Hip Hop's Hold on Young Black Women. NYU Press. p. 159. ISBN 978-0-8147-4064-4.
Armas, Genaro C. (28 March 2018). "Black, Asian women with college degree outearn white women". Seattle Times. Retrieved 10 October 2018.A white male with a college diploma earns far more than any similarly educated man or woman — in excess of $66,000 a year, according to the Census Bureau. Among men with bachelor’s degrees, Asians earned more than $52,000 a year, Hispanics earned $49,000 and blacks earned more than $45,000.
- Median Earnings by Race/Ethnicity, Gender, and Education Level, 2008 (Report). College Board. 2009. Retrieved 31 October 2018.
- Jennifer Ma; Matea Pender; Meredith Welch (2016). Education Pages 2016: The Benefits of Higher Education for Individuals and Society (PDF) (Report). College Board. p. 21. Retrieved 31 October 2018.
- NW, 1615 L. St; Suite 800Washington; Inquiries, DC 20036USA202-419-4300 | Main202-857-8562 | Fax202-419-4372 | Media. "Racial, gender wage gaps persist in U.S. despite some progress". Pew Research Center. Retrieved 2019-05-04.
- Karen R. Hume; Nicholas A. Jones; Roberto R. Ramirez (March 2011). "Overview of Race and Hispanic Origin: 2010" (PDF). U.S. Census Bureau. U.S. Department of Commerce. Archived (PDF) from the original on 2 June 2011. Retrieved 31 May 2011.
Table 8. The Asian Population and Largest Multiple-Race Combinations by Hispanic or Latino Origin for the United States:2010. Asian Alone or in Combination/Hispanic or Latino/598,146/100.0/(X)
- "Overview of Race and Hispanic Origin: 2000" (PDF). U.S. Census Bureau.
- "B02018: Asian Alone or in Combination by Selected Groups". American Community Survey 1-Year Estimates. United States Census Bureau. 2017. Archived from the original on 11 April 2019. Retrieved 28 February 2020.
- "Language Use and English-Speaking Ability: 2000: Census 2000 Brief" (PDF). census.gov. Retrieved August 17, 2018.
- EAC Issues Glossaries of Election Terms in Five Asian Languages Translations to Make Voting More Accessible to a Majority of Asian American Citizens. Election Assistance Commission. June 20, 2008. (archived from the original on July 31, 2008)
- "Asian/Pacific American Heritage Month: May 2012". United States Census Bureau. United States Department of Commerce. March 21, 2012. Retrieved January 12, 2013.
- "Table 53. Languages Spoken At Home by Language: 2011" (PDF), Language use in the United States, August 2013, U.S. Census Bureau, archived from the original (PDF) on February 5, 2016, retrieved February 19, 2016
- "American FactFinder - Results". =U.S. Census Bureau. Archived from the original on February 12, 2020. Retrieved August 16, 2017.
- Timothy Pratt (October 18, 2012). "More Asian Immigrants Are Finding Ballots in Their Native Tongue". New York Times. Las Vegas. Retrieved January 12, 2013.
- Leslie Berestein Rojas (November 6, 2012). "Five new Asian languages make their debut at the polls". KPCC. Retrieved January 12, 2013.
- Shaun Tandon (January 17, 2013). "Half of Asian Americans rely on ethnic media: poll". Agence France-Presse. Retrieved January 25, 2013.
- Espinosa, Gastón (2008). Religion, race, and the American presidency. Lanham, Maryland: Rowman & Littlefield. p. 188. ISBN 978-0-7425-6321-6. Retrieved March 6, 2012.
Religions Asian Americans.
- Harvey, Paul (2012). The Columbia Guide to Religion in American History. Columbia University Press. p. 330. ISBN 978-0-231-14020-1. Retrieved March 6, 2012.
- Carnes, Tony; Yang, Fenggang (2004). Asian American religions: the making and remaking of borders and boundaries. New York University Press. p. 3. ISBN 978-0-8147-1630-4. Retrieved March 7, 2012.
- Kosmin, Barry Alexander; Keysar, Ariela (2006). Religion in a free market: religious and non-religious Americans, who, what, why, where. Ithaca, New York: Paramount Market Publishing. pp. 241–242. ISBN 978-0-9766973-6-7. Retrieved March 6, 2012.
Religions Asian Americans.
- Le, C.N. (2012). "Religion, Spirituality, and Faith". Asian-Nation.org. Retrieved March 6, 2012.
- Kosmin, Barry A.; Keysar, Ariela (March 2009). "American Religious Identification Survey (ARIS 2008)" (PDF). Institute for the Study of Secularism in Society & Culture. Trinity College. Retrieved March 6, 2012.
- Daniel Pipes; Khalid Durán (August 2002). "Muslim Immigrants in the United States". Center for Immigration Studies. Retrieved May 19, 2011.
Symbolic of this diversity, Los Angeles alone boasts such exotic food fare as the Chinese Islamic Restaurant and the Thai Islamic Restaurant.
- Syed, Farhan A. (2006). Integration and Isolation: A Comparative Study of Immigrant Muslims in the United States and the United Kingdom (PDF) (Master of Arts thesis). University of Pennsylvania. Archived from the original (PDF) on July 20, 2011. Retrieved May 19, 2011.
- Jones, Jeffrey M. (February 3, 2010). "Asian-Americans Lean Left Politically". Gallup. Retrieved March 6, 2012.
- "Asian Americans: A Mosaic of Faiths". The Pew Forum on Religion & Public Life. Pew Research Center. July 19, 2012. Retrieved August 12, 2012.
- Inc, Gallup (2018-05-22). "In U.S., Estimate of LGBT Population Rises to 4.5%". Gallup.com. Retrieved 2019-12-09.
- "Total Population: Asian Alone or in combination with one or more other races". 2010 Census Summary File 2. United States Census Bureau. Archived from the original on 14 February 2020. Retrieved 4 May 2019.
- "Total Population: Chinese alone or in any combination". 2010 Census Summary File 2. United States Census Bureau. Archived from the original on 14 February 2020. Retrieved 4 May 2019.
- "Total Population: Filipino alone or in any combination". 2010 Census Summary File 2. United States Census Bureau. Archived from the original on 12 February 2020. Retrieved 4 May 2019.
- "Total Population: Asian Indian alone or in any combination". 2010 Census Summary File 2. United States Census Bureau. Archived from the original on 14 February 2020. Retrieved 4 May 2019.
- "Total Population: Japanese alone or in any combination". 2010 Census Summary File 2. United States Census Bureau. Archived from the original on 14 February 2020. Retrieved 4 May 2019.
- "Total Population: Korean alone or in any combination". 2010 Census Summary File 2. United States Census Bureau. Archived from the original on 14 February 2020. Retrieved 4 May 2019.
- "Total Population: Vietnamese alone or in any combination". 2010 Census Summary File 2. United States Census Bureau. Archived from the original on 14 February 2020. Retrieved 4 May 2019.
- Brian Kao. "2012 Asian Pacific Town Hall" (PDF). Council on Asian Pacific Minnesotans. State of Minnesota. Retrieved September 11, 2012.
- https://factfinder.census.gov/faces/tableservices/jsf/pages/productview.xhtml?pid=DEC_10_ASSF_P3&prodType=table Archived 2020-02-14 at Archive.today American FactFinder. Ethnic Origin Or Race; 2010 American Samoa Summary File. Retrieved November 9, 2018.
- https://factfinder.census.gov/faces/tableservices/jsf/pages/productview.xhtml?pid=DEC_10_GUSF_P3&prodType=table Archived 2020-02-14 at Archive.today American FactFinder. Ethnic Origin Or Race; 2010 Guam Summary File. Retrieved November 9, 2018.
- https://factfinder.census.gov/faces/tableservices/jsf/pages/productview.xhtml?pid=DEC_10_MPSF_P3&prodType=table Archived 2020-02-14 at Archive.today American FactFinder. Ethnic Origin Or Race; 2010 Commonwealth of the Northern Mariana Islands Summary File. Retrieved November 9, 2018.
- https://factfinder.census.gov/faces/tableservices/jsf/pages/productview.xhtml?pid=DEC_10_VISF_P3&prodType=table Archived 2020-02-12 at Archive.today American FactFinder. Race; 2010 U.S. Virgin Islands Summary File. Retrieved November 9, 2018.
External links
- Asian-Nation Asian American Socioeconomic Statistics and Comparisons
- "Demographics of Asian Americans". Pew Research Social & Demographic Trends. Pew Research Center. 4 April 2013.
Asian Americans1, 2, 6 | ||
|---|---|---|
| Central Asian3 |
|  |
| East Asian | ||
| South Asian5 |
| |
| Southeast Asian |
| |
| Other |
| |
| History |
| |
| Topics |
| |
| Religion |
| |
| Regions |
| |
Notes 1 The U.S. Census Bureau definition of Asians refers to a person having origins in any of the original peoples of the Far East, Southeast Asia, or the Indian subcontinent. 2 The United States Government classified Kalmyks as Asian until 1951, when Kalmyk Americans were reclassified as White Americans. 3 Most Central Asians are classified as White Americans. 4 The U.S. Census Bureau reclassifies anyone identifying as "Tibetan American" as "Chinese American". 5 Bengali Americans may be classified as Bangladeshi or Indian. Punjabi Americans may be classified as Indian or Pakistani. 6 Those of West Asian extraction (i.e. the Middle East and the Caucasus) are classified as White under the U.S. Census. | ||
- Inc, Gallup (2018-05-22). "In U.S., Estimate of LGBT Population Rises to 4.5%". Gallup.com. Retrieved 2019-12-09.