Demographics of the United States
The United States is the third-most populous country in the world, with an estimated population of 329,227,746 as of January 28, 2020.[5] The United States Census Bureau shows a population increase of 0.75% for the twelve-month period ending in July 2012. Though high by industrialized country standards, this is below the world average annual rate of 1.1%.[6] The total fertility rate in the United States estimated for 2018 is 1.73 children per woman,[7][8] which is below the replacement fertility rate of approximately 2.1.
| Demographics of the United States | |
|---|---|
| Population | 308,745,538 (2010 Census[lower-alpha 1]) (3rd) • Estimate 329,968,629 (2019) (3rd) |
| Density | 86.16/sq mi (33.27/km2) |
| Growth rate | |
| Birth rate | 11.6 births/1,000 population (2020)[1] |
| Death rate | 8.9 deaths/1,000 population (2020)[1] |
| Life expectancy | 78.7 years (2018)[2] |
| • male | 76.2 years |
| • female | 81.2 years |
| Fertility rate | 1.72 children born/woman (2020)[1] |
| Net migration rate | 3 migrant(s)/1,000 population (2020)[1] |
| Age structure | |
| Under 18 years | 24.0% (2010)[3] |
| 18–44 years | 36.5% (2010)[3] |
| 45–64 years | 26.4% (2010)[3] |
| 65 and over | 13.0% (2010)[3] |
| Language | |
| Official | No official language at national level. English is designated official in 32 of 50 states, plus Hawaiian in Hawaii, 20 native languages in Alaska, and Sioux in South Dakota[4] |
| Spoken |
|
| Source: The World Factbook[1] | |
The American population almost quadrupled during the 20th century—at a growth rate of about 1.3% a year—from about 76 million in 1900 to 281 million in 2000. It is estimated to have reached the 200 million mark in 1967, and the 300 million mark on October 17, 2006.[9][10] Population growth is fastest among minorities as a whole, and according to the Census Bureau's estimation for 2012, 50.4% of American children under the age of 1 belonged to racial and ethnic minority groups.[11]
White people constitute the majority of the U.S. population, with a total of about 234,370,202 or 73% of the population as of 2017.[12] Non-Hispanic Whites make up 60.7% of the country's population, though some Latin Americans consider themselves to be fully white on the Census.[12] When this is taken into account, white Americans with no Latin American ancestry make up 52.7% of the population.[13] The non-Hispanic white population of the U.S. is expected to fall below 50% by 2045, primarily due to immigration and low birth rates.[14]
Hispanic and Latino Americans accounted for 48% of the national population growth of 2.9 million between July 1, 2005, and July 1, 2006.[15] Immigrants and their U.S.-born descendants are expected to provide most of the U.S. population gains in the decades ahead.[16]
The Census Bureau projects a U.S. population of 417 million in 2060, a 38% increase from 2007 (301.3 million),[17] and the United Nations estimates the U.S. population will be 402 million in 2050, an increase of 32% from 2007.[18] In an official census report, it was reported that 54.4% (2,150,926 out of 3,953,593) of births in 2010 were non-Hispanic white. This represents an increase of 0.3% compared to the previous year, which was 54.1%.[19]
Population
.jpg)
As of November 8, 2018, the United States is estimated to have a population of 328,953,020.
The following demographic statistics are from the CIA World Factbook estimated as of 2018,[1] unless otherwise indicated.
Structure
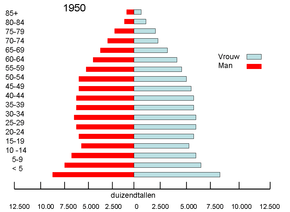
The median age of the total population is 38.2 years; the male median age is 36.9 years; the female median age is 39.5 years.
The population is distributed by age as follows:
- 0–14 years: 18.62% (male 31,255,995/female 29,919,938)
- 15–24 years: 13.12% (male 22,213,952/female 21,137,826)
- 25–54 years: 39.29% (male 64,528,673/female 64,334,499)
- 55–64 years: 12.94% (male 20,357,880/female 21,821,976)
- 65 years and over: 16.03% (male 22,678,235/female 28,376,817)
Sex ratios:
- 0–14 years: 1.04 male/female
- 15–24 years: 1.05 male/female
- 25–54 years: 1 male/female
- 55–64 years: 0.93 male/female
- 65 years and over: 0.79 male/female
- Total population: 0.97 male/female
Birth rate
- 12.4 births/1,000 population (2018 est.) Country comparison to the world: 157th
Death rate
- 8.2 deaths/1,000 population (2018 est.) Country comparison to the world: 86th
Total fertility rate
- 1.73 children born/woman (2018 est.)
Mother's mean age at first birth
- 26.4 years (2015 est.)
Life expectancy
- Total population: 78.6 years for a child born in 2017.[23]
- Male: 77.8 years
- Female: 82.3 years
The average life expectancy in the United States has been on a decline since 2014. The Centers for Disease Control and Prevention cites three main reasons: a 72% increase in overdoses in the last decade (including a 30% increase in opioid overdoses from July 2016 to September 2017, but did not differentiate between accidental overdose with a legal prescription and overdose with opioids obtained illegally and/or combined with illegal drugs i.e., heroin, cocaine, methamphetamine, etc), a ten-year increase in liver disease (men 25 to 34 increased by 8%; women by 11%), and a 33% increase in suicide rates since 1999.[23]
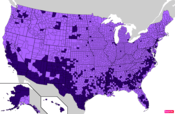
Density
The most densely populated state is New Jersey (1,121/mi2 or 433/km2).
The population is highly urbanized, with 82.3% of the population residing in cities and suburbs.[1] Large urban clusters are spread throughout the eastern half of the United States (particularly the Great Lakes area, northeast, east, and southeast) and the western tier states; mountainous areas, principally the Rocky Mountains and Appalachian chain, deserts in the southwest, the dense boreal forests in the extreme north, and the central prairie states are less densely populated; Alaska's population is concentrated along its southern coast – with particular emphasis on the city of Anchorage – and Hawaii's is centered on the island of Oahu.[1] California and Texas are the most populous states, as the mean center of U.S. population has consistently shifted westward and southward.[24][25] New York City is the most populous city in the United States.[26]
Growth
- Population growth rate: 0.8%. Country comparison to the world: 130th
Births and fertility by race
American-born people
Note: Hispanics are counted both by their ethnicity and by their race, giving a higher overall number. Also note that growth arrows indicate an increase or decrease in the number of births, not in the fertility rate.[27][28][29]
| Race of mother | Number of births in 2014 |
% of all born |
TFR (2014) |
Number of births in 2015 |
% of all born |
TFR (2015) |
Number of births in 2016 |
% of all born |
TFR (2016) |
Number of births in 2017 |
% of all born |
TFR (2017) |
|
|---|---|---|---|---|---|---|---|---|---|---|---|---|---|
| White | 75.72% | 1.876 | 75.73% | 1.864 | |||||||||
| > Non-Hispanic whites | 53.89% | 1.763 | 53.54% | 1.746 | 52.11% | 1.719 | 51.68% | 1.666 | |||||
| Black | 16.06% | 1.872 | 16.09% | 1.853 | |||||||||
| > Non-Hispanic blacks | 14.77% | 1.874 | 14.80% | 1.857 | 14.16% | 1.832 | 14.54% | 1.824 | |||||
| Asian (incl. Pacific islander until 2015) | 7.09% | 1.715 | 7.07% | 1.646 | 6.45% | 1.690 | 6.46% | 1.597 | |||||
| Native (incl. Alaska native) | 1.13% | 1.289 | 1.11% | 1.263 | 0.80% | 1.794 | 0.78% | 1.702 | |||||
| Hawaiian (incl. other Pacific Islander) | 0.23% | 2.076 | 0.24% | 2.085 | |||||||||
| Total | 100% | 1.862 | 100% | 1.843 | 100% | 1.820 | 100% | 1.765 |
NOTE:
- TFR = Total fertility rate (number of children born per woman).
- Growth arrows indicate an increase or decrease in the number of births, not in the fertility rate.
| Ethnicity of mother | Number of births in 2014 |
TFR (2014) |
Number of births in 2015 |
TFR (2015) |
Number of births in 2016 |
TFR (2016) |
Number of births in 2017 |
TFR (2017) |
|
|---|---|---|---|---|---|---|---|---|---|
| Non-Hispanic (of any race) | 1.793 | 1.770 | |||||||
| Hispanic (of any race) | 2.131 | 2.124 | 2.092 | 2.006 |
| Race | 2008 | 2011 | 2013 |
|---|---|---|---|
| White | 2.29 | 2.01 | 1.94 |
| Black | 2.51 | 2.57 | 2.35 |
| Asian | 2.25 | 2.02 | 1.93 |
| Other | 1.80 | 2.04 | 2.06 |
| Hispanic (of any race) | 3.15 | 2.77 | 2.46 |
| Total | 2.75 | 2.45 | 2.22 |
Immigration
- Net migration rate: 3.8 migrants/1,000 population (2018 est.) Country comparison to the world: 35th
- Net migration rate: 3.9 migrants/1,000 population (2017 est.)
As of 2017, 13.6% (44.4 million) of the population was foreign born – an increase from 4.7% in 1970 but less than the 1890 record of 14.8%. 45% of the foreign born population were naturalized US citizens. 23% (10.3 million) of the foreign born community is undocumented, accounting for 3.2% of the total population.[31] According to the 2010 census, Latin America and the Caribbean is the largest region-of-birth group, accounting for 53% of the foreign born population. As of 2018 this region is still the largest source of immigrants to the United States[32][33][34] In 2018, there were almost 90 million immigrants and U.S. born children of immigrants (second-generation Americans) in the United States, accounting for 28% of the overall U.S. population.[35] In 2018, 1,096,611 immigrants were granted either permanent or temporary legal residence in the United States[36]
| Country | 2018 |
|---|---|
| Mexico | 160,132 |
| Cuba | 75,159 |
| China | 61,848 |
| Dominican Republic | 57,286 |
| India | 56,761 |
| Philippines | 44,776 |
| Vietnam | 33,236 |
| El Salvador | 22,884 |
| Haiti | 21,091 |
| Jamaica | 19,986 |
| Region | 2018 |
|---|---|
| Asia | 383,145 |
| Americas | 489,291 |
| Africa | 112,745 |
| Europe | 85,486 |
| Oceania | 5,422 |
| Not Specified | 20,522 |
| Total | 1,096,611 |
| Class of Admission (Adjustments of Status and New Arrivals) | 2018 |
|---|---|
| Immediate relatives of U.S. citizens | 478,961 |
| Family-sponsored preferences | 216,563 |
| Employment-based preferences | 138,171 |
| Diversity | 45,350 |
| Refugees | 155,734 |
| Asylees | 30,175 |
| Parolees | 14 |
| Children born abroad to alien residents | 69 |
| Certain Iraqis and Afghans employed by U.S. Government and their spouses and children | 10,297 |
| Cancellation of removal | 4,421 |
| Victims of human trafficking | 1,208 |
| Victims of crimes and their spouses and children | 15,012 |
| Other | 636 |
Vital statistics
Vital statistics from 1935
| Average population[38] | Live births[39] | Deaths | Natural change | Crude birth rate (per 1,000) | Crude death rate (per 1,000)[40] | Natural change (per 1,000) | Total fertility rate[fn 1][41] | |
|---|---|---|---|---|---|---|---|---|
| 1935 | 127,362,000 | 2,377,000 | 1,392,752 | 984,248 | 18.7 | 10.9 | 7.7 | 2.19 |
| 1936 | 128,181,000 | 2,355,000 | 1,479,228 | 875,772 | 18.4 | 11.5 | 6.8 | 2.15 |
| 1937 | 128,961,000 | 2,413,000 | 1,450,427 | 962,573 | 18.7 | 11.2 | 7.5 | 2.17 |
| 1938 | 129,969,000 | 2,496,000 | 1,381,391 | 1,114,609 | 19.2 | 10.6 | 8.6 | 2.22 |
| 1939 | 131,028,000 | 2,466,000 | 1,387,897 | 1,078,103 | 18.8 | 10.6 | 8.2 | 2.17 |
| 1940 | 132,165,000 | 2,559,000 | 1,417,269 | 1,142,000 | 19.4 | 10.8 | 8.6 | 2.301 |
| 1941 | 133,002,000 | 2,703,000 | 1,397,642 | 1,305,358 | 20.3 | 10.5 | 9.8 | 2.399 |
| 1942 | 134,464,000 | 2,989,000 | 1,385,187 | 1,603,813 | 22.2 | 10.3 | 11.9 | 2.628 |
| 1943 | 136,003,000 | 3,104,000 | 1,459,544 | 1,644,306 | 22.8 | 10.7 | 12.1 | 2.718 |
| 1944 | 138,083,000 | 2,939,000 | 1,411,338 | 1,644,456 | 21.2 | 10.2 | 11.0 | 2.568 |
| 1945 | 139,994,000 | 2,858,000 | 1,401,719 | 1,456,281 | 20.4 | 10.0 | 10.4 | 2.491 |
| 1946 | 140,008,000 | 3,411,000 | 1,395,617 | 2,015,383 | 24.1 | 10.0 | 14.1 | 2.943 |
| 1947 | 145,023,000 | 3,817,000 | 1,445,370 | 2,371,630 | 26.6 | 10.0 | 16.6 | 3.274 |
| 1948 | 148,013,000 | 3,637,000 | 1,444,337 | 2,192,663 | 24.9 | 9.8 | 15.1 | 3.109 |
| 1949 | 149,336,000 | 3,649,000 | 1,443,607 | 2,205,393 | 24.5 | 9.7 | 14.8 | 3.110 |
| 1950 | 151,861,000 | 3,632,000 | 1,452,454 | 2,180,000 | 24.1 | 9.6 | 14.5 | 3.091 |
| 1951 | 154,056,000 | 3,823,000 | 1,482,099 | 2,340,901 | 24.8 | 9.6 | 15.2 | 3.269 |
| 1952 | 156,431,000 | 3,913,000 | 1,496,838 | 2,416,162 | 25.0 | 9.6 | 15.4 | 3.358 |
| 1953 | 159,047,000 | 3,965,000 | 1,447,459 | 2,517,541 | 25.2 | 9.1 | 16.1 | 3.424 |
| 1954 | 161,948,000 | 4,078,000 | 1,481,091 | 2,596,909 | 24.8 | 9.3 | 15.5 | 3.543 |
| 1955 | 163,476,000 | 4,097,000 | 1,528,717 | 2,568,283 | 25.0 | 9.3 | 14.3 | 3.580 |
| 1956 | 166,578,000 | 4,218,000 | 1,564,476 | 2,653,524 | 25.1 | 9.3 | 15.8 | 3.689 |
| 1957 | 169,637,000 | 4,308,000 | 1,633,128 | 2,666,872 | 25.3 | 9.5 | 15.8 | 3.767 |
| 1958 | 172,668,000 | 4,255,000 | 1,647,886 | 2,607,114 | 24.4 | 9.5 | 14.9 | 3.701 |
| 1959 | 175,642,000 | 4,244,796 | 1,656,814 | 2,587,982 | 24.0 | 9.4 | 14.7 | 3.670 |
| 1960 | 179,979,000 | 4,257,850 | 1,711,982 | 2,545,868 | 23.7 | 9.5 | 14.1 | 3.654 |
| 1961 | 182,992,000 | 4,268,326 | 1,701,522 | 2,566,804 | 23.3 | 9.3 | 14.0 | 3.629 |
| 1962 | 185,771,000 | 4,167,362 | 1,756,720 | 2,410,642 | 22.4 | 9.5 | 12.9 | 3.474 |
| 1963 | 188,483,000 | 4,098,020 | 1,813,549 | 2,284,471 | 21.7 | 9.6 | 12.1 | 3.333 |
| 1964 | 191,141,000 | 4,027,490 | 1,798,051 | 2,229,439 | 21.1 | 9.4 | 11.7 | 3.208 |
| 1965 | 193,526,000 | 3,760,358 | 1,828,136 | 1,932,222 | 19.4 | 9.5 | 9.9 | 2.928 |
| 1966 | 195,576,000 | 3,606,274 | 1,863,149 | 1,743,125 | 18.4 | 9.5 | 8.9 | 2.736 |
| 1967 | 197,457,000 | 3,520,959 | 1,851,323 | 1,669,636 | 17.8 | 9.4 | 8.4 | 2.578 |
| 1968 | 199,399,000 | 3,501,564 | 1,930,082 | 1,571,482 | 17.6 | 9.7 | 7.9 | 2.477 |
| 1969 | 201,385,000 | 3,600,206 | 1,921,990 | 1,678,216 | 17.9 | 9.5 | 8.4 | 2.465 |
| 1970 | 203,984,000 | 3,731,386 | 1,921,031 | 1,810,355 | 18.4 | 9.4 | 9.0 | 2.480 |
| 1971 | 206,827,000 | 3,555,970 | 1,927,542 | 1,628,428 | 17.2 | 9.3 | 7.9 | 2.266 |
| 1972 | 209,284,000 | 3,258,411 | 1,963,944 | 1,294,467 | 15.6 | 9.4 | 6.2 | 2.010 |
| 1973 | 211,357,000 | 3,136,965 | 1,973,003 | 1,163,962 | 14.8 | 9.5 | 5.3 | 1.879 |
| 1974 | 213,342,000 | 3,159,958 | 1,934,388 | 1,225,570 | 14.8 | 9.1 | 5.7 | 1.835 |
| 1975 | 215,465,000 | 3,144,198 | 1,892,879 | 1,251,319 | 14.6 | 8.8 | 5.8 | 1.774 |
| 1976 | 217,563,000 | 3,167,788 | 1,909,440 | 1,258,348 | 14.6 | 8.8 | 5.8 | 1.738 |
| 1977 | 219,760,000 | 3,326,632 | 1,899,597 | 1,427,035 | 15.1 | 8.6 | 6.5 | 1.789 |
| 1978 | 222,095,000 | 3,333,279 | 1,927,788 | 1,405,491 | 15.0 | 8.7 | 6.3 | 1.760 |
| 1979 | 224,567,000 | 3,494,398 | 1,913,841 | 1,580,557 | 15.6 | 8.5 | 7.1 | 1.808 |
| 1980 | 227,225,000 | 3,612,258 | 1,989,841 | 1,622,417 | 15.9 | 8.8 | 7.1 | 1.839 |
| 1981 | 229,466,000 | 3,629,238 | 1,977,981 | 1,651,257 | 15.8 | 8.6 | 7.2 | 1.812 |
| 1982 | 231,664,000 | 3,680,537 | 1,974,797 | 1,705,740 | 15.9 | 8.5 | 7.4 | 1.827 |
| 1983 | 233,792,000 | 3,638,933 | 2,019,201 | 1,619,732 | 15.6 | 8.6 | 6.9 | 1.799 |
| 1984 | 235,825,000 | 3,669,141 | 2,039,369 | 1,629,772 | 15.6 | 8.6 | 6.9 | 1.806 |
| 1985 | 237,924,000 | 3,760,561 | 2,086,440 | 1,674,121 | 15.8 | 8.8 | 7.0 | 1.844 |
| 1986 | 240,133,000 | 3,756,547 | 2,105,361 | 1,651,186 | 15.6 | 8.8 | 6.9 | 1.837 |
| 1987 | 242,289,000 | 3,809,394 | 2,123,323 | 1,686,071 | 15.7 | 8.8 | 7.0 | 1.872 |
| 1988 | 244,499,000 | 3,909,510 | 2,167,999 | 1,741,511 | 16.0 | 8.9 | 7.1 | 1.934 |
| 1989 | 246,819,000 | 4,040,958 | 2,150,466 | 1,890,492 | 16.4 | 8.7 | 7.7 | 2.014 |
| 1990 | 249,623,000 | 4,158,212 | 2,148,463 | 2,009,749 | 16.7 | 8.6 | 8.1 | 2.081 |
| 1991 | 252,981,000 | 4,110,907 | 2,169,518 | 1,941,389 | 16.2 | 8.6 | 7.7 | 2.062 |
| 1992 | 256,514,000 | 4,065,014 | 2,175,613 | 1,889,401 | 15.8 | 8.5 | 7.4 | 2.046 |
| 1993 | 259,919,000 | 4,000,240 | 2,268,553 | 1,731,687 | 15.4 | 8.7 | 6.7 | 2.019 |
| 1994 | 263,126,000 | 3,952,767 | 2,278,994 | 1,673,773 | 15.0 | 8.7 | 6.4 | 2.001 |
| 1995 | 266,278,000 | 3,899,589 | 2,312,132 | 1,587,457 | 14.6 | 8.7 | 6.0 | 1.978 |
| 1996 | 269,394,000 | 3,891,494 | 2,314,690 | 1,576,804 | 14.4 | 8.6 | 5.9 | 1.976 |
| 1997 | 272,647,000 | 3,880,894 | 2,314,245 | 1,566,649 | 14.2 | 8.5 | 5.7 | 1.971 |
| 1998 | 275,854,000 | 3,941,553 | 2,337,256 | 1,604,297 | 14.3 | 8.5 | 5.8 | 1.999 |
| 1999 | 279,040,000 | 3,959,417 | 2,391,399 | 1,568,018 | 14.2 | 8.6 | 5.6 | 2.007 |
| 2000 | 282,172,000 | 4,058,814 | 2,403,351 | 1,655,463 | 14.4 | 8.5 | 5.9 | 2.056 |
| 2001 | 285,082,000 | 4,025,933 | 2,416,425 | 1,609,508 | 14.1 | 8.5 | 5.6 | 2.030 |
| 2002 | 287,804,000 | 4,021,726 | 2,443,387 | 1,578,339 | 14.0 | 8.5 | 5.5 | 2.020 |
| 2003 | 290,326,000 | 4,089,950 | 2,448,288 | 1,641,662 | 14.1 | 8.4 | 5.5 | 2.047 |
| 2004 | 293,046,000 | 4,112,052 | 2,397,615 | 1,714,437 | 14.0 | 8.2 | 5.9 | 2.051 |
| 2005 | 295,753,000 | 4,138,349 | 2,448,017 | 1,690,332 | 14.0 | 8.3 | 5.7 | 2.057 |
| 2006 | 298,593,000 | 4,265,555 | 2,426,264 | 1,839,291 | 14.3 | 8.1 | 6.2 | 2.108 |
| 2007 | 301,580,000 | 4,316,234 | 2,423,712 | 1,892,522 | 14.3 | 8.0 | 6.3 | 2.120 |
| 2008 | 304,375,000 | 4,247,694 | 2,471,984 | 1,775,710 | 14.0 | 8.1 | 5.9 | 2.072 |
| 2009 | 307,007,000 | 4,130,665 | 2,437,163 | 1,693,502 | 13.5 | 7.9 | 5.6 | 2.002 |
| 2010 | 309,330,000 | 3,999,386 | 2,468,435 | 1,530,951 | 13.0 | 8.0 | 5.0 | 1.931 |
| 2011 | 311,583,000 | 3,953,590 | 2,515,458 | 1,438,412 | 12.7 | 8.1 | 4.6 | 1.894 |
| 2012 | 313,874,000 | 3,952,841 | 2,543,279 | 1,409,562 | 12.6 | 8.1 | 4.5 | 1.880 |
| 2013 | 316,129,000 | 3,932,181 | 2,596,993 | 1,336,183 | 12.4 | 8.2 | 4.2 | 1.857 |
| 2014 | 319,113,000 | 3,988,076 | 2,626,418 | 1,361,658 | 12.5 | 8.2 | 4.3 | 1.862 |
| 2015 | 321,442,000 | 3,978,497 | 2,712,630 | 1,265,867 | 12.4 | 8.4 | 4.0 | 1.843 |
| 2016 | 323,100,000 | 3,945,875 | 2,744,248 | 1,201,627 | 12.2 | 8.5 | 3.7 | 1.820 |
| 2017 | 325,719,000 | 3,855,500[8] | 2,813,503[42] | 1,041,997 | 11.8 | 8.7 | 3.1 | 1.765 |
| 2018 | 327,167,000 | 3,791,712[43] | 2,839,205[44] | 952,507 | 11.6 | 8.7 | 2.9 | 1.729 |
Current vital statistics
Number of births :
- from January–March 2018 =

- from January–March 2019 =
Number of deaths :
- from January–March 2018 =

- from January–March 2019 =

Natural increase :
- from January–March 2018 =
- from January–March 2019 =

Historical data
| Historical population | |||
|---|---|---|---|
| Census | Pop. | %± | |
| 1790 | 3,929,214 | — | |
| 1800 | 5,236,631 | 33.3% | |
| 1810 | 7,239,881 | 38.3% | |
| 1820 | 9,638,453 | 33.1% | |
| 1830 | 12,866,020 | 33.5% | |
| 1840 | 17,069,453 | 32.7% | |
| 1850 | 23,191,876 | 35.9% | |
| 1860 | 31,443,321 | 35.6% | |
| 1870 | 38,558,371 | 22.6% | |
| 1880 | 49,371,340 | 28.0% | |
| 1890 | 62,979,766 | 27.6% | |
| 1900 | 76,212,168 | 21.0% | |
| 1910 | 92,228,531 | 21.0% | |
| 1920 | 106,021,568 | 15.0% | |
| 1930 | 123,202,660 | 16.2% | |
| 1940 | 132,165,129 | 7.3% | |
| 1950 | 151,325,798 | 14.5% | |
| 1960 | 179,323,175 | 18.5% | |
| 1970 | 203,211,926 | 13.3% | |
| 1980 | 226,545,805 | 11.5% | |
| 1990 | 248,709,873 | 9.8% | |
| 2000 | 281,421,906 | 13.2% | |
| 2010 | 308,745,538 | 9.7% | |
| Est. 2020 | 329,545,453 | 6.7% | |
| Sources: United States Census Bureau[46][47][48] 2020 data (as of population clock)[5] Note that the census numbers do not include American Indian natives before 1860. | |||
In 1900, when the U.S. population was 76 million, there were 66.8 million Whites in the United States, representing 88% of the total population,[49] 8.8 million Black Americans, with about 90% of them still living in Southern states,[50] and slightly more than 500,000 Hispanics.[51]
Under the law, the Immigration and Nationality Act of 1965,[52] the number of first-generation immigrants living in the United States has increased,[53] from 9.6 million in 1970 to about 38 million in 2007.[54] Around a million people legally immigrated to the United States per year in the 1990s, up from 250,000 per year in the 1950s.[55]
In 1900, non-Hispanic whites comprised almost 97% of the population of the 10 largest American cities.[56] The Census Bureau reported that minorities (including Hispanic whites) made up 50.4% of the children born in the U.S. between July 2010 and July 2011,[57] compared to 37% in 1990.[58]
In 2010, the state with the lowest fertility rate was Rhode Island, with a rate of 1.63, while Utah had the greatest rate with a rate of 2.45.[19] This correlates with the ages of the states' populations: Rhode Island has the ninth-oldest median age in the US—39.2—while Utah has the youngest—29.0.[59]
In 2017, the U.S. birth rate remains well below the replacement level needed – at least 2.1 children per woman so as not to experience population decreases – as White American births fell in all 50 states and the District of Columbia. Among non-Hispanic white women, no states had a fertility rate above the replacement level. Among non-Hispanic black women, 12 states reached above the replacement level needed. Among Hispanic women, 29 states did.[60] For non-Hispanic white women, the highest total fertility rate was in Utah, at 2.099, and the lowest in the District of Columbia, at 1.012. Among non-Hispanic black women, the highest total fertility rate was in Maine, at 4.003, and the lowest in Wyoming, at 1.146. For Hispanic women, the highest total fertility rate was in Alabama, at 3.085, and the lowest in Vermont, at 1.200, and Maine, at 1.281.[60][61] Due to the aging and low birth rates among white people, deaths now outnumber births among white people (non-Hispanic) in more than half the states in the country.[62]
In 2018, U.S. births fell to the lowest level in 32 years.[63]
Median age of the population
Median age of the U.S. population through history. Source: U.S. Department of Commerce. Bureau of Census, United States Census Bureau and The World Factbook.[41][64]
| Years | 1820 | 1830 | 1840 | 1850 | 1860 | 1870 | 1880 | 1890 | 1900 |
|---|---|---|---|---|---|---|---|---|---|
| Median age of the total population | 16.7 | 17.2 | 17.8 | 18.9 | 19.4 | 20.2 | 20.9 | 22.0 | 22.9 |
| Median age of males | 16.6 | 17.2 | 17.9 | 19.2 | 19.8 | 20.2 | 21.2 | 22.3 | 23.3 |
| Median age of females | 16.8 | 17.3 | 17.8 | 18.6 | 19.1 | 20.1 | 20.7 | 21.6 | 22.4 |
| Years | 1910 | 1920 | 1930 | 1940 | 1950 | 1960 | 1970 | 1980 | 1990 | 2000 | 2010 | 2018 |
|---|---|---|---|---|---|---|---|---|---|---|---|---|
| Median age of the total population | 24.1 | 25.3 | 26.5 | 29.0 | 30.2 | 29.6 | 28.1 | 30.0 | 32.9 | 35.3 | 37.2 | 38.2 |
| Median age of males | 24.6 | 25.8 | 26.7 | 29.1 | 29.9 | 28.7 | 26.8 | 28.8 | 31.7 | 34.0 | 35.8 | 36.9 |
| Median age of females | 23.5 | 24.7 | 25.2 | 29.0 | 30.5 | 30.4 | 29.8 | 31.2 | 34.1 | 36.5 | 38.5 | 39.5 |
Vital statistics
The U.S. total fertility rate as of 2018 is 1.728:
- 1.86 for White Americans (including White Hispanics)
- 1.64 for non-Hispanic Whites
- 1.79 for non-Hispanic Blacks
- 1.65 for Native Americans (including Hispanics)
- 1.53 for Asian Americans (including Hispanics)
Other:[27]
- 1.96 for Hispanics (of all racial groups)
(Note that ≈95% of Hispanics are included as "white Hispanics" by CDC, which does not recognize the Census's "Some other race" category and counts people in that category as white.)
Source: National Vital statistics report based on 2010 US Census data[19]
Total Fertility Rates from 1800 to 2010
The total fertility rate is the number of children born per woman. Sources: Ansley J. Coale, Zelnik and National Center for Health Statistics.[65]
| Years | 1800 | 1810 | 1820 | 1830 | 1840 | 1850 | 1860 | 1870 | 1880 | 1890 | 1900[65] |
|---|---|---|---|---|---|---|---|---|---|---|---|
| Total Fertility Rate in the United States | 7.0 | 6.9 | 6.7 | 6.6 | 6.1 | 5.4 | 5.2 | 4.6 | 4.2 | 3.9 | 3.6 |
| Years | 1910 | 1920 | 1930 | 1940 | 1950 | 1960 | 1970 | 1980 | 1990 | 2000 | 2010[65] |
|---|---|---|---|---|---|---|---|---|---|---|---|
| Total Fertility Rate in the United States | 3.4 | 3.2 | 2.5 | 2.2 | 3.0 | 3.5 | 2.5 | 1.8 | 2.08 | 2.06 | 1.93 |
Life expectancy at birth from 1901 to 2015
Life expectancy in the United States from 1901 to 2015. Source: Our World In Data and the United Nations.
1901–1950
| Years | 1901 | 1902 | 1903 | 1904 | 1905 | 1906 | 1907 | 1908 | 1909 | 1910[66] |
|---|---|---|---|---|---|---|---|---|---|---|
| Life expectancy in the United States | 49.3 | 50.5 | 50.6 | 49.6 | 50.3 | 50.2 | 50.1 | 51.9 | 52.8 | 51.8 |
| Years | 1911 | 1912 | 1913 | 1914 | 1915 | 1916 | 1917 | 1918 | 1919 | 1920[66] |
|---|---|---|---|---|---|---|---|---|---|---|
| Life expectancy in the United States | 53.4 | 54.1 | 53.5 | 54.6 | 55.1 | 54.2 | 54.0 | 47.0 | 55.3 | 55.4 |
| Years | 1921 | 1922 | 1923 | 1924 | 1925 | 1926 | 1927 | 1928 | 1929 | 1930[66] |
|---|---|---|---|---|---|---|---|---|---|---|
| Life expectancy in the United States | 58.2 | 58.1 | 57.5 | 58.5 | 58.5 | 57.9 | 59.4 | 58.3 | 58.5 | 59.6 |
| Years | 1931 | 1932 | 1933 | 1934 | 1935 | 1936 | 1937 | 1938 | 1939 | 1940[66] |
|---|---|---|---|---|---|---|---|---|---|---|
| Life expectancy in the United States | 60.3 | 61.0 | 60.9 | 60.2 | 60.9 | 60.4 | 61.1 | 62.4 | 63.1 | 63.2 |
| Years | 1941 | 1942 | 1943 | 1944 | 1945 | 1946 | 1947 | 1948 | 1949 | 1950[66] |
|---|---|---|---|---|---|---|---|---|---|---|
| Life expectancy in the United States | 63.8 | 64.6 | 64.3 | 65.1 | 65.6 | 66.3 | 66.7 | 67.3 | 67.6 | 68.1 |
1950–2015
| Period | Life expectancy in Years |
Period | Life expectancy in Years |
|---|---|---|---|
| 1950–1955 | 68.7 | 1985–1990 | 74.9 |
| 1955–1960 | 69.7 | 1990–1995 | 75.7 |
| 1960–1965 | 70.1 | 1995–2000 | 76.5 |
| 1965–1970 | 70.4 | 2000–2005 | 77.2 |
| 1970–1975 | 71.4 | 2005–2010 | 78.2 |
| 1975–1980 | 73.3 | 2010–2015 | 78.9 |
| 1980–1985 | 74.4 | 2015-2020 | 78.8 |
Source: UN World Population Prospects[67]
Percent distribution of the total population by age: 1900 to 2015
Sources: U.S. Census Bureau, U.S. Department of Commerce, United Nations medium variant projections.[68][69]
| Ages | 1900 | 1910 | 1920 | 1930 | 1940 | 1950 | 1960 | 1970 | 1980 | 1990 | 2000 | 2010 | 2015 |
|---|---|---|---|---|---|---|---|---|---|---|---|---|---|
| 0–14 years | 34.5 | 32.1 | 31.8 | 29.4 | 25.0 | 26.9 | 31.1 | 28.5 | 22.6 | 21.5 | 21.4 | 20.2 | 19.8 |
| 15–24 years | 19.6 | 19.7 | 17.7 | 18.3 | 18.2 | 14.7 | 13.4 | 17.4 | 18.8 | 14.8 | 13.9 | ||
| 25–44 years | 28.1 | 29.2 | 29.6 | 29.5 | 30.1 | 30.0 | 26.2 | 23.6 | 27.7 | 32.5 | 30.2 | ||
| 45–64 years | 13.7 | 14.6 | 16.1 | 17.5 | 19.8 | 20.3 | 20.1 | 20.6 | 19.6 | 18.6 | 22.0 | ||
| 65 years and over | 4.1 | 4.3 | 4.7 | 5.4 | 6.8 | 8.1 | 9.2 | 9.9 | 11.3 | 12.6 | 12.4 | 13.0 | 14.3 |
| Total (%) | 100 | 100 | 100 | 100 | 100 | 100 | 100 | 100 | 100 | 100 | 100 | 33.2 | 34.1 |
Population centers
The United States has dozens of major cities, including 31 "global cities"[70] of all types, with 10 in the "alpha" group of global cities: New York, Los Angeles, Chicago, Washington, D.C., Boston, San Francisco, Miami, Philadelphia, Dallas, and Atlanta.[71] As of 2011, the United States had 51 metropolitan areas with a population of over 1,000,000 people each. (See Table of United States Metropolitan Statistical Areas.)
As of 2011, about 250 million Americans live in or around urban areas. That means more than three-quarters of the U.S. population shares just about three percent of the U.S. land area.[72]
The following table shows the populations of the top twenty metropolitan areas. Note Denver and Baltimore have over 2.5 million residents in their metro areas.
| Leading population centers (see complete list) | |||||||
|---|---|---|---|---|---|---|---|
| Rank | Core city (cities) | Metro area population | Metropolitan Statistical Area | Region[73] |  New York  Los Angeles  Chicago  Dallas | ||
| 1 | New York | 19,979,477 | New York–Newark–Jersey City, NY–NJ–PA MSA | Northeast | |||
| 2 | Los Angeles | 13,291,486 | Los Angeles–Long Beach–Anaheim, CA MSA | West | |||
| 3 | Chicago | 9,498,716 | Chicago–Joliet–Naperville, IL–IN–WI MSA | Midwest | |||
| 4 | Dallas–Fort Worth | 7,539,711 | Dallas–Fort Worth–Arlington, TX MSA | South | |||
| 5 | Houston | 6,997,384 | Houston–The Woodlands-Sugar Land MSA | South | |||
| 6 | Washington, D.C. | 6,249,950 | Washington, D.C.–VA–MD–WV MSA | South | |||
| 7 | Miami | 6,198,782 | Miami–Fort Lauderdale–West Palm Beach, FL MSA | South | |||
| 8 | Philadelphia | 6,096,372 | Philadelphia–Camden–Wilmington, PA–NJ–DE–MD MSA | Northeast | |||
| 9 | Atlanta | 5,949,951 | Atlanta–Sandy Springs–Roswell, GA MSA | South | |||
| 10 | Boston | 4,875,390 | Boston–Cambridge–Quincy, MA–NH MSA | Northeast | |||
| 11 | Phoenix | 4,857,962 | Phoenix–Mesa–Chandler, AZ MSA | West | |||
| 12 | San Francisco | 4,729,484 | San Francisco–Oakland–Berkeley, CA MSA | West | |||
| 13 | Riverside–San Bernardino | 4,662,361 | Riverside–San Bernardino–Ontario, CA MSA | West | |||
| 14 | Detroit | 4,326,442 | Detroit–Warren–Dearborn, MI MSA | Midwest | |||
| 15 | Seattle | 3,939,363 | Seattle–Tacoma–Bellevue, WA MSA | West | |||
| 16 | Minneapolis–St. Paul | 3,629,190 | Minneapolis–St. Paul–Bloomington, MN–WI MSA | Midwest | |||
| 17 | San Diego | 3,343,364 | San Diego–Carlsbad–San Marcos, CA MSA | West | |||
| 18 | Tampa–St. Petersburg | 3,142,663 | Tampa–St. Petersburg–Clearwater, FL MSA | South | |||
| 19 | Denver | 2,932,415 | Denver–Aurora–Lakewood, CO MSA | West | |||
| 20 | St. Louis | 2,805,465 | St. Louis, MO-IL MSA | Midwest | |||
| Based on 2018 MSA population estimates from the U.S. Census Bureau | |||||||
Race and ethnicity

Race
The United States Census Bureau collects racial data in accordance with guidelines provided by the U.S. Office of Management and Budget (OMB), and these data are based on self-identification. Many other countries count multiple races based on origin while America compiles multiple dozens of ethnicity groups into skin color grouping them together. The racial classifications and definitions used by the U.S. Census Bureau are:[74]
- White: a person having origins in any of the original peoples of Europe.[75] It includes people who indicate their race as "White" or report entries such as Irish, German, Italian or Caucasian.
- Black or African American: a person having origins in any of the Black racial groups of Africa.[75] It includes people who indicate their race as “Black, African Am.” or report entries such as African American, Kenyan, Nigerian, or Haitian.
- American Indian or Alaska Native: a person having origins in any of the original peoples of North and South America (including Central America) and who maintains tribal affiliation or community attachment.[75] This category includes people who indicate their race as "American Indian or Alaska Native" or report entries such as Navajo, Blackfeet, Inupiat, Yup'ik, Central American Indian groups, or South American Indian groups.
- Asian: A person having origins in any of the original peoples of the Far East, Southeast Asia, or the Indian subcontinent including, for example, Cambodia, China, India, Japan, Korea, Malaysia, Pakistan, the Philippine Islands, Thailand, and Vietnam.[75]
- Native Hawaiian or Other Pacific Islander: a person having origins in any of the original peoples of Hawaii, Guam, Samoa, or other Pacific Islands.[75]
- Some other race: includes all other responses not included in the “White,” “Black or African American,” “American Indian or Alaska Native,” “Asian,” and “Native Hawaiian or other Pacific Islander” racial categories described above includes Asians from Western Asia or Russia (non European Russia) and White Africans
- Two or more races: people may choose to provide two or more races either by checking two or more race response check boxes, providing multiple responses, or some combination of check boxes and other responses.
Data about race and ethnicity are self-reported to the Census Bureau. Since the 2000 census, Congress has authorized people to identify themselves according to more than one racial classification by selecting more than one category. Only one ethnicity may be selected, however, because the U.S. Census recognizes only two ethnicities—Hispanic and Non-Hispanic—which are mutually exclusive since you can be one or the other, but not both. The Census Bureau defines "Hispanic" as any person who has an ancestral connection to Latin America.
According to the 2013–2017 American Community Survey, the racial composition of the United States in 2017 was:[76]
| Race | Population (2017 est.) | Share of total population |
|---|---|---|
| Total | 321,004,407 | 100% |
| One race | 310,923,363 | 96.9% |
| White | 234,370,202 | 73.0% |
| Black or African American | 40,610,815 | 12.7% |
| American Indian and Alaska Native | 2,632,102 | 0.8% |
| Asian | 17,186,320 | 5.4% |
| Native Hawaiian and Other Pacific Islander | 570,116 | 0.2% |
| Other races | 15,553,808 | 4.8% |
| Two or more races | 10,081,044 | 3.1% |
| White and Black or African American | 2,657,560 | 0.8% |
| White and American Indian and Alaska Native | 1,905,946 | 0.6% |
| White and Asian | 2,057,321 | 0.6% |
| Black or African American and American Indian and Alaska Native | 319,097 | 0.1% |
| Hispanic or Latino (of any race) | 56,510,571 | 17.6% |
| Mexican | 35,709,528 | 11.1% |
| Puerto Rican | 5,418,521 | 1.7% |
| Cuban | 2,158,962 | 0.7% |
| Other Hispanic or Latino | 13,223,560 | 4.1% |
| Not Hispanic or Latino | 264,493,836 | 82.4% |
| White (non-Hispanic) | 197,277,789 | 61.5% |
| Black or African American (non-Hispanic) | 39,445,495 | 12.3% |
| American Indian and Alaska Native (non-Hispanic) | 2,098,763 | 0.7% |
| Asian (non-Hispanic) | 16,989,540 | 5.3% |
| Native Hawaiian and Other Pacific Islander (non-Hispanic) | 515,522 | 0.2% |
| Some other race (non-Hispanic) | 715,432 | 0.2% |
| Two or more races | 7,451,295 | 2.3% |
- Distribution of Total Population by Race, 1900 to 2010 (in %)
Hispanic are shown like part of the races. Source: U.S. Census Bureau.[68][64]
| Years | 1900 | 1910 | 1920 | 1930 | 1940 | 1950 | 1960 | 1970 | 1980 | 1990 | 2000* | 2010* |
|---|---|---|---|---|---|---|---|---|---|---|---|---|
| White | 87.9 | 88.9 | 89.7 | 89.8 | 89.8 | 89.5 | 88.6 | 87.5 | 83.0 | 80.3 | 75.1 | 72.4 |
| Black or African American | 11.6 | 10.7 | 9.9 | 9.7 | 9.8 | 10.0 | 10.5 | 11.1 | 11.7 | 12.1 | 12.3 | 12.6 |
| American Indian and Alaska Native | 0.8 | 0.8 | 0.9 | 0.9 | ||||||||
| Asian and Native Hawaiian and other Pacific Islander |
1.5 | 2.9 | 3.8 | 5.0 | ||||||||
| Some other race | 3.0 | 3.9 | 5.5 | 6.2 | ||||||||
| Two or more races | 2.4 | 2.9 | ||||||||||
| Sum (%) | 99.5 | 99.6 | 99.6 | 99.5 | 99.6 | 99.5 | 99.1 | 98.6 | 100 | 100 | 100 | 100 |
*Data are shown for the White, Black or African American, American Indian and Alaska Native, Asian and Native Hawaiian and Other Pacific Islander, and Some other race alone populations.
- Median age of each race, 2010 (Not Hispanic)
Source: United States Census Bureau.[77]
| Race | Median age (both sex) (years) | Median age (male) (years) | Median age (female) (years) |
|---|---|---|---|
| Total (Not Hispanic) | 39.6 | 38.4 | 40.8 |
| White | 42.0 | 40.7 | 43.3 |
| Black or African American | 32.7 | 30.9 | 34.3 |
| American Indian and Alaska Native | 31.7 | 30.6 | 32.7 |
| Asian | 35.4 | 34.3 | 36.4 |
| Native Hawaiian and Other Pacific Islander | 29.7 | 29.2 | 30.2 |
| Two or More Races | 19.0 | 18.1 | 19.8 |
- Median age of each race, 2017 (Not Hispanic)
Source: United States Census Bureau.[77]
| Race | Median age (both sex) (years) | Median age (male) (years) | Median age (female) (years) |
|---|---|---|---|
| Total (Not Hispanic) | 40.5 | 39.1 | 42.0 |
| White | 43.5 | 42.1 | 45.0 |
| Black or African American | 34.2 | 32.3 | 36.0 |
| American Indian and Alaska Native | 33.6 | 32.4 | 34.8 |
| Asian | 36.9 | 35.5 | 38.1 |
| Native Hawaiian and Other Pacific Islander | 32.9 | 32.4 | 33.4 |
| Two or More Races | 20.3 | 19.5 | 21.2 |
| Race/ethnicity | White | Black or African American | Hispanic | Asian | American Indian and Alaska Native | Native Hawaiian and Pacific Islander | Multiracial |
|---|---|---|---|---|---|---|---|
| Most common age | 58 yo | 27 yo | 11 yo | 29 yo | 26 yo | 28 yo | 3 yo |
| State or territory | Population (2015 est.) | White | Black or African American | American Indian and Alaska Native | Asian | Native Hawaiian and Other Pacific Islander | Some other race | Two or more races |
|---|---|---|---|---|---|---|---|---|
| Alabama | 4,830,620 | 68.8% | 26.4% | 0.5% | 1.2% | 0.1% | 1.3% | 1.7% |
| Alaska | 733,375 | 66.0% | 3.4% | 13.8% | 5.9% | 1.2% | 1.3% | 8.4% |
| Arizona | 6,641,928 | 78.4% | 4.2% | 4.4% | 3.0% | 0.2% | 6.5% | 3.2% |
| Arkansas | 2,958,208 | 78.0% | 15.5% | 0.6% | 1.4% | 0.2% | 2.1% | 2.1% |
| California | 38,421,464 | 61.8% | 5.9% | 0.7% | 13.7% | 0.4% | 12.9% | 4.5% |
| Colorado | 5,278,906 | 84.2% | 4.0% | 0.9% | 2.9% | 0.1% | 4.3% | 3.5% |
| Connecticut | 3,593,222 | 77.3% | 10.3% | 0.2% | 4.2% | 0.0% | 5.1% | 2.8% |
| Delaware | 926,454 | 69.4% | 21.6% | 0.3% | 3.6% | 0.0% | 2.3% | 2.7% |
| District of Columbia | 647,484 | 40.2% | 48.9% | 0.3% | 3.7% | 0.0% | 4.2% | 2.7% |
| Florida | 19,645,772 | 76.0% | 16.1% | 0.3% | 2.6% | 0.1% | 2.5% | 2.4% |
| Georgia | 10,006,693 | 60.2% | 30.9% | 0.3% | 3.6% | 0.0% | 2.8% | 2.1% |
| Hawaii | 1,406,299 | 25.4% | 2.0% | 0.2% | 37.7% | 9.9% | 1.1% | 23.7% |
| Idaho | 1,616,547 | 91.7% | 0.6% | 1.3% | 1.3% | 0.1% | 2.4% | 2.6% |
| Illinois | 12,873,761 | 72.3% | 14.3% | 0.2% | 5.0% | 0.0% | 5.8% | 2.2% |
| Indiana | 6,568,645 | 84.2% | 9.2% | 0.2% | 1.9% | 0.0% | 2.3% | 2.2% |
| Iowa | 3,093,526 | 91.2% | 3.2% | 0.3% | 2.0% | 0.1% | 1.3% | 2.0% |
| Kansas | 2,892,987 | 85.2% | 5.8% | 0.8% | 2.6% | 0.1% | 2.2% | 3.3% |
| Kentucky | 4,397,353 | 87.6% | 7.9% | 0.2% | 1.3% | 0.0% | 0.9% | 2.1% |
| Louisiana | 4,625,253 | 62.8% | 32.1% | 0.6% | 1.7% | 0.0% | 1.0% | 1.8% |
| Maine | 1,329,100 | 95.0% | 1.1% | 0.6% | 1.1% | 0.0% | 0.2% | 2.0% |
| Maryland | 5,930,538 | 57.6% | 29.5% | 0.3% | 6.0% | 0.0% | 3.6% | 3.0% |
| Massachusetts | 6,705,586 | 79.6% | 7.1% | 0.2% | 6.0% | 0.0% | 4.2% | 2.9% |
| Michigan | 9,900,571 | 79.0% | 14.0% | 0.5% | 2.7% | 0.0% | 1.1% | 2.6% |
| Minnesota | 5,419,171 | 84.8% | 5.5% | 1.0% | 4.4% | 0.0% | 1.5% | 2.7% |
| Mississippi | 2,988,081 | 59.2% | 37.4% | 0.4% | 1.0% | 0.0% | 0.9% | 1.2% |
| Missouri | 6,045,448 | 82.6% | 11.5% | 0.4% | 1.8% | 0.1% | 1.1% | 2.4% |
| Montana | 1,014,699 | 89.2% | 0.5% | 6.5% | 0.7% | 0.1% | 0.5% | 2.5% |
| Nebraska | 1,869,365 | 88.1% | 4.7% | 0.9% | 2.0% | 0.1% | 1.9% | 2.2% |
| Nevada | 2,798,636 | 69.0% | 8.4% | 1.1% | 7.7% | 0.6% | 8.8% | 4.4% |
| New Hampshire | 1,324,201 | 93.7% | 1.3% | 0.2% | 2.4% | 0.0% | 0.5% | 1.8% |
| New Jersey | 8,904,413 | 68.3% | 13.5% | 0.2% | 9.0% | 0.0% | 6.4% | 2.5% |
| New Mexico | 2,084,117 | 73.2% | 2.1% | 9.1% | 1.4% | 0.1% | 10.9% | 3.3% |
| New York | 19,673,174 | 64.6% | 15.6% | 0.4% | 8.0% | 0.0% | 8.6% | 2.9% |
| North Carolina | 9,845,333 | 69.5% | 21.5% | 1.2% | 2.5% | 0.1% | 3.0% | 2.4% |
| North Dakota | 721,640 | 88.7% | 1.6% | 5.3% | 1.2% | 0.0% | 0.8% | 2.2% |
| Ohio | 11,575,977 | 82.4% | 12.2% | 0.2% | 1.9% | 0.0% | 0.8% | 2.5% |
| Oklahoma | 3,849,733 | 73.1% | 7.2% | 7.3% | 1.9% | 0.1% | 2.6% | 7.8% |
| Oregon | 3,939,233 | 85.1% | 1.8% | 1.2% | 4.0% | 0.4% | 3.4% | 4.1% |
| Pennsylvania | 12,779,559 | 81.6% | 11.0% | 0.2% | 3.1% | 0.0% | 2.0% | 2.1% |
| Rhode Island | 1,053,661 | 81.1% | 6.5% | 0.5% | 3.2% | 0.0% | 5.8% | 2.8% |
| South Carolina | 4,777,576 | 67.2% | 27.5% | 0.3% | 1.4% | 0.1% | 1.5% | 2.0% |
| South Dakota | 843,190 | 85.0% | 1.6% | 8.6% | 1.2% | 0.0% | 0.9% | 2.6% |
| Tennessee | 6,499,615 | 77.8% | 16.8% | 0.3% | 1.6% | 0.1% | 1.5% | 2.0% |
| Texas | 26,538,614 | 74.9% | 11.9% | 0.5% | 4.2% | 0.1% | 6.0% | 2.5% |
| Utah | 2,903,379 | 87.6% | 1.1% | 1.1% | 2.2% | 0.9% | 4.5% | 2.6% |
| Vermont | 626,604 | 94.9% | 1.1% | 0.3% | 1.4% | 0.0% | 0.3% | 1.9% |
| Virginia | 8,256,630 | 69.0% | 19.2% | 0.3% | 6.0% | 0.1% | 2.2% | 3.2% |
| Washington | 6,985,464 | 77.8% | 3.6% | 1.3% | 7.7% | 0.6% | 3.8% | 5.2% |
| West Virginia | 1,851,420 | 93.6% | 3.3% | 0.2% | 0.7% | 0.0% | 0.2% | 2.0% |
| Wisconsin | 5,742,117 | 86.5% | 6.3% | 0.9% | 2.5% | 0.0% | 1.7% | 2.1% |
| Wyoming | 579,679 | 91.0% | 1.1% | 2.2% | 0.9% | 0.1% | 2.1% | 2.7% |
| Puerto Rico | 3,583,073 | 69.7% | 8.4% | 0.3% | 0.3% | 0.0% | 12.0% | 9.3% |
| Year | White Alone | Black Alone | Hispanic | Native American Alone | Asian Alone | Pacific Islander Alone |
|---|---|---|---|---|---|---|
| 2018 | 51.6% | 14.6% | 23.4% | 0.8% | 6.4% | 0.3% |
| Year | White | Black or African American | Hispanic | Asian | Pacific Islander | American Indian Alaska Native | Two or more races |
|---|---|---|---|---|---|---|---|
| 2000 | 60% | 15% | 16% | 3% | -- | 1% | 2% |
| 2017 | 51% | 14% | 25% | 5% | -- | 1% | 4% |
| Year | White | Black or African American | Hispanic | Asian | Pacific Islander | American Indian Alaska Native | Two or more races |
|---|---|---|---|---|---|---|---|
| 2000 | 62% | 14% | 18% | 4% | -- | 1% | 1% |
| 2017 | 54% | 14% | 22% | 6% | -- | 1% | 3% |
| Age group | 85+ | 80-84 | 75-79 | 70-74 | 65-69 | 60-64 | 55-59 | 50-54 | 45-49 | 40-44 | 35-39 | 30-34 | 25-29 | 20-24 | 15-19 | 10-14 | 5-9 | <5 |
|---|---|---|---|---|---|---|---|---|---|---|---|---|---|---|---|---|---|---|
| non-Hispanic white | 83% | 81% | 79% | 78% | 77% | 74% | 72% | 69% | 65% | 61% | 58% | 57% | 57% | 56% | 55% | 54% | 52% | 50% |
| Minority | 17% | 19% | 21% | 22% | 23% | 26% | 28% | 31% | 35% | 39% | 42% | 43% | 43% | 44% | 45% | 46% | 48% | 50% |
Hispanic or Latino origin
The U.S. Office of Management and Budget (OMB) defines "Hispanic or Latino" as a person of Cuban, Mexican, Puerto Rican, Dominican, South or Central American, or other Spanish culture or origin regardless of race. People who identify with the terms “Hispanic” or “Latino” are those who classify themselves in one of the specific Hispanic or Latino categories listed on the decennial census questionnaire and various Census Bureau survey questionnaires – “Mexican, Mexican Am., Chicano” or ”Puerto Rican” or “Cuban” – as well as those who indicate that they are “another Hispanic, Latino, or Spanish origin.”[81] People who identify their origin as Hispanic or Latino may be of any race.[74]
| Hispanic or Latino and Race | Population (2015 est.) | Percentage of total population |
|---|---|---|
| United States population | 316,515,021 | 100% |
| Hispanic or Latino (of any race) | 54,232,205 | 17.1% |
| White | 35,684,777 | 11.3% |
| Black or African American | 1,122,369 | 0.3% |
| American Indian and Alaska Native | 490,557 | 0.1% |
| Asian | 181,231 | 0.0% |
| Native Hawaiian and Other Pacific Islander | 46,724 | 0.0% |
| Some other race | 14,226,829 | 4.5% |
| Two or more races | 2,479,718 | 0.8% |
| Not Hispanic or Latino | 262,282,816 | 82.9% |
- Population distribution by Hispanic origin 1970–2010 (in %)
Source: U.S. Census Bureau, decennial census of population, 1970 (5-percent sample), 1980 to 2010.[64]
| Years | 1970 | 1980 | 1990 | 2000 | 2010 |
|---|---|---|---|---|---|
| Not Hispanic or Latino | 95.5 | 93.6 | 91.0 | 87.5 | 83.7 |
| Hispanic or Latino | 4.5 | 6.4 | 9.0 | 12.5 | 16.3 |
| Total (%) | 100 | 100 | 100 | 100 | 100 |
- Median age of each race, 2010 (Hispanic)
Source: United States Census Bureau.[77]
| Race | Median age (both sex) (years) | Median age (male) (years) | Median age (female) (years) |
|---|---|---|---|
| Total (Hispanic) | 27.3 | 26.7 | 27.9 |
| White | 27.8 | 27.2 | 28.4 |
| Black or African American | 24.5 | 23.5 | 25.6 |
| American Indian and Alaska Native | 26.0 | 26.1 | 25.8 |
| Asian | 25.0 | 24.4 | 25.6 |
| Native Hawaiian and Other Pacific Islander | 24.9 | 24.8 | 24.9 |
| Two or More Races | 19.6 | 19.1 | 20.0 |
- Median age of each race, 2017 (Hispanic)
Source: United States Census Bureau.[77]
| Race | Median age (both sex) (years) | Median age (male) (years) | Median age (female) (years) |
|---|---|---|---|
| Total (Hispanic) | 29.3 | 28.8 | 29.8 |
| White | 29.8 | 29.3 | 30.3 |
| Black or African American | 26.8 | 25.8 | 27.9 |
| American Indian and Alaska Native | 28.6 | 29.0 | 28.1 |
| Asian | 27.2 | 26.5 | 27.8 |
| Native Hawaiian and Other Pacific Islander | 27.8 | 28.1 | 27.4 |
| Two or More Races | 20.9 | 20.4 | 21.3 |
Note: Hispanic origin is considered an ethnicity, not a race. Hispanics may be of any race.
Indigenous peoples
As of 2017, there are 2,098,763 American Indian and Alaska Native people in the United States,[76] representing 0.7% of the U.S. population. There are 573 federally recognized tribal governments[82] in the United States. As of 2000, the largest groups in the United States by population were Navajo, Cherokee, Choctaw, Sioux, Chippewa, Apache, Blackfeet, Iroquois, and Pueblo.
Other groups
There were 22.1 million veterans in 2009,[83] meaning that less than 10% of Americans served in the Armed Forces.[84]
In 2010, The Washington Post estimated that there were 11 million undocumented immigrants in the country.[85] As of 2017, Pew Research reported that there an estimated 10.5 million undocumented immigrants in the U.S..[86]
There were about 2 million people in prison in 2010.[87]
The 2000 U.S. Census counted same-sex couples in an oblique way; asking the sex and the relationship to the "main householder", whose sex was also asked. Community Marketing & Insights, an organization specializing in analyzing gay demographic data, reported, based on this count in the 2000 census and in the 2000 supplementary survey, that same-sex couples comprised between 0.99% and 1.13% of U.S. couples in 2000.[88] A 2006 report issued by The Williams Institute on Sexual Orientation concluded that the number of same-sex couples in the U.S. grew from 2000 to 2005, from nearly 600,000 couples in 2000 to almost 777,000 in 2005. A 2006 UCLA study reported that 4.1% of Americans aged 18–45 identify as gay, lesbian, or bisexual.[89]
A 2011 report by the Williams Institute estimated that 9 million adults identify as gay, lesbian, or bisexual, representing 3.5% of the population over 18.[90] A spokesperson said that, until recently, few studies have tried to eliminate people who had occasionally undertaken homosexual behavior or entertained homosexual thoughts, from people who identified as lesbian or gay.[91] (Older estimates have varied depending on methodology and timing; see Demographics of sexual orientation for a list of studies.) The American Community Survey from the 2000 U.S. Census estimated 776,943 same-sex couple households in the country as a whole, representing about 0.5% of the population.[89]
Projections
| 2015 | 2050 | |
|---|---|---|
| White Americans1 | 77.4% | 70.8% |
| > Non-Hispanic Whites | 61.8% | 46.6% |
| Black Americans1 | 13.2% | 14.4% |
| Asian Americans1 | 5.3% | 7.7% |
| Multiracial Americans1 | 2.6% | 5.4% |
| Hispanics/Latinos (of any race) | 17.8% | 28.0% |
| 1 Including Hispanics | ||
A report by the U.S. Census Bureau projects a decrease in the ratio of Whites between 2010 and 2050, from 79.5% to 74.0%.[93] At the same time, Non-Hispanic Whites are projected to no longer make up a majority of the population by 2045, but will remain the largest single ethnic group. In 2050 they will compose 46.3% of the population. Non-Hispanic whites made up 85% of the population in 1960.[94]
The report foresees the Hispanic or Latino population rising from 16% today to 30% by 2050, the Black percentage barely rising from 12.9% to 13.1%, and Asian Americans upping their 4.6% share to 7.8%. The United States had a population of 310 million people in October 2010, and is projected to reach 400 million by 2039 and 439 million in 2050.[17][95][96][97] It is further projected that 82% of the increase in population from 2005 to 2050 will be due to immigrants and their children.[98]
Of the nation's children in 2050, 62% are expected to be of a minority ethnicity, up from 44% today. Approximately 39% are projected to be Hispanic or Latino (up from 22% in 2008), and 38% are projected to be single-race, non-Hispanic Whites (down from 56% in 2008).[99] Racial and ethnic minorities surpassed non-Hispanic whites as the largest group of American children under 5 years old in 2015.[100]
- Pew Research Center projections
The United Nations projects a population of just over 400 million in 2060.[101]
| 1960 | 2005 | 2050 | |
|---|---|---|---|
| White Americans | 85% | 67% | 47% |
| Hispanic Americans | 3.5% | 14% | 29% |
| Black Americans | 11% | 13% | 13% |
| Asian Americans | 0.6% | 5% | 9% |
| Note: All races modified and not Hispanic; American Indian/Alaska Native not shown. | |||
The country's racial profile will be vastly different, and although whites will remain the single largest racial group in the US, they will no longer be a majority by 2055 according to Pew Research Center. Growth in the Hispanic and Asian populations is predicted to almost triple over the next 40 years. By 2055, the breakdown is estimated to be 48% White, 24% Hispanic, 14% Asian, and 13% Black.[101]
As of 2015, 14% of the United States' population is foreign born, compared to just 5% in 1965. Nearly 39 million immigrants have come to the US since 1965, with most coming from Asia and Latin America. The 2015 Census Report predicts that the percentage of the US population that is foreign born will continue to increase, reaching 19% by 2060. This increase in the foreign-born population will account for a large share of the overall population growth.[101]
The average US citizen of 2060 is likely to be older than the average citizen of today, and almost one in four people will be 65 or older.[101]
U.S. Census Census Bureau projections
- Percent minority 1970–2042 (2008 projections)[64]
| Years | 1970 | 1980 | 1990 | 2000 | 2010 | 2020 | 2030 | 2040 | 2042 |
|---|---|---|---|---|---|---|---|---|---|
| Percent minority (%) | 16.5 | 20.4 | 24.4 | 30.9 | 36.3 | 39.9 | 44.5 | 49.2 | 50.1 |
Note: “Minority” refers to people who reported their ethnicity and race as something other than non-Hispanic White alone in the decennial census.
- Total US population
| Year | Projection (Census Bureau)[17]
(thousands) |
Projection (UN)[103]
(thousands) |
Actual result |
|---|---|---|---|
| 2010 | 310,233 | 309,011 | 308,745,538 |
| 2020 | 341,387 | 331,003 | |
| 2030 | 373,504 | 349,642 | |
| 2040 | 405,655 | 366,572 | |
| 2050 | 439,010 | 379,419 |
Foreign-born population
As of 2017, there is a total of 44,525,458 foreign-born people in the United States[104] that represents the 13.5% of the total population of the country.
It is important to note that the foreign-born people are not necessarily recent immigrants, in general, Europeans have resided in the United States longer than the total immigrant population, approximately the 66 percent of the European inmigrants arrived prior to 2000.[105]
| Place of birth | Estimate | Percentage of total foreign-born people |
|---|---|---|
| Americas | 23,241,959 | 52.2% |
| Caribbean | 4,414,943 | 9.9% |
| > Cuba | 1,311,803 | 3.0% |
| > Dominican Republic | 1,162,568 | 2.6% |
| Central America (including Mexico) | 14,796,926 | 33.2% |
| > Mexico | 11,269,913 | 25.3% |
| > El Salvador | 1,401,832 | 3.2% |
| South America | 3,213,187 | 7.2% |
| Canada | 809,267 | 1.8% |
| Europe | 4,818,662 | 10.8% |
| Northern Europe | 941,796 | 2.1% |
| Western Europe | 949,591 | 2.1% |
| Southern Europe | 761,390 | 1.7% |
| Eastern Europe | 2,153,855 | 4.8% |
| Asia | 13,907,844 | 31.2% |
| Eastern Asia | 4,267,303 | 9.6% |
| > China | 2,639,365 | 5.9% |
| > Korea | 1,064,960 | 2.4% |
| South Central Asia | 4,113,013 | 9.2% |
| > India | 2,348,687 | 5.3% |
| South Eastern Asia | 4,318,647 | 6.7% |
| > Philippines | 1,945,345 | 4.4% |
| > Vietnam | 1,314,927 | 3.0% |
| Western Asia | 1,159,835 | 2.6% |
| Africa | 2,293,028 | 5.2% |
| Eastern Africa | 693,784 | 1.6% |
| Middle Africa | 163,364 | 0.4% |
| Northern Africa | 359,559 | 0.8% |
| Southern Africa | 116,297 | 0.2% |
| Western Africa | 837,290 | 1.9% |
| Oceania | 263,965 | 0.6% |
| Australia and New Zealand Subregion | 123,080 | 0.3% |
Citizens living abroad
As of April 2015, the US State Department estimated that 8.7 million American citizens live overseas. Americans living overseas are not counted in the US Census unless they are a US government employee or the dependent of a US government employee.[106] A 2010 paper estimated the number of civilian Americans living abroad to be around 4 million.[107] So-called 'accidental Americans' are citizens of a country other than the United States who may also be considered U.S. citizens or be eligible for American citizenship under American nationality law but are not aware of having such status, or have only become aware of it recently during adulthood.[108]
Religion
Religious affiliations
The table below is based mainly on selected data as reported to the United States Census Bureau. It only includes the voluntary self-reported membership of religious bodies with 750,000 or more. The definition of a member is determined by each religious body.[110] In 2004, the US census bureau reported that about 13% of the population did not identify themselves as a member of any religion.[111]
In a Pew Research Survey performed in 2012, Americans without a religion (atheists, agnostics, nothing in particular, etc.) approached the numbers of Evangelical Protestant Americans with almost 20% of Americans being nonreligious (compared to just over 26% being Evangelical Protestant). If this current growth rate continues, by 2050, around 51% of Americans will not have a religion.[112]
Surveys conducted in 2014 and 2019 by Pew indicated that the percentage of Americans unaffiliated with a religion increased from 16% in 2007 to 23% in 2014 and 26% of the population in 2019.[113][114]
| Religious body | Year reported |
Places of worship |
Membership (thousands) |
Clergy |
|---|---|---|---|---|
| African Methodist Episcopal Church | 1999 | no data | 2,500 | 7,741 |
| African Methodist Episcopal Zion Church | 2002 | 3,226 | 1,431 | 3,252 |
| American Baptist Association | 2009 | 1,600[115] | 100[115] | 1,740 |
| Amish, Old Order | 1993 | 898 | 227 | 3,592 |
| American Baptist Churches USA | 2017 | 5,057 | 1,146[116] | 4,145 |
| Antiochian Orthodox Christian Archdiocese of North America | 1998 | 220 | 65 | 263 |
| Armenian Apostolic Church | 2010 | 153 | 1,000 | 200 |
| Armenian Catholic Church | 2010 | 36 | ||
| Assemblies of God | 2018 | 13,017[117] | 1,857[117] | 38,199[117] |
| Baptist Bible Fellowship International | 2010 | 4,000[118] | 1,100[118] | 4,190[118] |
| Baptist General Conference | 1998 | 876 | 141 | no data |
| Baptist Missionary Association of America | 2010 | 1,272[119] | 138[119] | 1,525 |
| Buddhism | 2001 | no data | 1,082 | no data |
| Christian and Missionary Alliance, The | 1998 | 1,964 | 346 | 1,629 |
| Christian Brethren (Plymouth Brethren) | 1997 | 1,150 | 100 | no data |
| Christian Church (Disciples of Christ) | 2018 | 3,624 | 382[120] | 2,066 |
| Christian churches and churches of Christ | 1998 | 5,579 | 1,072 | 5,525 |
| Christian Congregation, Inc., The | 1998 | 1,438 | 117 | 1,436 |
| Christian Methodist Episcopal Church | 1983 | 2,340 | 719 | no data |
| Christian Reformed Church in North America | 1998 | 733 | 199 | 655 |
| Church of God in Christ | 1991 | 15,300 | 5,500 | 28,988 |
| Church of God of Prophecy | 1997 | 1,908 | 77 | 2,000 |
| Church of God (Anderson, IN) | 1998 | 2,353 | 234 | 3,034 |
| Church of God (Cleveland, Tennessee) | 1995 | 6,060 | 753 | 3,121 |
| The Church of Jesus Christ of Latter-day Saints | 2014 | 14,018 | 6,466 | 38,259 |
| Church of the Brethren | 1997 | 1,095 | 141 | 827 |
| Church of the Nazarene | 1998 | 5,101 | 627 | 4,598 |
| Churches of Christ | 2019 | 11,989[121] | 1,116[121] | 14,500 |
| Conservative Baptist Association of America | 1998 | 1,200 | 200 | no data |
| Community of Christ | 1998 | 1,236 | 140 | 19,319 |
| Coptic Orthodox Church | 2003 | 200 | 1,000 | 200 |
| Cumberland Presbyterian Church | 1998 | 774 | 87 | 630 |
| Episcopal Church | 2018 | 6,423[122] | 1,676[122] | 8,131 |
| Evangelical Covenant Church, The | 1998 | 628 | 97 | 607 |
| Evangelical Free Church of America, The | 1995 | 1,224 | 243 | 1,936 |
| Evangelical Lutheran Church in America | 2018 | 9,091[123] | 3,363[123] | 9,646 |
| Evangelical Presbyterian Church | 1998 | 187 | 61 | 262 |
| Free Methodist Church of North America | 1998 | 990 | 73 | no data |
| Full Gospel Fellowship | 1999 | 896 | 275 | 2,070 |
| General Association of General Baptists | 1997 | 790 | 72 | 1,085 |
| General Association of Regular Baptist Churches | 1998 | 1,415 | 102 | no data |
| U.S. Conference of Mennonite Brethren Churches | 1996 | 368 | 82 | 590 |
| Grace Gospel Fellowship | 1992 | 128 | 60 | 160 |
| Greek Orthodox Archdiocese of America | 2006 | 560[124] | 1,500[124] | 840[124] |
| Hinduism | 2001 | no data | 766 | no data |
| Independent Fundamental Churches of America | 1999 | 659 | 62 | no data |
| International Church of the Foursquare Gospel | 1998 | 1,851 | 238 | 4,900 |
| International Council of Community Churches | 1998 | 150 | 250 | 182 |
| International Pentecostal Holiness Church | 1998 | 1,716 | 177 | 1507 |
| Islam | 2011 | no data | 2,600 | no data |
| Jainism | no data | no data | 50 | no data |
| Jehovah's Witnesses | 2014 | 13,871 | 1,243 | no data |
| Judaism | 2006 | 3,727 | 6,588 | no data |
| Lutheran Church–Missouri Synod, The | 2017 | 6,046[125] | 1,969[125] | 6,055[125] |
| Macedonian Orthodox Church – Ohrid Archbishopric | 2010 | 19 | 50 | no data |
| Mennonite Church USA | 2005 | 943 | 114 | no data |
| National Association of Congregational Christian Churches | 1998 | 416 | 67 | 534 |
| National Association of Free Will Baptists | 2007 | 2,369[126] | 186[126] | 3,915[126] |
| National Baptist Convention of America, Inc. | 1987 | 2,500 | 3,500 | 8,000 |
| National Baptist Convention, USA, Inc. | 1992 | 33,000 | 8,200 | 32,832 |
| National Missionary Baptist Convention of America | 2004 | 300[127] | 400[127] | no data |
| Orthodox Church in America | 2010 | 750[128] | 131[128] | 970[128] |
| Pentecostal Assemblies of the World, Inc. | 1998 | 1,750 | 1,500 | 4,500 |
| Pentecostal Church of God | 1998 | 1,237 | 104 | no data |
| Pentecostal Church International, United | 2008 | 28,351 | 4,037 | 22,881 |
| Presbyterian Church in America | 1997 | 1,340 | 280 | 1,642 |
| Presbyterian Church (U.S.A.) | 2018 | 9,161[129] | 1,353[129] | 19,243[129] |
| Progressive National Baptist Convention, Inc. | 2017 | 1,200[127] | 1,500[127] | no data |
| Reformed Church in America | 2018 | 902 | 200[130] | 915 |
| Religious Society of Friends | 1994 | 1,200 | 104 | no data |
| Roman Catholic Church | 2002 | 19,484 | 66,404 | 50,017 (1997)[131] |
| Romanian Orthodox Episcopate | 1996 | 37 | 65 | 37 |
| Salvation Army, The | 1998 | 1,388 | 471 | 2,920 |
| Scientology | 2005 | 1,300 | 55[132] | 1 |
| Serbian Orthodox Church | 1986 | 68 | 67 | 60 |
| Seventh-day Adventist Church | 1998 | 4,405 | 840 | 2,454 |
| Sikhism | 1999 | 244 | 80 | no data |
| Southern Baptist Convention | 2018 | 47,456[133] | 14,800[133] | 71,520 |
| Unitarian Universalism | 2001 | no data | 629 | no data |
| United Church of Christ | 2016 | 5,000 | 880 | 5,868 |
| United House of Prayer for All People | no data | 100 | 25 | no data |
| United Methodist Church, The | 2018 | 36,170 | 6,672[134] | no data |
| Wesleyan Church, The | 1998 | 1,590 | 120 | 1,806 |
| Wisconsin Evangelical Lutheran Synod | 2018 | 1,281[135] | 359[135] | 1,222 |
| Zoroastrianism | 2006 | no data | 11 | no data |
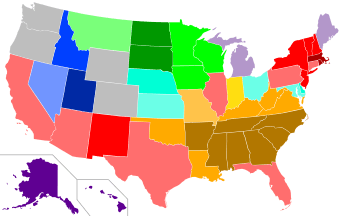 Religious affiliation within each state that has the largest deviation compared to the national average, 2001.
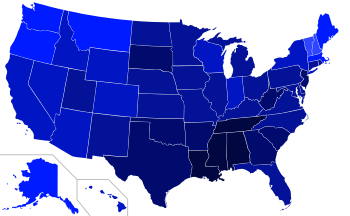 Percentage of state populations that identify with a religion rather than "no religion", 2014.
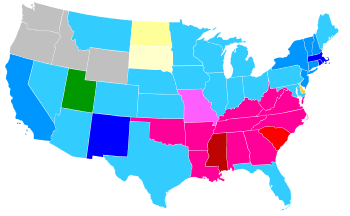 Plurality religion by state, 2001. Data is unavailable for Alaska and Hawaii.
According to Pew Research Center study released in 2018, by 2040, Islam will surpass Judaism to become the second largest religion in the US due to higher immigration and birth rates.[136]
Religions of American adults
The United States government does not collect religious data in its census. The survey below, the American Religious Identification Survey (ARIS) 2008, was a random digit-dialed telephone survey of 54,461 American residential households in the contiguous United States. The 1990 sample size was 113,723; 2001 sample size was 50,281.
Adult respondents were asked the open-ended question, "What is your religion, if any?". Interviewers did not prompt or offer a suggested list of potential answers. The religion of the spouse or partner was also asked. If the initial answer was "Protestant" or "Christian" further questions were asked to probe which particular denomination. About one-third of the sample was asked more detailed demographic questions.
Religious Self-Identification of the U.S. Adult Population: 1990, 2001, 2008[137]
Figures are not adjusted for refusals to reply; investigators suspect refusals are possibly more representative of "no religion" than any other group.
| Group | 1990 adults × 1,000 | 2001 adults × 1,000 | 2008 adults × 1,000 | Numerical Change 1990– 2008 as % of 1990 | 1990 % of adults | 2001 % of adults | 2008 % of adults | change in % of total adults 1990– 2008 |
|---|---|---|---|---|---|---|---|---|
| Adult population, total | 175,440 | 207,983 | 228,182 | 30.1% | ||||
| Adult population, Responded | 171,409 | 196,683 | 216,367 | 26.2% | 97.7% | 94.6% | 94.8% | −2.9% |
| Total Christian | 151,225 | 159,514 | 173,402 | 14.7% | 86.2% | 76.7% | 76.0% | −10.2% |
| Catholic | 46,004 | 50,873 | 57,199 | 24.3% | 26.2% | 24.5% | 25.1% | −1.2% |
| Non-Catholic Christian | 105,221 | 108,641 | 116,203 | 10.4% | 60.0% | 52.2% | 50.9% | −9.0% |
| Baptist | 33,964 | 33,820 | 36,148 | 6.4% | 19.4% | 16.3% | 15.8% | −3.5% |
| Mainline Protestant | 32,784 | 35,788 | 29,375 | −10.4% | 18.7% | 17.2% | 12.9% | −5.8% |
| Methodist | 14,174 | 14,039 | 11,366 | −19.8% | 8.1% | 6.8% | 5.0% | −3.1% |
| Lutheran | 9,110 | 9,580 | 8,674 | −4.8% | 5.2% | 4.6% | 3.8% | −1.4% |
| Presbyterian | 4,985 | 5,596 | 4,723 | −5.3% | 2.8% | 2.7% | 2.1% | −0.8% |
| Episcopalian/Anglican | 3,043 | 3,451 | 2,405 | −21.0% | 1.7% | 1.7% | 1.1% | −0.7% |
| United Church of Christ | 438 | 1,378 | 736 | 68.0% | 0.2% | 0.7% | 0.3% | 0.1% |
| Christian Generic | 25,980 | 22,546 | 32,441 | 24.9% | 14.8% | 10.8% | 14.2% | −0.6% |
| Jehovah's Witness | 1,381 | 1,331 | 1,914 | 38.6% | 0.8% | 0.6% | 0.8% | 0.1% |
| Christian Unspecified | 8,073 | 14,190 | 16,384 | 102.9% | 4.6% | 6.8% | 7.2% | 2.6% |
| Non-denominational Christian | 194 | 2,489 | 8,032 | 4040.2% | 0.1% | 1.2% | 3.5% | 3.4% |
| Protestant – Unspecified | 17,214 | 4,647 | 5,187 | −69.9% | 9.8% | 2.2% | 2.3% | −7.5% |
| Evangelical/Born Again | 546 | 1,088 | 2,154 | 294.5% | 0.3% | 0.5% | 0.9% | 0.6% |
| Pentecostal/Charismatic | 5,647 | 7,831 | 7,948 | 40.7% | 3.2% | 3.8% | 3.5% | 0.3% |
| Pentecostal – Unspecified | 3,116 | 4,407 | 5,416 | 73.8% | 1.8% | 2.1% | 2.4% | 0.6% |
| Assemblies of God | 617 | 1,105 | 810 | 31.3% | 0.4% | 0.5% | 0.4% | 0.0% |
| Church of God | 590 | 943 | 663 | 12.4% | 0.3% | 0.5% | 0.3% | 0.0% |
| Other Protestant Denomination | 4,630 | 5,949 | 7,131 | 54.0% | 2.6% | 2.9% | 3.1% | 0.5% |
| Seventh-Day Adventist | 668 | 724 | 938 | 40.4% | 0.4% | 0.3% | 0.4% | 0.0% |
| Churches of Christ | 1,769 | 2,593 | 1,921 | 8.6% | 1.0% | 1.2% | 0.8% | −0.2% |
| Mormon/Latter-Day Saints | 2,487 | 2,697 | 3,158 | 27.0% | 1.4% | 1.3% | 1.4% | 0.0% |
| Total non-Christian religions | 5,853 | 7,740 | 8,796 | 50.3% | 3.3% | 3.7% | 3.9% | 0.5% |
| Jewish | 3,137 | 2,837 | 2,680 | −14.6% | 1.8% | 1.4% | 1.2% | −0.6% |
| Eastern Religions | 687 | 2,020 | 1,961 | 185.4% | 0.4% | 1.0% | 0.9% | 0.5% |
| Buddhist | 404 | 1,082 | 1,189 | 194.3% | 0.2% | 0.5% | 0.5% | 0.3% |
| Muslim | 527 | 1,104 | 1,349 | 156.0% | 0.3% | 0.5% | 0.6% | 0.3% |
| New Religious Movements & Others | 1,296 | 1,770 | 2,804 | 116.4% | 0.7% | 0.9% | 1.2% | 0.5% |
| None/ No religion, total | 14,331 | 29,481 | 34,169 | 138.4% | 8.2% | 14.2% | 15.0% | 6.8% |
| Agnostic+Atheist | 1,186 | 1,893 | 3,606 | 204.0% | 0.7% | 0.9% | 1.6% | 0.9% |
| Did Not Know/ Refused to reply | 4,031 | 11,300 | 11,815 | 193.1% | 2.3% | 5.4% | 5.2% | 2.9% |
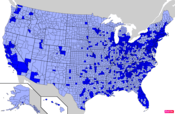
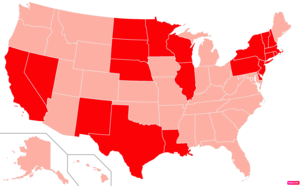 States in the United States by Catholic population according to the Pew Research Center 2014 Religious Landscape Survey.[138] States with Catholic population greater than the United States as a whole are in full red.
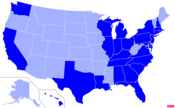
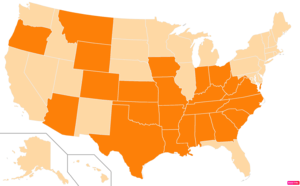 States in the United States by Evangelical Protestant population according to the Pew Research Center 2014 Religious Landscape Survey.[138] States with Evangelical Protestant populations greater than the United States as a whole are in full orange.
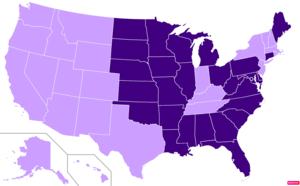 States in the United States by Mainline or Black Protestant population according to the Pew Research Center 2014 Religious Landscape Survey.[138] States with Mainline or Black Protestant population greater than the United States as a whole are in full purple.
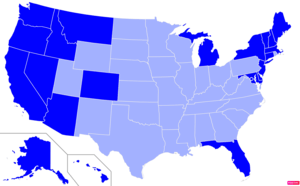
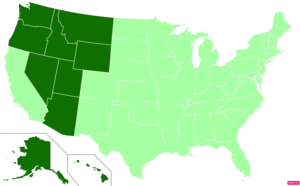 States in the United States by non-Protestant and non-Catholic Christian (e.g. Mormon, Jehovah's Witness, Eastern Orthodox) population according to the Pew Research Center 2014 Religious Landscape Survey.[138] States with non-Catholic/non-Protestant Christian population greater than the United States as a whole are in full green.
Income
In 2006, the median household income in the United States was around $46,326. Household and personal income depends on variables such as race, number of income earners, educational attainment and marital status.
| Households | Persons, age 25 or older with earnings | Household income by race or ethnicity | |||||||
|---|---|---|---|---|---|---|---|---|---|
| All households | Dual earner households |
Per household member |
Males | Females | Both sexes | Asian | Non-Hispanic White | Hispanic (of any race) |
Black |
| $46,326 | $67,348 | $23,535 | $39,403 | $26,507 | $32,140 | $57,518 | $48,977 | $34,241 | $30,134 |
| Measure | Some High School | High school graduate | Some college | Associate's degree | Bachelor's degree or higher | Bachelor's degree | Master's degree | Professional degree | Doctorate degree |
|---|---|---|---|---|---|---|---|---|---|
| Persons, age 25+ w/ earnings | $20,321 | $26,505 | $31,054 | $35,009 | $49,303 | $43,143 | $52,390 | $82,473 | $70,853 |
| Male, age 25+ w/ earnings | $24,192 | $32,085 | $39,150 | $42,382 | $60,493 | $52,265 | $67,123 | $100,000 | $78,324 |
| Female, age 25+ w/ earnings | $15,073 | $21,117 | $25,185 | $29,510 | $40,483 | $36,532 | $45,730 | $66,055 | $54,666 |
| Persons, age 25+, employed full-time | $25,039 | $31,539 | $37,135 | $40,588 | $56,078 | $50,944 | $61,273 | $100,000 | $79,401 |
| Household | $22,718 | $36,835 | $45,854 | $51,970 | $73,446 | $68,728 | $78,541 | $100,000 | $96,830 |
| Bottom 10% | Bottom 20% | Bottom 25% | Middle 33% | Middle 20% | Top 25% | Top 20% | Top 5% | Top 1.5% | Top 1% |
|---|---|---|---|---|---|---|---|---|---|
| $0 to $10,500 | $0 to $18,500 | $0 to $22,500 | $30,000 to $62,500 | $35,000 to $55,000 | $77,500 and up | $92,000 and up | $167,000 and up | $250,000 and up | $350,000 and up |
| Source: US Census Bureau, 2006; income statistics for the year 2005 | |||||||||
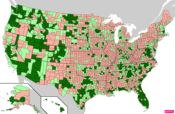
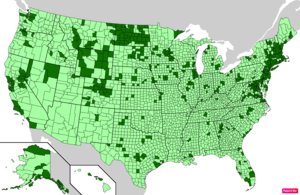
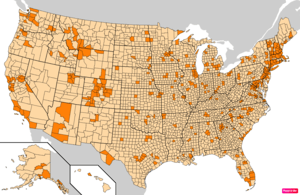 Counties in the United States by the percentage of the over 25-year-old population with bachelor's degrees according to the U.S. Census Bureau American Community Survey 2013–2017 5-Year Estimates.[139] Counties with higher percentages of bachelor's degrees than the United States as a whole are in full orange.
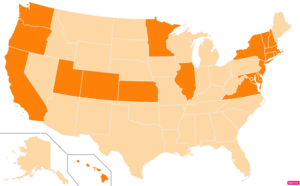 States in the United States by the percentage of the over 25-year-old population with bachelor's degrees according to the U.S. Census Bureau American Community Survey 2013–2017 5-Year Estimates.[139] States with higher percentages of bachelor's degrees than the United States as a whole are in full orange.
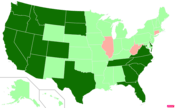
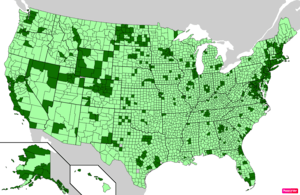
 Counties in the United States by per capita income according to the U.S. Census Bureau American Community Survey 2013–2017 5-Year Estimates.[140] Counties with per capita incomes higher than the United States as a whole are in full green.
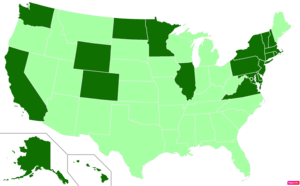 States in the United States by per capita income according to the U.S. Census Bureau American Community Survey 2013–2017 5-Year Estimates.[140] States with per capita incomes higher than the United States as a whole are in full green.
 Counties in the United States by median nonfamily household income according to the U.S. Census Bureau American Community Survey 2013–2017 5-Year Estimates.[140] Counties with median nonfamily household incomes higher than the United States as a whole are in full green.
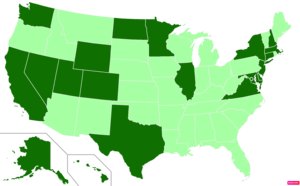 States in the United States by median nonfamily household income according to the U.S. Census Bureau American Community Survey 2013–2017 5-Year Estimates.[140] States with median nonfamily household incomes higher than the United States as a whole are in full green.
 Counties in the United States by median family household income according to the U.S. Census Bureau American Community Survey 2013–2017 5-Year Estimates.[140] Counties with median family household incomes higher than the United States as a whole are in full green.
 States in the United States by median family household income according to the U.S. Census Bureau American Community Survey 2013–2017 5-Year Estimates.[140] States with median family household incomes higher than the United States as a whole are in full green.
Economic class
Social classes in the United States lack distinct boundaries and may overlap. Even their existence (when distinguished from economic strata) is controversial. The following table provides a summary of some prominent academic theories on the stratification of American society:
| Dennis Gilbert, 2002 | William Thompson & Joseph Hickey, 2005 | Leonard Beeghley, 2004 | |||
|---|---|---|---|---|---|
| Class | Typical characteristics | Class | Typical characteristics | Class | Typical characteristics |
| Capitalist class (1%) | Top-level executives, high-rung politicians, heirs. Ivy League education common. | Upper class (1%) | Top-level executives, celebrities, heirs; income of $500,000+ common. Ivy league education common. | The super-rich (0.9%) | Multi-millionaires whose incomes commonly exceed $350,000; includes celebrities and powerful executives/politicians. Ivy League education common. |
| Upper middle class[1] (15%) | Highly-educated (often with graduate degrees), most commonly salaried, professionals and middle management with large work autonomy. | Upper middle class[1] (15%) | Highly-educated (often with graduate degrees) professionals & managers with household incomes varying from the high 5-figure range to commonly above $100,000. | The rich (5%) | Households with net worth of $1 million or more; largely in the form of home equity. Generally have college degrees. |
| Middle class (plurality/ majority?; ca. 46%) |
College-educated workers with considerably higher-than-average incomes and compensation; a man making $57,000 and a woman making $40,000 may be typical. | ||||
| Lower middle class (30%) | Semi-professionals and craftsmen with a roughly average standard of living. Most have some college education and are white-collar. | Lower middle class (32%) | Semi-professionals and craftsmen with some work autonomy; household incomes commonly range from $35,000 to $75,000. Typically, some college education. | ||
| Working class (30%) | Clerical and most blue-collar workers whose work is highly routinized. Standard of living varies depending on number of income earners, but is commonly just adequate. High school education. | ||||
| Working class (32%) | Clerical, pink- and blue-collar workers with often low job security; common household incomes range from $16,000 to $30,000. High school education. | Working class (ca. 40–45%) |
Blue-collar workers and those whose jobs are highly routinized with low economic security; a man making $40,000 and a woman making $26,000 may be typical. High school education. | ||
| Working poor (13%) | Service, low-rung clerical and some blue-collar workers. High economic insecurity and risk of poverty. Some high school education. | ||||
| Lower class (ca. 14–20%) | Those who occupy poorly-paid positions or rely on government transfers. Some high school education. | ||||
| Underclass (12%) | Those with limited or no participation in the labor force. Reliant on government transfers. Some high school education. | The poor (ca. 12%) | Those living below the poverty line with limited to no participation in the labor force; a household income of $18,000 may be typical. Some high school education. | ||
| |||||
Generational cohorts
A definitive recent study of US generational cohorts was done by Schuman and Scott (2012) in which a broad sample of adults of all ages was asked, "What world events are especially important to you?"[141] They found that 33 events were mentioned with great frequency. When the ages of the respondents were correlated with the expressed importance rankings, seven (some put 8 or 9) distinct cohorts became evident.
Today the following descriptors are frequently used for these cohorts:
- Lost Generation – born from approximately 1883 to 1900.
- Greatest Generation – born from approximately 1901 to 1927[142] (in the U.S. the depression cohort who fought and won World War II).
- Silent Generation – born from approximately 1928 to 1945[143] during the Great Depression and World War II.[144] The label was originally applied to people in North America but has also been applied to those in Western Europe, Australasia and South America. It includes most of those who fought during the Korean War.
- Baby Boomers – born from 1946 to 1964.[143]
- Generation X – demographers and researchers typically use birth years ranging from the early-to-mid 1960s to the early 1980s.[145]
- In the U.S., some called Generation Xers the "baby bust" generation because of the drop in the birth rate following the baby boom.[146] The drop in fertility rates in America began in the late 1950s.
- Millennials (also known as Generation Y) – demographers and researchers typically use the early 1980s as starting birth years and the mid-1990s to early 2000s as ending birth years.
- Generation Z (also known as Homelanders, Digital Natives, or Zoomers) – demographers and researchers typically use starting birth years that range from the mid-1990s to mid-2000s, and as of yet there is little consensus about ending birth years.
U.S. demographic birth cohorts
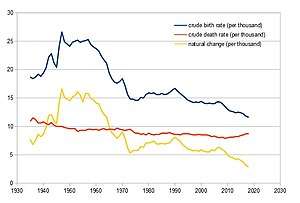
Subdivided groups are present when peak boom years or inverted peak bust years are present, and may be represented by a normal or inverted bell-shaped curve (rather than a straight curve). The boom subdivided cohorts may be considered as "pre-peak" (including peak year) and "post-peak". The year 1957 was the baby boom peak with 4.3 million births and 122.7 fertility rate. Although post-peak births (such as trailing edge boomers) are in decline, and sometimes referred to as a "bust", there are still a relatively large number of births. The dearth-in-birth bust cohorts include those up to the valley birth year, and those including and beyond, leading up to the subsequent normal birth rate. The baby boom began around 1943 to 1946.
From the decline in U.S. birth rates starting in 1958 and the introduction of the birth control pill in 1960, the Baby Boomer normal distribution curve is negatively skewed. The trend in birth rates from 1958 to 1961 show a tendency to end late in the decade at approximately 1969, thus returning to pre-WWII levels, with 12 years of rising and 12 years of declining birth rates. Pre-war birth rates were defined as anywhere between 1939 and 1941 by demographers such as the Taeuber's, Philip M. Hauser and William Fielding Ogburn.[147]
Demographic statistics
Birth, growth and death rates
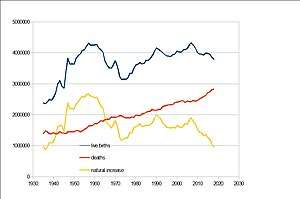
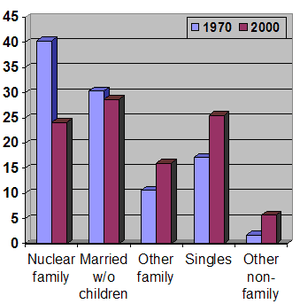
The growth rate is 0.81% as estimated from 2017.[1]
The birth rate is 12.5 births/1,000 population, estimated as of 2017 and 2013. Country comparison to the world: 158th. This was the lowest since records began. There were 3,957,577 births in 2013.[148]
- 13.9 births/1,000 population per year (provisional data for 2008)
- 14.3 births/1,000 population per year (provisional data for 2007)[149]
In 2009, Time magazine reported that 40% of births were to unmarried women.[150] The following is a breakdown by race for unwed births: 17% Asian, 29% White, 53% Hispanics (of any race), 66% Native Americans, and 72% Black American.[151]
The drop in the birth rate from 2007 to 2009 is believed to be associated with the Great Recession.[152]
A study by the Agency for Healthcare Research and Quality (AHRQ) found that more than half (51 percent) of live hospital births in 2008 and 2011 were male.[153]
Per U.S. federal government data released in March 2011, births fell 4% from 2007 to 2009, the largest drop in the U.S. for any two-year period since the 1970s.[154] Births have declined for three consecutive years, and are now 7% below the peak in 2007.[155] This drop has continued through 2010, according to data released by the U.S. National Center for Health Statistics in June 2011.[156] Numerous experts have suggested that this decline is largely a reflection of unfavorable economic conditions.[157] This connection between birth rates and economic downturns partly stems from the fact that American birth rates have now fallen to levels that are comparable to the Great Depression of the 1930s.[158] Teen birth rates in the U.S. are at the lowest level in U.S. history.[159] In fact, teen birth rates in the U.S. have consistently decreased since 1991 through 2011, except for a brief increase between 2005 and 2007.[159] The other aberration from this otherwise steady decline in teen birth rates is the 6% decrease in birth rates for 15- to 19-year-olds between 2008 and 2009.[159] Despite these years of decrease, U.S. teen birth rates are still higher than in other developed nations.[159] Racial differences prevail with teen birth and pregnancy rates as well. The American Indian/Alaska Native, Hispanic, and non-Hispanic black teen pregnancy rates are more than double the non-Hispanic white teen birth rate.[160]
| Age group | Total (of population) |
White alone (of race/age group) |
Black alone (of race/age group) |
Mixed and/or Some Other Race (of race/age group) |
Asian alone (of race/age group) |
Either American Indian or Alaska Native (of race/age group) |
Either Native Hawaiian or Other Pacific Islander (of race/age group) |
|---|---|---|---|---|---|---|---|
| Total | 308745538 (100%) | 223553265 (72.41%) | 38929319 (12.61%) | 28116441 (9.11%) | 14674252 (4.75%) | 2932248 (0.95%) | 540013 (0.17%) |
| 0–4 | 20201362 (6.5%) | 12795675 (5.7%/63.34%) | 2902590 (7.5%/14.37%) | 3315480 (11.8%/16.41%) | 898011 (6.1%/4.45%) | 244615 (8.3%/1.21%) | 44991 (8.3%/0.22%) |
| 5–9 | 20348657 (6.6%) | 13293799 (5.9%/65.33%) | 2882597 (7.4%/14.17%) | 2957487 (10.5%/14.53%) | 928248 (6.3%/4.56%) | 243259 (8.3%/1.20%) | 43267 (8.0%/0.21%) |
| 10–14 | 20677194 (6.7%) | 13737332 (6.1%/66.44%) | 3034266 (7.8%/14.67%) | 2736570 (9.7%/13.23%) | 881590 (6.0%/4.26%) | 245049 (8.4%/1.19%) | 42387 (7.8%/0.20%) |
| 15–19 | 22040343 (7.1%) | 14620638 (6.5%/66.35%) | 3448051 (8.9%/15.64%) | 2704571 (9.6%/12.27%) | 956028 (6.5%/4.34%) | 263805 (9.0%/1.20%) | 47250 (8.7%/0.21%) |
| 20–24 | 21585999 (7.0%) | 14535947 (6.5%/67.34%) | 3111397 (8.0%/14.41%) | 2538967 (9.0%/11.76%) | 1106222 (7.5%/5.12%) | 240716 (8.2%/1.12%) | 52750 (9.8%/0.24%) |
| 25–29 | 21101849 (6.8%) | 14345364 (6.4%/67.98%) | 2786254 (7.2%/13.20%) | 2464343 (8.8%/11.68%) | 1234322 (8.4%/5.85%) | 221654 (7.6%/1.05%) | 49912 (9.2%/0.24%) |
| 30–34 | 19962099 (6.5%) | 13573270 (6.1%/68.00%) | 2627925 (6.8%/13.16%) | 2273322 (8.1%/11.39%) | 1240906 (8.5%/6.22%) | 202928 (6.9%/1.02%) | 43748 (8.1%/0.22%) |
| 35–39 | 20179642 (6.5%) | 13996797 (6.3%/69.36%) | 2613389 (6.7%/12.95%) | 2038408 (7.2%/10.10%) | 1296301 (8.8%/6.42%) | 196017 (6.7%/0.97%) | 38730 (7.2%/0.19%) |
| 40–44 | 20890964 (6.8%) | 15052798 (6.7%/72.05%) | 2669034 (6.9%/12.78%) | 1782463 (6.3%/8.53%) | 1155565 (7.9%/5.53%) | 194713 (6.6%/0.93%) | 36391 (6.7%/0.17%) |
| 45–49 | 22708591 (7.4%) | 17028255 (7.6%/74.99%) | 2828657 (7.3%/12,46%) | 1532117 (5.4%/6.75%) | 1076060 (7.3%/4.74%) | 207857 (7.1%/0.92%) | 35645 (6.6%/0.16%) |
| 50–54 | 22298125 (7.2%) | 17178632 (7.7%/77.04%) | 2694247 (6.9%/12.08%) | 1222175 (4.3%/5.48%) | 980282 (6.7%/4.40%) | 191893 (6.5%/0.86%) | 30896 (5.7%/0.14%) |
| 55–59 | 19664805 (6.4%) | 15562187 (7.0%/79.14%) | 2205820 (5.7%/11.22%) | 873943 (3.1%/4.44%) | 844490 (5.8%/4.29%) | 154320 (5.3%/0.78%) | 24045 (4.5%/0.12%) |
| 60–64 | 16817924 (5.4%) | 13693334 (6.1%/81.42%) | 1686695 (4.3%/10.03%) | 611144 (2.2%/3.63%) | 689601 (4.7%/4.10%) | 118362 (4.0%/0.70%) | 18788 (3.5%/0.11%) |
| 65–69 | 12435263 (4.0%) | 10313002 (4.6%/82.93%) | 1162577 (3.0%/9.35%) | 394208 (1.4%/3.17%) | 474327 (3.2%/3.81%) | 79079 (2.7%/0.64%) | 12070 (2.2%/0.10%) |
| 70–74 | 9278166 (3.0%) | 7740932 (3.5%/83.43%) | 852317 (2.2%/9.19%) | 268574 (1.0%/2.89%) | 354268 (2.4%/3.82%) | 53926 (1.8%/0.58%) | 8149 (1.5%/0.09%) |
| 75–79 | 7317795 (2.4%) | 6224569 (2.8%/85.06%) | 616789 (1.6%/8.43%) | 184596 (0.7%/2.52%) | 251210 (1.7%/3.43%) | 35268 (1.2%/0.48%) | 5363 (1.0%/0.07%) |
| 80–84 | 5743327 (1.9%) | 5002427 (2.2%/87.10%) | 424592 (1.1%/7.39%) | 122249 (0.4%/2.13%) | 168879 (1.2%/2.94%) | 21963 (0.7%/0.38%) | 3217 (0.6%/0.06%) |
| 85+ | 5493433 (1.8%) | 4858307 (2.2%/88.44%) | 382122 (1.0%/6.96%) | 95824 (0.3%/1.74%) | 137942 (0.9%/2.51%) | 16824 (0.6%/0.31%) | 2414 (0.4%/0.04%) |
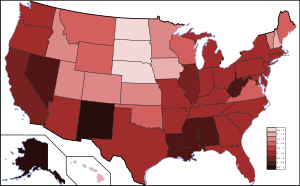
Unemployment rate
As of July 2019, the U.S. unemployment rate was 3.7 percent (U3 rate).
As of July 2018, the U.S. unemployment rate was 3.7 percent (U3 rate).
As of July 2017, the U.S. unemployment rate was 4.3 percent (U3 rate).[162]
As of July 2016, the U.S. unemployment rate was 4.9 percent (U3 rate).[162]
As of July 2015, the U.S. unemployment rate was 5.3 percent (U3 rate).[163]
As of July 2014, the U.S. unemployment rate was 6.2 percent (U3 rate).[162]
The U6 unemployment rate as of April 2017 was 8.6 percent.[164] The U6 unemployment rate counts not only people without work seeking full-time employment (the more familiar U3 rate), but also counts "marginally attached workers and those working part-time for economic reasons." Note that some of these part-time workers counted as employed by U6 could be working as little as an hour a week. And the "marginally attached workers" include those who have gotten discouraged and stopped looking, but still want to work. The age considered for this calculation is 16 years and over.[165]
See also
| This article is part of a series on |
| Income in the United States of America |
|---|
 |
|
Topics
|
|
Lists by income
|
|
|
- Outline of the United States
- Index of United States articles
- Book:United States
- Maps of American ancestries
- Languages of the United States
- Immigration to the United States
- Emigration from the United States
- Places in the United States with notable demographic characteristics
- Demographic history of the United States
- Historical racial and ethnic demographics of the United States
- Race and ethnicity in the United States
- Urbanization in the United States
- Historical Statistics of the United States
- Hispanic and Latino Americans
Lists:
- Births of U.S. states and territories by race/ethnicity
- Lists of U.S. cities with non-white majority populations
- List of metropolitan areas in the Americas
- List of U.S. states and territories by population
Income:
- Household income in the United States
- Personal income in the United States
- Affluence in the United States
- List of highest-income counties in the United States
- List of lowest-income counties in the United States
Population:
- United States
- Demographics of the United States
- United States Census Bureau
- List of U.S. states and territories by population
- List of metropolitan areas of the United States
- List of United States cities by population
- List of United States counties and county-equivalents
- United States Office of Management and Budget
- The OMB has defined 1098 statistical areas comprising 388 MSAs, 541 μSAs, and 169 CSAs
- Primary statistical area – List of the 574 PSAs
- Combined Statistical Area – List of the 169 CSAs
- Core Based Statistical Area – List of the 929 CBSAs
- Metropolitan Statistical Area – List of the 388 MSAs
- Micropolitan Statistical Area – List of the 541 μSAs
- Primary statistical area – List of the 574 PSAs
- The OMB has defined 1098 statistical areas comprising 388 MSAs, 541 μSAs, and 169 CSAs
- United States Census Bureau
- United States urban area – List of United States urban areas
Notes
- Excludes American citizens overseas who are not US government employees or the dependent of a US government employee.
- In fertility rates, 2.1 and above is a stable population and has been marked blue, 2 and below leads to an aging population and the result is that the population decreases.
References
- "NORTH AMERICA :: UNITED STATES". CIA.gov. Central Intelligence Agency. Retrieved February 11, 2020.
- Xu, Jiaquan; Murphy, Sherry; Kochanek, Kenneth; Arias, Elizabeth (January 2020). "Mortality in the United States, 2018" (PDF). CDC.
- "Age and Sex Composition: 2010" (PDF). United States Census Bureau. p. 6.
- Kaczke, Lisa. "South Dakota recognizes official indigenous language". Argus Leader.
- "Population Clock". United States Census Bureau.
- "CIA World Factbook – Field Listing – Population growth rate". CIA. Retrieved January 9, 2012.
- "National Vital Statistics Reports. Births: Provisional Data for 2018" (PDF). Cdc.gov. Retrieved May 17, 2019.
- "National Vital Statistics Reports. Births: Final Data for 2017" (PDF). Cdc.gov. Retrieved December 27, 2018.
- "Statistical Abstract of the United States" (PDF). United States Census Bureau.
- "U.S. population hits 300 million mark". MSNBC. Associated Press. October 17, 2006. Archived from the original on October 17, 2006. Retrieved October 17, 2006.
- Morello, Carol and Mellnik, Ted. "Census: Minority Babies Are Now Majority in United States." Washington Post. May 17, 2012. Accessed May 17, 2012.
- "B03002 Hispanic or Latino Origin by Race - United States - 2017 American Community Survey 1-Year Estimates". U.S. Census Bureau. July 1, 2017. Archived from the original on February 13, 2020. Retrieved October 11, 2018.
- "HISP Hispanic recode 24 Recodes RACWHT Race includes White with Hispanic recode - ACS 1-Year Estimates - Public Use Microdata Sample (2018)". Retrieved April 8, 2020.
- Frey, William H. (March 14, 2018). "The US will become 'minority white' in 2045, Census projects".
- "U.S. Census Bureau: Minority Population Tops 100 Million". Archived from the original on September 18, 2008.
- "U.S. Population Projections: 2005–2050". Pewhispanic.org. Pew Hispanic Center. February 11, 2008. Retrieved September 19, 2011.
- "United States Population Projections: 2000 to 2050" (PDF). U.S. Census Bureau. Retrieved June 6, 2019.
- "World Population Prospects: The 2006 Revision, Highlights, Working Paper No. ESA/P/WP.202; Table A.2" (PDF). United Nations, Department of Economic and Social Affairs, Population Division (2007). Retrieved January 10, 2009.
- "Births: Final Data for 2010" (PDF). Cdc.gov. Retrieved October 3, 2017.
- "DP05 – ACS DEMOGRAPHIC AND HOUSING ESTIMATES". U.S. Census Bureau. Archived from the original on February 14, 2020. Retrieved October 17, 2019.
- "GCT-PH1 – Population, Housing Units, Area, and Density: 2010 - United States -- States; and Puerto Rico". U.S. Census Bureau. Archived from the original on February 14, 2020. Retrieved October 17, 2019.
- "PEPANNRES – Annual Estimates of the Resident Population: April 1, 2010 to July 1, 2018". U.S. Census Bureau. Archived from the original on February 14, 2020. Retrieved October 17, 2019.
- US life expectancy has been declining. Here’s why Upton Saiidi, CNBC Markets, July 9, 2019
- "Table 13. State Population – Rank, Percent Change, and Population Density". U.S. Census Bureau. 2008. Archived from the original (Excel) on September 23, 2015. Retrieved October 24, 2010.
- "Mean Center of Population for the United States: 1790 to 2000" (PDF). U.S. Census Bureau. Archived from the original (PDF) on November 3, 2001. Retrieved October 24, 2010.
- "Annual Estimates of the Resident Population for Incorporated Places over 110,000, Ranked by July 1, 2009 Population: April 1, 2000 to July 1, 2009 (SUB-EST2009-01)". U.S. Census Bureau. Archived from the original on October 18, 2010. Retrieved May 19, 2011.
- "Births: Final Data for 2014" (PDF). Cdc.gov. Retrieved October 3, 2017.
- "National Vital Statistics Reports. Births: Final Data for 2015" (PDF). Cdc.gov. Retrieved October 3, 2017.
- Susan Perry (January 11, 2019). "U.S. fertility rate continues to decline, reaching lowest level in 40 years". MinnPost.
- Steven A. Camarota; Karen Zeigler. "The Declining Fertility of Immigrants and Natives" (PDF). Cis.org. Retrieved October 3, 2017.
- Radford, Jynnah (June 17, 2019). "Key findings about U.S. immigrants". FactTank - News in the Numbers. Pew Research Center. Retrieved January 12, 2020.
- "Largest region-of-birth group of immigrants in US" (PDF). Census.gov. Archived from the original (PDF) on February 9, 2015. Retrieved October 3, 2017.
- "Latin America: Introduction". sites.fas.harvard.edu.
- "Table 2. Persons Obtaining Lawful Permanent Resident Status by Region and Selected Country of Last Residence: Fiscal Years 2016 to 2018". Yearbook of Immigration Statistics. Department of Homeland Security. December 19, 2019. Retrieved January 12, 2020.
- "Frequently Requested Statistics on Immigrants and Immigration in the United States". Migration Policy Institute. March 14, 2019.
- "Table 1. Persons Obtaining Lawful Permanent Resident Status: Fiscal Years 1820 to 2018". Yearbook of Immigration Statistics. Department of Homeland Security. December 19, 2019. Retrieved January 12, 2020.
- "Table 6. Persons Obtaining Lawful Permanent Resident Status by Type and Major Class of Admission: Fiscal Years 2016 to 2018". Yearbook of Immigration Statistics. Department of Homeland Security. December 19, 2019. Retrieved January 12, 2020.
- "United States of America: historical demographical data of the whole country". Population Statistics. Jan Lahmeyer. January 22, 2000. Archived from the original on July 23, 2019. Retrieved October 16, 2013.
- "Data Access - Vital Statistics Online". www.cdc.gov. May 13, 2019.
- 1960 to 2011"United States – Death rate: Death rate, crude (per 1,000 people)". Index Mundi. IndexMundi. Retrieved October 24, 2013.
- HISTORICAL STATISTICS of the United States – COLONIAL TIMES TO 1970 – Part 1 (PDF) (Bicentennial ed.), U.S. Department of Commerce. Bureau of Census, 1975, pp. 19, 50
- "Products - Data Briefs - Number 328 - November 2018". www.cdc.gov. June 7, 2019.
- "2019 U.S. Population Estimates Continue to Show the Nation's Growth Is Slowing". U.S. Census Bureau. December 30, 2019. Retrieved December 30, 2019.
- "Mortality in the United States, 2018". Centers for Disease Control and Prevention. January 29, 2020. Retrieved January 30, 2020.
- "Vital Statistics Rapid Release – State and National Provisional Counts". Center for Disease Control and Prevention. October 30, 2019. Retrieved October 31, 2019.
- 2-11-Z-COLONIAL & PRE-FEDERAL.pdf. (PDF). Retrieved on June 16, 2013.
- Resident Population Data. "Resident Population Data – 2010 Census". www.census.gov. Retrieved February 22, 2013.
- Historical Census Statistics on Population Totals By Race, 1790 to 1990... Archived July 25, 2008, at the Wayback Machine. U.S. Census Bureau. Retrieved May 28, 2013.
- "Demographics Trends in the 20th Century Archived January 20, 2012, at the Wayback Machine". U.S. Census Bureau.
- "We the Americans: Blacks". Census.gov.
- "Latinos and the Changing Face of America – Population Reference Bureau Archived May 19, 2012, at the Wayback Machine"
- "Not Just Black and White: Historical and Contemporary Perspectives on Immigration, Race, and Ethnicity in the United States". Nancy Foner, George M. Fredrickson (2005). p. 120. ISBN 0-87154-270-6
- "Immigrants in the United States and the Current Economic Crisis", Demetrios G. Papademetriou and Aaron Terrazas, Migration Policy Institute, April 2009.
- "Immigration Worldwide: Policies, Practices, and Trends". Uma A. Segal, Doreen Elliott, Nazneen S. Mayadas (2010). Oxford University Press US. p. 32. ISBN 0-19-538813-5
- Borjas, George J. (2003). "Welfare reform, labor supply, and health insurance in the immigrant population". Journal of Health Economics. 22 (6): 933–958. CiteSeerX 10.1.1.517.7531. doi:10.1016/j.jhealeco.2003.05.002. ISSN 0167-6296. PMID 14604554.
- ""The First Measured Century: An Illustrated Guide to Trends in America, 1900–2000"". Public Broadcasting Service (PBS).
- Exner, Rich (July 3, 2012). "Americans under age 1 now mostly minorities, but not in Ohio: Statistical Snapshot". The Plain Dealer. Retrieved July 29, 2012.
- "Non-white births outnumber white births for the first time in US". The Daily Telegraph. May 17, 2012.
- Bureau, U.S. Census. "American FactFinder – Results". Factfinder2.census.gov. Archived from the original on February 12, 2020. Retrieved October 3, 2017.
- Jacqueline Howard (January 10, 2019). "US fertility rate is below level needed to replace population, study says". CNN.
- T.J. Mathews, M.S.; Brady E. Hamilton, Ph.D (January 10, 2019). "Total Fertility Rates by State and Race and Hispanic Origin: United States, 2017" (PDF). Centers for Disease Control and Prevention.
- Sabrina Tavernise (June 20, 2018). "Fewer Births Than Deaths Among Whites in Majority of U.S. States". The New York Times.
- Marie Patino (May 15, 2019). "U.S. Births Fell to Lowest Level in 32 Years in 2018". Bloomberg News.
- A Look at the 1940 Census (PDF), United States Census Bureau, pp. 9, 10, 11, 12, 13
- Jay Weinstein; Vijayan K. Pillai (2016), Demography: The Science of Population (Second ed.), p. 208, ISBN 9781442235212
- "Life expectancy". Our World in Data. Retrieved August 28, 2018.
- "World Population Prospects – Population Division – United Nations". esa.un.org. Archived from the original on September 19, 2016. Retrieved August 25, 2018.
- Frank Hobbs; Nicole Stoops (November 2002). "Demographic Trends in the 20th Century. Census 2000 Special Reports" (PDF). U.S. Census Bureau, U.S. Department of Commerce. pp. 56, 77.
- "FEATURE ARTICLE 1: POPULATION BY AGE AND SEX, AUSTRALIAN STATES AND TERRITORIES". Australian Bureau of Statistics. December 16, 2011.
- "The 2012 Global Cities Index". Retrieved January 5, 2013. Cite journal requires
|journal=(help) - "The World According to GaWC – Classification of cities 2010". 2010. Archived from the original on October 10, 2013. Retrieved January 5, 2013.
- "American cities on the rebound". CBS News. August 5, 2011. Retrieved May 8, 2013.
- "Appendix A. Census 2000 Geographic Terms and Concepts – Figure A–3. Census Regions, Census Divisions, and Their Constituent States" (PDF). U.S. Census Bureau. 2000. p. 27. Archived from the original (PDF) on June 14, 2007. Retrieved February 25, 2017.
- "2010 Census Demographic Profile Summary File" (PDF). U.S. Census Bureau. Retrieved August 25, 2017.
- "About Race". United States Census Bureau.
- "ACS Demographic and Housing Estimates – 2011–2015". U.S. Census Bureau. Archived from the original on February 13, 2020. Retrieved August 26, 2017.
- "Annual Estimates of the Resident Population by Sex, Age, Race, and Hispanic Origin for the United States and States: April 1, 2010 to July 1, 2017". United States Census Bureau. June 2018. Retrieved April 29, 2019.
- KATHERINE SCHAEFFER (July 30, 2019). "The most common age among whites in U.S. is 58 – more than double that of racial and ethnic minorities". Pew Research Center.
- National Center for Education Statistics (February 2019). "Indicator 1: Population Distribution".
- D’VERA COHN (June 26, 2014). "Falloff in births slows shift to a majority-minority youth population". Pew Research Center.
- "About Hispanic Origin". U.S. Census Bureau. Retrieved August 26, 2017.
- "Federal Register" (PDF). Retrieved September 14, 2016.
- Kanell, Michael E. (November 16, 2009). "Number of veterans, October". Atlanta Constitution-Journal. Atlanta, Georgia. pp. A6. quoting the Bureau of Labor Statistics
- Davenport, Christian (April 20, 2010). "A disconnect at Magruder". Washington Post. Washington, DC. pp. B1.
- Hsu, Spencer S. (May 2, 2010). "Senate Democrats' plan highlights nation's shift to the right on immigration". Washington Post. Washington, DC. pp. A3.
- NW, 1615 L. St; Suite 800Washington; Inquiries, DC 20036USA202-419-4300 | Main202-857-8562 | Fax202-419-4372 | Media. "How European and U.S. unauthorized immigrant populations compare". Pew Research Center. Retrieved January 7, 2020.
- Gerson, Michael (January 5, 2010). "Column:More second chances". Florida Today. Melbourne, Florida. pp. 7A.
- "2000 Census information on Gay and Lesbian Couples". gaydemographics.org. Archived from the original on July 1, 2009.
- Gary J. Gates "Same-sex Couples and the Gay, Lesbian, Bisexual Population: New Estimates from the American Community Survey" (PDF). Archived from the original (PDF) on July 2, 2007. (2.07 MB). The Williams Institute on Sexual Orientation Law and Public Policy, UCLA School of Law October 2006. Retrieved April 20, 2007.
- Gates, Gary. "How many people are lesbian, gay, bisexual, and transgender?" (PDF). The Williams Institute, UCLA School of Law. Retrieved February 24, 2019.
- "Research 4M adults in US identify as gay". Florida Today. Melbourne, Florida. March 1, 2011. pp. 1A.
- "2012 National Population Projections: Summary Tables – People and Households – U.S. Census Bureau – Table 6: Percent Distribution of the Projected Population by Race and Hispanic Origin for the United States: 2015 to 2060 (middle series)". Census.gov. Archived from the original on September 15, 2014. Retrieved December 7, 2017.
- "Table 4. Projections of the Population by Sex, Race, and Hispanic Origin for the United States: 2010 to 2050". U.S. Census Bureau. Archived from the original (Excel) on March 27, 2010. Retrieved October 24, 2010.
- U.S. Hispanic population to triple by 2050, USATODAY.com
- "White Americans no longer a majority by 2042". Archived from the original on August 24, 2008.
- Aizenman, N.C. (August 13, 2008). "U.S. to Grow Grayer, More Diverse". The Washington Post. Retrieved May 8, 2013.
- Passel, Jeffrey (February 11, 2008). "Pew Research Center: Immigration to Play Lead Role In Future U.S. Growth". Pewresearch.org. Archived from the original on January 3, 2010. Retrieved May 8, 2013.
- "Whites to become minority in U.S. by 2050". Reuters. February 12, 2008.
- Archived copy at the Library of Congress (September 17, 2008)., U.S. Census Press Releases, August 14, 2008 (archived from the original on August 22, 2008)
- "The Majority of American Babies Are Now Minorities". Bloomberg. July 25, 2015.
- "United States Population 2018", World Population Review
- Jeffrey S. Passel; D'Vera Conh (February 11, 2008), U.S. Population Projections: 2005–2050
- "United Nations, Department of Economic and Social Affairs, Population Division (2019). World Population Prospects 2019". 2019. Retrieved August 21, 2019.
- "PLACE OF BIRTH FOR THE FOREIGN-BORN POPULATION IN THE UNITED STATES. Universe: Foreign-born population excluding population born at sea more information. 2017 American Community Survey 1-Year Estimates". United States Census Bureau. Archived from the original on February 14, 2020. Retrieved August 6, 2019.
- Elijah Alperin; Jeanne Batalova (August 1, 2018). "European Immigrants in the United States - Immigration Pathways and Naturalization". Migration Policy Institute.
- "HOW ARE WE COUNTED?". American Citizens Abroad. April 2017. Retrieved September 22, 2019.
The Federal Voting Assistance Program (FVAP) estimates that there are 4.5 million to 6.5 million overseas Americans while the State Department's most recent calculation (April 2015) of US citizens living overseas is 8.7 million{...}US citizens living outside the US who are not employed by the US Government, including dependents living with them - Not counted in the census.
- These are our Numbers: Civilian Americans Overseas and Voter Turnout Archived October 24, 2013, at the Wayback Machine, By Dr. Claire M. Smith (Originally published: OVF Research Newsletter, vol. 2, issue 4 (Aug), 2010)
- Trow, Steve; Bruce, Charles (March 26, 2007). "U.S. Citizens Who Don't Know It" (PDF). Legal Times. 30 (13). Retrieved November 3, 2014.
- Newport, Frank. "2017 Update on Americans and Religion". Gallup. Retrieved February 25, 2019.
- Table No. 68. Religious Bodies—Selected Data (p. 59), "Statistical Abstract of the United States: 2004–2005 (tables 67–69)" (PDF). U.S. Census Bureau.
- "Statistical Abstract of the United States: 2004–2005 (tables 67–69)" (PDF). U.S. Census Bureau.
- "Statistics on Religion in America Report – Pew Forum on Religion & Public Life". Pewforum.org.
- "America's Changing Religious Landscape". Pewforum.org. Pew Research Center's Religion & Public Life Project. May 12, 2015. Retrieved October 9, 2016.
- "In U.S., Decline of Christianity Continues at Rapid Pace". Pewforum.org. October 17, 2019. Retrieved October 19, 2019.
- American Baptist Association - Membership Data Association of Religion Data Archives
- SUMMARY OF DENOMINATIONAL STATISTICS American Baptist Churches U.S.A.
- AG Churches, Membership, Adherents and Ministers 1960-2018 ag.org
- Baptist Bible Fellowship International - Membership Data Association of Religion Data Archives
- Baptist Missionary Association of America - Membership Data Association of Religion Data Archives
- "Disciples of Christ Claim Distinction of Fastest Declining Church". Retrieved November 14, 2019.
- CHURCHES OF CHRIST in the UNITED STATES - Statistical Summary 21stcc.com
- "Table of Statistics of the Episcopal Church From 2018 Parochial Reports" (PDF). episcopalchurch.org. 2018. Archived from the original (PDF) on September 5, 2019. Retrieved September 9, 2019.
- "ELCA Facts". elca.org. Evangelical Lutheran Church in America. Archived from the original on September 25, 2016. Retrieved August 16, 2019.
- Greek Orthodox Archdiocese of America - Membership Data Association of Religion Data Archives
- "The Lutheran Church - Missouri Synod Facts". Retrieved June 9, 2019.
- National Association of Free Will Baptists - Membership Data Association of Religion Data Archives
- Statistics Baptist World Alliance
- Orthodox Church in America - Membership Data Association of Religion Data Archives
- "Statistics PCUSA 2018" (PDF). Retrieved June 3, 2019.
- Church Statistical Data Reformed Church in America
- "Adherents.com". Adherents.com. Retrieved September 19, 2011.
- "Section 1. Population" (PDF). Statistical Abstract of the United States: 2004–2005. U.S. Census Bureau. p. 55. Retrieved June 29, 2008. (Table No. 67. Self-described religious identification of adult population: 1990 and 2001; data for 2001).
- "SBC: Giving increases while baptisms continue decline". Baptist Press. Retrieved May 25, 2019.
- "UMData". www.umdata.org.
- "2019 WELS Annual Report". Wisconsin Evangelical Lutheran Synod. Retrieved July 23, 2019.
- By 2040, Islam will be second largest religion in US: Study, Hindustan Times, January 12, 2018.
- Barry A. Kosmin and Ariela Keysar (2009). "American Religious Identification Survey (ARIS) 2008" (PDF). Hartford, Connecticut, USA: Trinity College. Archived from the original (PDF) on April 7, 2009. Retrieved April 1, 2009.
- "Religion in America: U.S. Religious Data, Demographics and Statistics". Pew Research Center. Retrieved October 19, 2019.
- "S1501 – EDUCATIONAL ATTAINMENT". U.S. Census Bureau. Archived from the original on January 22, 2019. Retrieved October 17, 2019.
- "DP03 – SELECTED ECONOMIC CHARACTERISTICS". U.S. Census Bureau. Archived from the original on February 14, 2020. Retrieved October 17, 2019.
- Schuman, H. and Scott, J. (1989), Generations and collective memories, American Sociological Review, vol. 54, 1989, pp. 359–81.
- Deane, Claudia (December 15, 2016). "Americans Name the 10 Most Significant Historic Events of Their Lifetimes". Pew Research Center. Retrieved April 12, 2019.
- Dimock, Michael (January 17, 2019). "Defining generations: Where Millennials end and Generation Z begins". Pew Research Center. Retrieved April 12, 2019.
- "People: The Younger Generation". Time.com. November 5, 1951.
- Miller, Jon D. "The Generation X Report: Active, Balanced, and Happy: These Young Americans are not bowling alone" (PDF). University of Michigan, Longitudinal Study of American Youth, funded by the National Science Foundation. Retrieved October 30, 2012.
- Encyclopedia of Identity By Ronald L. Jackson, II
- Tuttle, William M. (1993). "Daddy's Gone to War": The Second World War in the Lives of America's Children. Oxford University Press, US. p. 25. ISBN 9780195096491. Retrieved March 17, 2014.
- Marchione, Marilynn (August 27, 2010). "Recession may have pushed U.S. birth rate to a new low". USA Today. Associated Press. Retrieved October 9, 2010.
- Births, Marriages, Divorces, and Deaths: Provisional Data for 2009 National Vital Statistics Reports Volume 58, Number 25, accessed August 28, 2010
- Amy Sullivan (March 20, 2009). "Behind the Boom in Adult Single Motherhood". Time.com.
- "Blacks rank highest in unwed births". Florida Today. Melbourne, Florida. November 7, 2010. pp. 9A.
- "Birthrate Is Lowest in a Century" Associated Press article printed in The New York Times August 27, 2010, accessed August 28, 2010
- Kowlessar N.M., Jiang H.J., and Steiner C. "Hospital Stays for Newborns, 2011." HCUP Statistical Brief #163. October 2013. Agency for Healthcare Research and Quality, Rockville, MD.
- Roan, Shari (March 31, 2011). "Drop in U.S. birth rate is the biggest in 30 years". Los Angeles Times.
- "America's Birth Rate Declined For The Third Year Running". Businessinsider.com.
- "America's Birth Rate Declined For The Third Year Running". Businessinsider.com.
- "Health and Wellness". Usatoday.com.
- "Lower birth rate blamed on the economy - wzzm13.com". Archiver.is. February 9, 2013. Archived from the original on February 9, 2013. Retrieved October 3, 2017.
- "CDC Features". Centers for Disease Control and Prevention. June 27, 2019. Archived from the original on July 4, 2011.
- "CDC Features – Teen Birth Rates Drop, But Disparities Persist". Cdc.gov. March 6, 2020.
- Current Unemployment Rates for States and Historical Highs/Lows, U.S. Bureau of Labor Statistics
- "Seasonally Adjusted Unemployment Rate". U.S. Dept. of Labor. Retrieved September 19, 2016.
- "Employment Situation Summary". U.S. Dept. of Labor. July 2, 2015. Retrieved December 26, 2015.
- "Table A-15. Alternative measures of labor underutilization". U.S. Bureau of Labor. Retrieved November 13, 2011.
- "U6 Unemployment Rate". Portal Seven. Retrieved September 19, 2011.
- Fishkind, Hank (March 15, 2014). "Harsh winters make Florida attractive for visitors, moves". Florida Today. Melbourne, Florida. pp. 4A. Archived from the original on July 10, 2015. Retrieved March 28, 2014.
External links
| Wikimedia Commons has media related to Demographics of the United States. |
| Wikinews has related news: US population reaches 300 million |
- United States Census Bureau
- New York Times: "Mapping the 2010 U.S. Census"
- 2000 Census of Population and Housing United States, U.S. Census Bureau
- Asian-Nation: Demographics of Asian American /2006-07-04-us-population_x.htm?csp=34 Countdown to 300 million
- Census Ancestry Map
- USA Today 2004 Election County by County Map
- Google – public data "Population in the U.S.A."