Warren County, Pennsylvania
Warren County is a county located in the U.S. state of Pennsylvania. As of the 2010 census, the population was 41,815.[1] Its county seat is Warren.[2] The county was formed in 1800 from parts of Allegheny and Lycoming counties; attached to Crawford County until 1805 and then to Venango County until Warren was formally organized in 1819.[3]
Warren County | |
|---|---|
 Warren County Courthouse | |
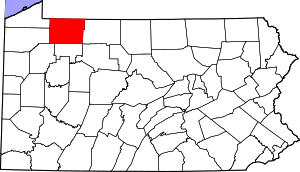 Location within the U.S. state of Pennsylvania | |
 Pennsylvania's location within the U.S. | |
| Coordinates: 41°49′N 79°16′W | |
| Country | |
| State | |
| Founded | October 1, 1819 |
| Named for | Joseph Warren |
| Seat | Warren |
| Largest city | Warren |
| Area | |
| • Total | 899 sq mi (2,330 km2) |
| • Land | 884 sq mi (2,290 km2) |
| • Water | 14.1 sq mi (37 km2) 1.6%% |
| Population | |
| • Estimate (2018) | 39,498 |
| • Density | 46/sq mi (18/km2) |
| Time zone | UTC−5 (Eastern) |
| • Summer (DST) | UTC−4 (EDT) |
| Congressional district | 15th |
| Website | www |
Warren County makes up the Warren, PA Micropolitan Statistical Area.
Geography
According to the U.S. Census Bureau, the county has a total area of 899 square miles (2,330 km2), of which 884 square miles (2,290 km2) is land and 14 square miles (36 km2) (1.6%) is water.[4] Notable physical features include the Allegheny River, the Allegheny Reservoir, the Kinzua Dam, and the Allegheny National Forest. The county has a warm-summer humid continental climate (Dfb) and average temperatures in the city of Warren range from 24.5 °F in January to 69.3 °F in July.
Adjacent counties
- Chautauqua County, New York (north)
- Cattaraugus County, New York (northeast)
- McKean County (east)
- Elk County (southeast)
- Forest County (south)
- Venango County (southwest)
- Crawford County (west)
- Erie County (west)
National protected area
- Allegheny National Forest (part)
- Allegheny National Recreation Area (part)
Demographics
| Historical population | |||
|---|---|---|---|
| Census | Pop. | %± | |
| 1800 | 233 | — | |
| 1810 | 827 | 254.9% | |
| 1820 | 1,976 | 138.9% | |
| 1830 | 4,697 | 137.7% | |
| 1840 | 9,278 | 97.5% | |
| 1850 | 13,671 | 47.3% | |
| 1860 | 19,190 | 40.4% | |
| 1870 | 23,897 | 24.5% | |
| 1880 | 27,981 | 17.1% | |
| 1890 | 37,585 | 34.3% | |
| 1900 | 38,946 | 3.6% | |
| 1910 | 39,573 | 1.6% | |
| 1920 | 40,024 | 1.1% | |
| 1930 | 41,453 | 3.6% | |
| 1940 | 42,789 | 3.2% | |
| 1950 | 42,698 | −0.2% | |
| 1960 | 45,582 | 6.8% | |
| 1970 | 47,682 | 4.6% | |
| 1980 | 47,449 | −0.5% | |
| 1990 | 45,050 | −5.1% | |
| 2000 | 43,863 | −2.6% | |
| 2010 | 41,815 | −4.7% | |
| Est. 2018 | 39,498 | [5] | −5.5% |
| U.S. Decennial Census[6] 1790-1960[7] 1900-1990[8] 1990-2000[9] 2010-2017[1] | |||
As of the census[10] of 2000, there were 43,863 people, 17,696 households, and 12,121 families residing in the county. The population density was 50 people per square mile (19/km²). There were 23,058 housing units at an average density of 26 per square mile (10/km²). The racial makeup of the county was 98.68% White, 0.21% Black or African American, 0.19% Native American, 0.27% Asian, 0.02% Pacific Islander, 0.12% from other races, and 0.52% from two or more races. 0.34% of the population were Hispanic or Latino of any race. 22.2% were of German, 12.4% Swedish, 11.2% American, 10.5% Irish, 8.8% English, 8.2% Italian, and 5.1% Polish ancestry.
There were 17,696 households out of which 29.80% had children under the age of 18 living with them, 56.10% were married couples living together, 8.40% had a female householder with no husband present, and 31.50% were non-families. 27.20% of all households were made up of individuals and 12.20% had someone living alone who was 65 years of age or older. The average household size was 2.42 and the average family size was 2.93.
In the county, the population was spread out with 24.10% under the age of 18, 6.40% from 18 to 24, 27.00% from 25 to 44, 25.90% from 45 to 64, and 16.70% who were 65 years of age or older. The median age was 40 years. For every 100 females there were 96.20 males. For every 100 females age 18 and over, there were 92.80 males.
- County poverty demographics
According to research by The Center for Rural Pennsylvania, which is a legislative agency of the Pennsylvania General Assembly, the poverty rate for Warren County was 14.1% in 2014.[11] The statewide poverty rate was 13.6% in 2014. The 2012 childhood poverty rate by school district was: Warren County School District - 46.1% living at 185% or below than the Federal Poverty Level and Titusville Area School District - 57.9%.[12] The child poverty rate is collected by the school districts as part of them operating the federal, free school lunch program.
- Birth rate
Warren County's live birth rate was 566 births in 1990. The County's live birth rate in 2000 declined to 494 births, while in 2011 it had declined further to 392 babies.[13][14][15] From 1960 to 2010, rural Pennsylvania has experienced an ongoing decline in the number of residents under 18 years old.[16]
- Teen Pregnancy rate
Warren County had a 257 babies born to teens (age15-19) in 2011. In 2015, the number of teen births in Warren County was 247.[17]
Government
| Year | Republican | Democratic | Third parties |
|---|---|---|---|
| 2016 | 67.7% 12,477 | 27.9% 5,145 | 4.4% 812 |
| 2012 | 57.9% 10,010 | 40.4% 6,995 | 1.7% 294 |
| 2008 | 51.9% 9,685 | 45.7% 8,537 | 2.4% 441 |
| 2004 | 57.1% 10,999 | 41.7% 8,044 | 1.2% 230 |
| 2000 | 52.9% 9,290 | 42.9% 7,537 | 4.1% 725 |
| 1996 | 41.3% 7,056 | 42.7% 7,291 | 15.9% 2,720 |
| 1992 | 35.7% 6,585 | 37.8% 6,972 | 26.4% 4,869 |
| 1988 | 56.2% 8,991 | 42.5% 6,790 | 1.3% 214 |
| 1984 | 62.9% 10,838 | 36.3% 6,244 | 0.8% 139 |
| 1980 | 57.4% 9,165 | 34.8% 5,560 | 7.8% 1,249 |
| 1976 | 52.6% 8,508 | 45.8% 7,412 | 1.6% 250 |
| 1972 | 66.1% 10,018 | 32.2% 4,877 | 1.8% 272 |
| 1968 | 55.7% 8,889 | 39.9% 6,368 | 4.5% 711 |
| 1964 | 35.8% 5,965 | 63.6% 10,598 | 0.6% 94 |
| 1960 | 63.8% 11,611 | 35.9% 6,525 | 0.3% 59 |
| 1956 | 72.9% 12,145 | 26.8% 4,463 | 0.3% 43 |
| 1952 | 71.6% 11,555 | 27.5% 4,442 | 1.0% 153 |
| 1948 | 65.4% 8,378 | 32.0% 4,103 | 2.6% 333 |
| 1944 | 67.0% 9,276 | 32.1% 4,440 | 1.0% 137 |
| 1940 | 65.0% 11,016 | 34.4% 5,825 | 0.6% 101 |
| 1936 | 50.3% 9,440 | 45.3% 8,495 | 4.4% 832 |
| 1932 | 57.2% 7,872 | 38.2% 5,254 | 4.6% 627 |
| 1928 | 80.2% 12,077 | 18.8% 2,835 | 1.0% 144 |
| 1924 | 70.9% 8,502 | 18.0% 2,161 | 11.0% 1,323 |
| 1920 | 65.1% 7,791 | 18.2% 2,180 | 16.7% 2,003 |
| 1916 | 47.8% 3,413 | 36.8% 2,628 | 15.4% 1,100 |
| 1912 | 21.6% 1,564 | 23.2% 1,686 | 55.2% 4,008 |
| 1908 | 62.0% 4,672 | 27.3% 2,054 | 10.7% 806 |
| 1904 | 68.6% 4,737 | 17.7% 1,222 | 13.7% 949 |
| 1900 | 64.9% 5,609 | 28.9% 2,500 | 6.2% 536 |
| 1896 | 58.7% 4,846 | 36.9% 3,048 | 4.4% 361 |
| 1892 | 51.9% 3,838 | 37.0% 2,735 | 11.1% 821 |
| 1888 | 55.8% 4,329 | 34.0% 2,640 | 10.2% 795 |
State Senate[19]
- Scott E. Hutchinson, Republican, Pennsylvania's 21st Senatorial District
- Michele Brooks, Republican, Pennsylvania's 50th Senatorial District
State House of Representatives[19]
- Kathy Rapp, Republican, Pennsylvania's 65th Representative District
United States House of Representatives
United States Senate
- Pat Toomey, Republican
- Bob Casey, Jr., Democrat
Micropolitan Statistical Area
The United States Office of Management and Budget[20] has designated Warren County as the Warren, PA Micropolitan Statistical Area (µSA).[21] As of the 2010 U.S. Census[22] the micropolitan area ranked 14th most populous in the State of Pennsylvania and the 298th most populous in the United States with a population of 41,815.
Education
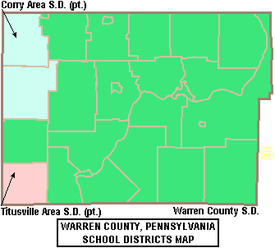
Public school districts
- Corry Area School District
- Titusville Area School District
- Warren County School District (four high schools)
Charter schools
- Tidioute Community Charter School
Private schools
- Beaver Valley Amish School
- Calvary Chapel Christian School
- Cozy Corners Amish School
- Early Childhood Learning Center
- Forest Amish School
- HR Rouse Children's Center
- Little Ash Parochial School, Sugar Grove
- Meadow View Amish School, Sugar Grove
- Pine Ridge School
- Railroad School
- Round Hill School
- Ruth Smith Children's Home
- St Joseph School
- Stoney Run Amish School
- Warren County Christian School
per Education Names and Addresses directory which is annually developed by the Pennsylvania Department of Education, 2016
Recreation
There is one Pennsylvania state park in Warren County. Chapman State Park is adjacent to Allegheny National Forest and State Game Land 29 just of U.S. Route 6, near Clarendon. Warren County also contains a tract of old-growth forest called Hearts Content National Scenic Area.
Communities

Under Pennsylvania law, there are four types of incorporated municipalities: cities, boroughs, townships, and, in at most two cases, towns. The following cities, boroughs and townships are located in Warren County:
City
- Warren (county seat)
Boroughs
Townships
Census-designated places
Census-designated places are geographical areas designated by the U.S. Census Bureau for the purposes of compiling demographic data. They are not actual jurisdictions under Pennsylvania law.
Unincorporated communities
Some communities are neither incorporated nor treated as census-designated places.
Ghost towns
Population ranking
The population ranking of the following table is based on the 2010 census of Warren County.[22]
† county seat
| Rank | City/Town/etc. | Municipal type | Population (2010 Census) |
|---|---|---|---|
| 1 | † Warren | City | 9,710 |
| 2 | North Warren | CDP | 1,934 |
| 3 | Youngsville | Borough | 1,729 |
| 4 | Russell | CDP | 1,408 |
| 5 | Sheffield | CDP | 1,132 |
| 6 | Columbus | CDP | 824 |
| 7 | Tidioute | Borough | 688 |
| 8 | Sugar Grove | Borough | 613 |
| 9 | Starbrick | CDP | 522 |
| 10 | Clarendon | Borough | 450 |
| 11 | Bear Lake | Borough | 164 |
See also
References
- "State & County QuickFacts". United States Census Bureau. Archived from the original on June 6, 2011. Retrieved November 22, 2013.
- "Find a County". National Association of Counties. Archived from the original on 2015-05-09. Retrieved 2011-06-07.
- "Pennsylvania: Individual County Chronologies". Pennsylvania Atlas of Historical County Boundaries. The Newberry Library. 2008. Archived from the original on March 25, 2015. Retrieved March 13, 2015.
- "2010 Census Gazetteer Files". United States Census Bureau. August 22, 2012. Retrieved March 11, 2015.
- "Population and Housing Unit Estimates". Retrieved October 9, 2018.
- "U.S. Decennial Census". United States Census Bureau. Retrieved March 11, 2015.
- "Historical Census Browser". University of Virginia Library. Archived from the original on August 11, 2012. Retrieved March 11, 2015.
- Forstall, Richard L., ed. (March 24, 1995). "Population of Counties by Decennial Census: 1900 to 1990". United States Census Bureau. Archived from the original on March 20, 2015. Retrieved March 11, 2015.
- "Census 2000 PHC-T-4. Ranking Tables for Counties: 1990 and 2000" (PDF). United States Census Bureau. April 2, 2001. Archived (PDF) from the original on December 18, 2014. Retrieved March 11, 2015.
- "U.S. Census website". United States Census Bureau. Retrieved 2011-05-14.
- US Census Bureau (2015). "Poverty Rates by County Small Area Income and Poverty Estimates". Archived from the original on 2015-12-22.
- Pennsylvania Budget and Policy Center (2012). "Student Poverty Concentration 2012". Archived from the original on 2015-12-22.
- Pennsylvania Department of Health, Birth Age County Reports 1990, 1990
- Pennsylvania Department of Health, Birth Age County Reports 2000, 2000
- Pennsylvania Department of Health, Birth Age County Reports 2011, 2011
- Center for Rural Pennsylvania, Number of Children Decreasing in Rural Pennsylvania, 2011
- Robert Wood Johnson Foundation (2016). "Pennsylvania Teen Births 2015". Archived from the original on 2017-08-28.
- Leip, David. "Dave Leip's Atlas of U.S. Presidential Elections". uselectionatlas.org. Archived from the original on 23 March 2018. Retrieved 1 May 2018.
- Center, Legislativate Data Processing. "Find Your Legislator". The official website for the Pennsylvania General Assembly. Archived from the original on 2017-05-06. Retrieved 2017-05-12.
- "Office of Management and Budget". whitehouse.gov. Archived from the original on 29 April 2018. Retrieved 1 May 2018.
- "Archived copy". Archived from the original on 2015-09-24. Retrieved 2017-12-07.CS1 maint: archived copy as title (link)
- CNMP, US Census Bureau. "This site has been redesigned and relocated. - U.S. Census Bureau". www.census.gov. Retrieved 1 May 2018.
External links
| Wikimedia Commons has media related to Warren County, Pennsylvania. |
Municipalities and communities of Warren County, Pennsylvania, United States | ||
|---|---|---|
| City | | |
| Boroughs | ||
| Townships | ||
| CDPs | ||
| Unincorporated communities | ||
| Ghost towns | ||
| Authority control |
|
|---|