Montour County, Pennsylvania
Montour County is a county located in the U.S. state of Pennsylvania. As of the 2010 census, the population was 18,267.[1] Its county seat is Danville.[2] The county is named for Andrew Montour,[3] a prominent Métis interpreter who served with George Washington during the French and Indian War. It encompasses 132 sq mi, making it the smallest county by land area in the state.[4]
Montour County | |
|---|---|
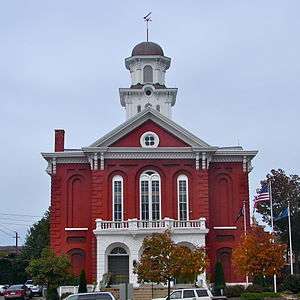 Montour County Courthouse in Danville | |
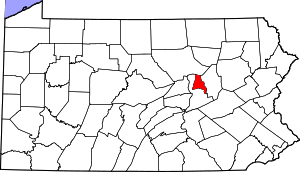 Location within the U.S. state of Pennsylvania | |
 Pennsylvania's location within the U.S. | |
| Coordinates: 41°02′N 76°40′W | |
| Country | |
| State | |
| Founded | May 3, 1850 |
| Named for | Andrew Montour |
| Seat | Danville |
| Largest borough | Danville |
| Area | |
| • Total | 132 sq mi (340 km2) |
| • Land | 130 sq mi (300 km2) |
| • Water | 2.1 sq mi (5 km2) 1.6%% |
| Population | |
| • Estimate (2018) | 18,240 |
| • Density | 143/sq mi (55/km2) |
| Time zone | UTC−5 (Eastern) |
| • Summer (DST) | UTC−4 (EDT) |
| Congressional district | 9th |
| Website | www |
Montour County is part of the Bloomsburg-Berwick, PA Metropolitan Statistical Area.
History
Fort Bosley, located near the present day border of Derry Township and the Borough of Washingtonville, was the county's only fortified location during the Revolutionary War.[5]
Geography
According to the U.S. Census Bureau, the county has a total area of 132 square miles (340 km2), of which 130 square miles (340 km2) is land and 2.1 square miles (5.4 km2) (1.6%) is water.[6] It is the smallest county by area in Pennsylvania. A total of 45% of Montour County is wooded. The entire county sits inside the Susquehanna River watershed. The other major streams in Montour County include Chillisquaque Creek and Mahoning Creek.[7]
Climate
Montour has a humid continental climate (Dfa/Dfb) and average monthly temperatures in Danville range from 26.9 °F in January to 72.3 °F in July.
Adjacent counties
- Lycoming County (north)
- Columbia County (east)
- Northumberland County (south & west)
Geology

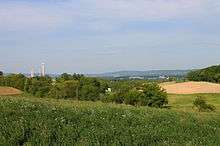

Montour County is located in the Ridge-and-Valley Province of the Appalachian Mountains. A total of 65% of the soils in the county are well-drained. The Muncy Hills are located in the northern part of the county and Montour Ridge is located in the southern part of the county, not far from the Susquehanna River. Montour Ridge also is home to the highest elevation in the county, 1425 feet above sea level. The lowest elevation is 440 feet above sea level, at the Susquehanna River.[7]
The sedimentary rocks in Montour County are from either the Devonian Period or the Silurian Period. The Devonian Period rocks are more common than Silurian Period rocks, making up two thirds of the county. These rocks are prevalent in the Muncy Hills and the lowlands in the southern portion of the county. The Devonian Period rocks in Montour County include the Catskill Formation, the Marcellus Shale, the Helderburg Formation, the Mahantango Formation, the Oriskany Formation, the Marine Beds, and the Onondaga Formation. The other one third of the rocks in Montour County are from the Silurian Period. Rocks from this period are prevalent on Montour Ridge and the adjacent valley and the hills to the northwest of Washingtonville. These areas consist of the Wills Creek formation, the Tonoloway Formation, the Bloomsburg Formation, the Tuscarora Formation, the Clinton Group, and the McKenzie Formation.[7]
There are three major anticlines and synclines in Montour County. These are the White Deer Anticline, the Lackawanna Syncline, and the Milton Anticline. These are located in the northern, central, and Montour Ridge areas of the county, respectively. These features are situated in a northeast-southwest alignment. They were formed by regional compression and uplift approximately 200 million years ago, during the Permian Period. During the Pleistocene Period, the Illinoian glacial advance reached Montour County, although the Wisconsin glacial advance stopped slightly short of it. There are alluvial deposits in many of the river valleys in the county, especially there two streams or rivers meet. These deposits were formed fairly recently, geologically speaking.[7]
The water supply for Montour County comes primarily from the Susquehanna River, as well as wells and springs. The rural areas especially depend on wells for their water supply, but Danville mostly uses the Susquehanna River. Wells drilled into Silurian rock have a tendency to be highly hard and prone to developing sinkholes. However, the Keyser, Wills Creek, and Tonoloway Formations are considerably better at producing water.[7]
Demographics
| Historical population | |||
|---|---|---|---|
| Census | Pop. | %± | |
| 1850 | 13,239 | — | |
| 1860 | 13,053 | −1.4% | |
| 1870 | 15,344 | 17.6% | |
| 1880 | 15,468 | 0.8% | |
| 1890 | 15,645 | 1.1% | |
| 1900 | 15,526 | −0.8% | |
| 1910 | 14,868 | −4.2% | |
| 1920 | 14,080 | −5.3% | |
| 1930 | 14,517 | 3.1% | |
| 1940 | 15,466 | 6.5% | |
| 1950 | 16,001 | 3.5% | |
| 1960 | 16,730 | 4.6% | |
| 1970 | 16,508 | −1.3% | |
| 1980 | 16,675 | 1.0% | |
| 1990 | 17,735 | 6.4% | |
| 2000 | 18,239 | 2.8% | |
| 2010 | 18,267 | 0.2% | |
| Est. 2018 | 18,240 | [8] | −0.1% |
| U.S. Decennial Census[9] 1790-1960[10] 1900-1990[11] 1990-2000[12] 2010-2017[1] | |||
As of the census of 2000,[13] there were 18,236 people, 7,085 households, and 4,817 families residing in the county. The population density was 140 people per square mile (54/km2). There were 7,627 housing units at an average density of 58 per square mile (23/km2). The racial makeup of the county was 96.67% White, 1.01% Black or African American, 0.07% Native American, 1.28% Asian, 0.38% from other races, and 0.59% from two or more races. 0.92% of the population were Hispanic or Latino of any race. 33.2% were of German, 13.2% American, 8.1% Irish, 6.6% English, 5.7% Italian and 5.6% Polish ancestry.
There were 7,085 households out of which 30.00% had children under the age of 18 living with them, 56.30% were married couples living together, 8.90% had a female householder with no husband present, and 32.00% were non-families. 28.00% of all households were made up of individuals and 12.00% had someone living alone who was 65 years of age or older. The average household size was 2.43 and the average family size was 2.98.
In Montour County, the population was spread out with 24.40% under the age of 18, 6.40% from 18 to 24, 28.20% from 25 to 44, 24.00% from 45 to 64, and 17.10% who were 65 years of age or older. The median age was 40 years. For every 100 females, there were 90.50 males. For every 100 females age 18 and over, there were 86.00 males.
Montour County live birth rate was 249 births in 1990. Montour County's live birth rate in 2000 was 213 births, while in 2011 it increased to 228 babies.[14]
- County poverty demographics
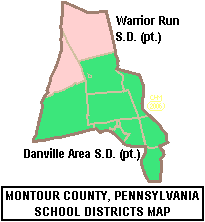
According to research by The Center for Rural Pennsylvania, which is a legislative agency of the Pennsylvania General Assembly, the poverty rate for Montour County was 11.2% in 2014.[15] The statewide poverty rate was 13.6% in 2014. The 2012 childhood poverty rate by school district was: Danville Area School District - 28.8% living at 185% or below than the Federal Poverty Level and Warrior Run School District - 32.2%.[16]
According to the US Census Bureau, from 2009-2014 Montour County saw a 37% increase in the number of families in the federal food assistance program called SNAP (Supplemental Nutrition Assistance Program).[17] The number of people or families receiving monthly SNAP dollars rose from 491 in 2009 to 674 people in 2014.[18]
- Teen Pregnancy rate
The Pennsylvania Department of Health reports the annual teens aged 15–19 birth rate. From 2011 to 2015, Montour County experienced a 19% decline in teen pregnancies.[19] In Pennsylvania the majority of pupils graduate from high school at age 18 years old. Montour County is home to an Amish population where pregnancies at 17–19 years old are common.
- 2015 - 87
- 2014 - 85
- 2013 - 82
- 2012 - 96
- 2011 - 108
Metropolitan Statistical Area
The United States Office of Management and Budget[20] has designated Montour County as the Bloomsburg-Berwick, PA Metropolitan Statistical Area (MSA). As of the 2010 U.S. Census[21] the metropolitan area ranked 20th most populous in the State of Pennsylvania and the 368th most populous in the United States with a population of 82,562. Montour County is also a part of the larger Bloomsburg-Berwick-Sunbury, PA Combined Statistical Area (CSA), which combines the populations of Montour County as well as Columbia, Northumberland, Snyder and Union Counties in Pennsylvania. The Combined Statistical Area ranked 8th in the State of Pennsylvania and 115th most populous in the United States with a population of 264,739.
Economy
There are approximately 350 farms in Montour County. The majority of these farms produce beef, hogs, and dairy. Limestone is mined in some areas in the county.[7]
Government
| Year | Republican | Democratic | Third parties |
|---|---|---|---|
| 2016 | 61.8% 5,288 | 33.4% 2,857 | 4.8% 411 |
| 2012 | 59.2% 4,652 | 38.9% 3,053 | 2.0% 154 |
| 2008 | 56.6% 4,574 | 41.7% 3,364 | 1.7% 138 |
| 2004 | 64.3% 4,903 | 35.0% 2,666 | 0.7% 55 |
| 2000 | 61.0% 3,960 | 36.3% 2,356 | 2.8% 179 |
| 1996 | 47.9% 2,785 | 37.6% 2,183 | 14.5% 843 |
| 1992 | 46.6% 3,096 | 32.4% 2,150 | 21.1% 1,400 |
| 1988 | 63.5% 3,617 | 35.7% 2,031 | 0.8% 48 |
| 1984 | 66.8% 4,174 | 32.9% 2,055 | 0.3% 19 |
| 1980 | 55.8% 3,399 | 37.3% 2,272 | 7.0% 425 |
| 1976 | 53.7% 3,259 | 44.9% 2,727 | 1.5% 89 |
| 1972 | 69.6% 4,386 | 27.9% 1,755 | 2.5% 157 |
| 1968 | 55.0% 3,289 | 37.5% 2,239 | 7.5% 448 |
| 1964 | 40.7% 2,527 | 59.3% 3,683 | 0.1% 4 |
| 1960 | 61.2% 4,154 | 38.7% 2,629 | 0.1% 8 |
| 1956 | 65.7% 3,976 | 34.2% 2,072 | 0.1% 3 |
| 1952 | 62.1% 3,725 | 37.8% 2,264 | 0.1% 7 |
| 1948 | 57.6% 2,690 | 42.1% 1,964 | 0.3% 16 |
| 1944 | 55.1% 2,727 | 44.7% 2,212 | 0.2% 8 |
| 1940 | 46.9% 2,723 | 53.0% 3,080 | 0.1% 4 |
| 1936 | 39.7% 2,350 | 59.8% 3,534 | 0.5% 30 |
| 1932 | 44.2% 2,159 | 54.9% 2,677 | 0.9% 44 |
| 1928 | 71.7% 3,692 | 28.1% 1,445 | 0.3% 13 |
| 1924 | 55.8% 2,499 | 40.2% 1,799 | 4.0% 178 |
| 1920 | 53.8% 2,296 | 43.8% 1,872 | 2.4% 103 |
| 1916 | 40.1% 1,068 | 57.5% 1,530 | 2.4% 65 |
| 1912 | 11.0% 308 | 53.2% 1,492 | 35.8% 1,005 |
| 1908 | 42.3% 1,164 | 54.2% 1,490 | 3.5% 95 |
| 1904 | 51.4% 1,518 | 46.0% 1,358 | 2.7% 79 |
| 1900 | 39.9% 1,292 | 57.9% 1,875 | 2.2% 72 |
| 1896 | 42.7% 1,384 | 53.8% 1,747 | 3.5% 114 |
| 1892 | 36.0% 1,108 | 60.9% 1,877 | 3.1% 95 |
| 1888 | 39.9% 1,289 | 57.7% 1,865 | 2.4% 76 |
Montour County is heavily Republican, with the Republican winning it in every presidential election since 1968.
The County is run by three, locally elected county commissioners who serve 4 year terms.
In October 2015, Montour County Commissioners sought court approval for a $1 million emergency loan to cover expenses. The loan was necessitated by the lack of a state general fund budget, which delayed many state and federal program funding streams to the county.[23] The hearing will be before Judge Thomas James, Jr. By state law, the county commissioners must have court approval to take out debt outside of the usual budget and debt processes.
The average yearly property tax paid by Montour County residents amounts to about 2.86% of their yearly income. Montour County ranked 689th out of the 3143 United States counties for property taxes as a percentage of median income.[24] The median property tax in Montour County, Pennsylvania is $1,497 per year for a home worth the median value of $143,900. The County and the local school district collect separate property tax levies on private property.
State Senate[25]
- John R. Gordner, Republican, Pennsylvania's 27th Senatorial District
State House of Representatives[25]
United States House of Representatives
United States Senate
- Pat Toomey, Republican
- Bob Casey, Jr., Democrat
Education
Central Susquehanna Intermediate Unit #16 provides a wide variety of services to children living in Montour County. These include early intervention, special education support services, driver education on road training, speech and hearing therapy and autistic support. Services for children during the preschool years are provided without cost to their families when the child is determined to meet eligibility requirements.[26]
Danville Area Head Start[27]
Public school districts
- Danville Area School District (also in Northumberland County)
- Warrior Run School District (also in Northumberland and Union Counties)
Public charter schools
Private schools
As reported by the Pennsylvania Department of Education - EdNA. February 2014[28]
- Alternative Education Program - Danville
- Breezy Meadow - Danville [29]
- Chillisquaque Valley Parochial School - Bloomsburg
- County Line Parochial School - Danville
- Creek Side School[30] - Turbotville
- Danville Child Development Center - Danville
- Danville Mennonite School - Danville
- Delong Alternative Educ Program - Washingtonville
- Limestone Mennonite Parochial School - Milton
- Ridgeview Amish School - Watsontown
- St Cyril Kindergarten - Danville
- St Joseph School - Danville
- The Learning Tree Child Care Center, LLC - Danville
CSIU16 School Directory 2014 [31]
Child abuse cases reported
In 2014, 195 child abuse reports were made to the Montour Children and Youth Agency. In 2015, reported cases increased to 259 a 28% increase in reports over 2014.[32] The increase in cases was attributed to a new state law specifying more professions are mandated reporters including: teachers, college professors, coaches, advisors of youth organizations and public school employees.[33] Additionally, the high number of cases for such a small community can be attributed to the presence of Geisinger Medical Center and the Janet Weis Children's Hospital in Danville which serve a large region.
Communities

Under Pennsylvania law, there are four types of incorporated municipalities: cities, boroughs, townships, and, in one case, towns. The following boroughs and townships are located in Montour County:
Boroughs
- Danville (county seat)
- Washingtonville
Townships
Unincorporated communities
- Exchange
- Kaseville
- Limestoneville
- Mausdale
- Mechanicsville
- Mexico
- Mooresburg
- Ottawa
- Ridgeville
Population ranking
The population ranking of the following table is based on the 2010 census of Montour County.[34]
† county seat
| Rank | City/Town/etc. | Municipal type | Population (2010 Census) |
|---|---|---|---|
| 1 | † Danville | Borough | 4,699 |
| 2 | Washingtonville | Borough | 273 |
Marcellus Shale Impact fee
Montour County receives annual payments from the Commonwealth of Pennsylvania from taxes collected on marcellus shale gas drillers.[35] According to an April 2017 report from the Pennsylvania Department of Environmental Protection, there are no operating marcellus shale wells in Montour County.[36]
- Shale fee funds to Montour County
The use of the funds are strictly prescribed by state law.[39] In Montour County, the $120,000 in marcellus shale fee funds have been used for:
- Downtown Danville Open Space Master plan - $10,794
- Rehabilitation of Greenways - $25,000
References
- "State & County QuickFacts". United States Census Bureau. Archived from the original on 2011-06-06. Retrieved 2013-11-20.
- "Find a County". National Association of Counties. Retrieved 2011-06-07.
- Donehoo, Dr. George P. (1999) [1928]. A History of the Indian Villages and Place Names in Pennsylvania (PDF) (Second Reprint ed.). Lewisburg, Pennsylvania: Wennawoods Publishing. p. 290. ISBN 1-889037-11-7. Retrieved 2007-03-07.
ISBN refers to a 1999 reprint edition, URL is for the Susquehanna River Basin Commission's web page of Native American Place names, quoting and citing the book. Some older sources say the county was named for Madame Montour, Andrew's mother.
- The State Museum (April 12, 2013). "Montour County - Our Smallest County THIS WEEK IN PENNSYLVANIA ARCHAEOLOGY".
- Buckalew, John M., Captain The Frontier Forts Within The North and West Branches of the Susquehanna River Pennsylvania. Read Before The Wyoming Historical And Geological, Society, October 1, 1895. Reprinted From The State Report, 1896. Wilkes-Barre, PA.: E. B. Yoruy, Printer. 1896 AccessGenealogy.com. Web. 21 February 2016.
- "2010 Census Gazetteer Files". United States Census Bureau. August 22, 2012. Retrieved March 9, 2015.
- Joseph J. Eckenrode (1985), Soil Survey of Montour County, Pennsylvania, retrieved 2013 Check date values in:
|accessdate=(help) - "Population and Housing Unit Estimates". Retrieved June 9, 2017.
- "U.S. Decennial Census". United States Census Bureau. Retrieved March 9, 2015.
- "Historical Census Browser". University of Virginia Library. Retrieved March 9, 2015.
- Forstall, Richard L., ed. (March 24, 1995). "Population of Counties by Decennial Census: 1900 to 1990". United States Census Bureau. Retrieved March 9, 2015.
- "Census 2000 PHC-T-4. Ranking Tables for Counties: 1990 and 2000" (PDF). United States Census Bureau. April 2, 2001. Retrieved March 9, 2015.
- "U.S. Census website". United States Census Bureau. Retrieved 2008-01-31.
- Pennsylvania Department of Health, Birth Age County Reports 1990, 2000 and 2011, 2011
- US Census Bureau (2015). "Poverty Rates by County Small Area Income and Poverty Estimates".
- Pennsylvania Budget and Policy Center (2012). "Student Poverty Concentration 2012". Archived from the original on 2015-12-22. Retrieved 2015-12-11.
- Emma Ginader., Union Shows Highest spike in food need, The Daily Item, February 17, 2016
- US Census Bureau, 2014 Community Survey, 2015
- Rick Dandes., Fewer Kids having Kids, The Daily Item, March 13, 2016
- "Office of Management and Budget | The White House". whitehouse.gov. Retrieved 2014-10-16.
- "2010 Census". census.gov. Retrieved 2014-10-16.
- Leip, David. "Dave Leip's Atlas of U.S. Presidential Elections". uselectionatlas.org. Retrieved 29 November 2018.
- Karen Blackledge., Budget fallout Montour County in court to seek emergency loan, The Daily Item, October 13, 2015
- Tax-rates.org., The 2015 Tax Resource County Property Taxes 2014, 2015
- Center, Legislativate Data Processing. "Find Your Legislator". The official website for the Pennsylvania General Assembly. Retrieved May 11, 2017.
- Central Susquehanna Intermediate Unit 16 Administration (2014). "About the CSIU". Archived from the original on October 29, 2014.
- Danville Area School District Administration (2014). "Danville Head Start web site". Archived from the original on 2015-09-23. Retrieved 2014-02-06.
- Pennsylvania Department of Education (February 6, 2014). "PDE Education Names and addresses".
- "Archived copy". Archived from the original on 2012-04-15. Retrieved 2011-11-03.CS1 maint: archived copy as title (link)
- "Creek Side School in Turbotville, PA 17772". localschooldirectory.com. Retrieved 2014-10-16.
- "CSIU16 School Directory 2014" (PDF). Jan 20, 2014. Archived from the original (PDF) on February 23, 2014.
- John Zaklansky., Increase in referrals, abuse cases. The Daily Item, April 10, 2016
- John Zaklansky. Child Abuse Awareness takes on new meaning. The Daily Item, April 10, 2016.
- Bureau, US Census. "Decennial Census by Decades". www.census.gov. Retrieved 2018-11-29.
- John Finnerty., Critics Fear tax hike may hurt projects, The Daily Item, March 5, 2017
- PA Department of Environmental Protection (April 2017). "Oil & Gas Reporting Website - Production - Waste Reports".
- PUC (2017). "Local Government Impact Fee Distributions".
- Pennsylvania Utility Commission (2015). "County Disbursement for 2015".
- PUC (2017). "Act 13 (Impact Fee)".
| Wikisource has the text of the 1879 American Cyclopædia article Montour. |
Municipalities and communities of Montour County, Pennsylvania, United States | ||
|---|---|---|
| Boroughs | | |
| Townships | ||
| Unincorporated communities | ||
| Authority control |
|
|---|