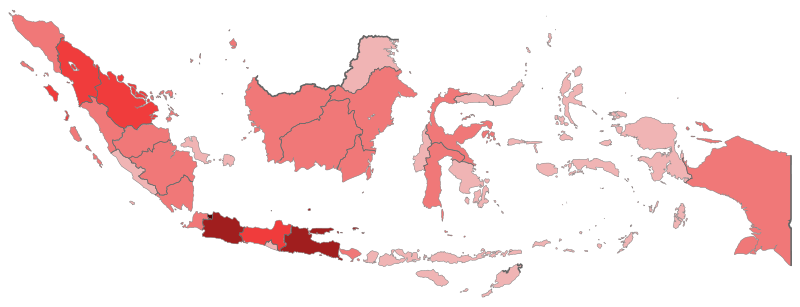
List of Indonesian provinces by GRP per capita
This article presents a list of Indonesian provinces sorted by their gross regional product nominal (GRP Nominal) per capita.
Methodology
GRP Nominal is the regional or provincial counterpart of the national gross domestic product, the most comprehensive measure of national economic activity. The Statistics Indonesia (Badan Pusat Statistik) derives GRP for a province as the sum of the GRP Nominal originating in all the industries in the province at current prices market.[1]
List of Indonesian administrative divisions by GRP Nominal, with 14,140 IDR = US$1 term of Nominal while 4,325.87 IDR = US$1 term of PPP.[2] Note some provinces have little population and large oil, gas, or mining revenues, and therefore GRP Nominal does not reflect consumer demand.
2019 data
GRP Data
Per Capita Data


2018 data
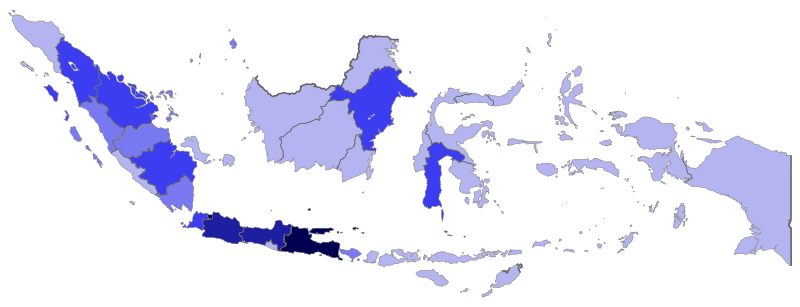
PPP
List of Indonesia province by GRP PPP and PPP per capita 2018
| Rank GRP PPP | Province | Region | PPP per capita in USD | GRP Nominal in IDR | GRP PPP in USD |
|---|---|---|---|---|---|
| — | Indonesia | Indonesia | $ 13,230 | Rp 14,837 trillion | $ 3.494 trillion |
| 1 | DKI Jakarta | Java | $ 57,906 | Rp 2,599.2 trillion | $ 606.1 billion |
| 2 | East Java | Java | $ 12,928 | Rp 2,189.8 trillion | $ 510.7 billion |
| 3 | West Java | Java | $ 9,399 | Rp 1,962.2 trillion | $ 457.6 billion |
| 4 | Central Java | Java | $ 8,578 | Rp 1,268.7 trillion | $ 295.9 billion |
| 5 | Riau | Sumatra | $ 25,845 | Rp 755.3 trillion | $ 176.1 billion |
| 6 | North Sumatera | Sumatra | $ 11,990 | Rp 741.2 trillion | $ 172.9 billion |
| 7 | East Kalimantan | Kalimantan | $ 40,783 | Rp 638.1 trillion | $ 148.8 billion |
| 8 | Banten | Java | $ 11,300 | Rp 614.9 trillion | $ 143.4 billion |
| 9 | South Sulawesi | Sulawesi | $ 12,291 | Rp 462.3 trillion | $ 107.8 billion |
| 10 | South Sumatera | Sumatra | $ 11,693 | Rp 419.7 trillion | $ 97.9 billion |
| 11 | Lampung | Sumatra | $ 9,297 | Rp 333.7 trillion | $ 77.8 billion |
| 12 | Riau Islands | Sumatra | $ 27,187 | Rp 249.1 trillion | $ 58.1 billion |
| 13 | Bali | Lesser Sunda Islands | $ 12,737 | Rp 234.4 trillion | $ 54.7 billion |
| 14 | West Sumatera | Sumatra | $ 9,989 | Rp 230.5 trillion | $ 53.8 billion |
| 15 | Papua | Western New Guinea | $ 14,786 | Rp 210.7 trillion | $ 49.1 billion |
| 16 | Jambi | Sumatra | $ 13,611 | Rp 208.4 trillion | $ 48.6 billion |
| 17 | West Kalimantan | Kalimantan | $ 9,046 | Rp 194.0 trillion | $ 45.3 billion |
| 18 | South Kalimantan | Kalimantan | $ 9,586 | Rp 171.9 trillion | $ 40.1 billion |
| 19 | Aceh | Sumatra | $ 6,885 | Rp 155.9 trillion | $ 36.4 billion |
| 20 | Central Sulawesi | Sulawesi | $ 11,669 | Rp 150.6 trillion | $ 35.1 billion |
| 21 | Central Kalimantan | Kalimantan | $ 12,162 | Rp 138.7 trillion | $ 32.4 billion |
| 22 | Yogyakarta | Java | $ 7,964 | Rp 129.9 trillion | $ 30.3 billion |
| 23 | West Nusa Tenggara | Lesser Sunda Islands | $ 5,761 | Rp 123.9 trillion | $ 28.9 billion |
| 24 | North Sulawesi | Sulawesi | $ 11,221 | Rp 119.5 trillion | $ 27.9 billion |
| 25 | Southeast Sulawesi | Sulawesi | $ 10,378 | Rp 118.1 trillion | $ 27.5 billion |
| 26 | East Nusa Tenggara | Lesser Sunda Islands | $ 4,301 | Rp 99.1 trillion | $ 23.1 billion |
| 27 | North Kalimantan | Kalimantan | $ 28,013 | Rp 86.1 trillion | $ 20.1 billion |
| 28 | West Papua | Western New Guinea | $ 19,812 | Rp 79.6 trillion | $ 18.6 billion |
| 29 | Bangka-Belitung Islands | Sumatra | $ 11,672 | Rp 73.1 trillion | $ 17.0 billion |
| 30 | Bengkulu | Sumatra | $ 7,889 | Rp 66.4 trillion | $ 15.5 billion |
| 31 | West Sulawesi | Sulawesi | $ 7,491 | Rp 43.5 trillion | $ 10.1 billion |
| 32 | Maluku | Maluku Islands | $ 5,661 | Rp 43.1 trillion | $ 10.0 billion |
| 33 | Gorontalo | Sulawesi | $ 7,423 | Rp 37.7 trillion | $ 8.8 billion |
| 34 | North Maluku | Maluku Islands | $ 6,905 | Rp 36.5 trillion | $ 8.5 billion |
Nominal
List of Indonesia province by GRP Nominal and Nominal per capita 2018
| Rank per capita | Province | Region | Nominal per capita in IDR | Nominal per capita in USD | Equivalent Country | GRP Nominal in USD | Equivalent Country |
|---|---|---|---|---|---|---|---|
| — | Indonesia | Indonesia | Rp 56,000,000 | $ 3,927 | $ 1.042 trillion | ||
| 1 | DKI Jakarta | Java | Rp 248.305,870 | $ 17,438 | $ 182.5 billion | ||
| 2 | East Kalimantan | Kalimantan | Rp 174,882,370 | $ 12,281 | $ 44.8 billion | ||
| 3 | North Kalimantan | Kalimantan | Rp 120,125,690 | $ 8,436 | $ 6.0 billion | ||
| 4 | Riau Islands | Sumatra | Rp 116,580,600 | $ 8,187 | $ 17.5 billion | ||
| 5 | Riau | Sumatra | Rp 110,826,760 | $ 7,783 | $ 53.0 billion | ||
| 6 | West Papua | Western New Guinea | Rp 84,957,900 | $ 5,966 | $ 5.6 billion | ||
| 7 | Papua | Western New Guinea | Rp 63,403,510 | $ 4,452 | $ 14.8 billion | ||
| 8 | Jambi | Sumatra | Rp 58,364,900 | $ 4,098 | $ 14.6 billion | ||
| 9 | East Java | Java | Rp 55,436,370 | $ 3,893 | $ 153.8 billion | ||
| 10 | Bali | Lesser Sunda Islands | Rp 54,618,430 | $ 3,835 | $ 16.5 billion | ||
| 11 | South Sulawesi | Sulawesi | Rp 52,706,740 | $ 3,701 | $ 32.5 billion | ||
| 12 | Central Kalimantan | Kalimantan | Rp 52,154,070 | $ 3,662 | $ 9.7 billion | ||
| 13 | North Sumatera | Sumatra | Rp 51,416,760 | $ 3,610 | $ 52.1 billion | ||
| 14 | South Sumatera | Sumatra | Rp 50,051,830 | $ 3,521 | $ 29.5 billion | ||
| 15 | Bangka-Belitung Islands | Sumatra | Rp 50,051,830 | $ 3,515 | $ 5.1 billion | ||
| 16 | Central Sulawesi | Sulawesi | Rp 50,037,920 | $ 3,514 | $ 10.6 billion | ||
| 17 | Banten | Java | Rp 48,457,010 | $ 3,403 | $ 43.2 billion | ||
| 18 | North Sulawesi | Sulawesi | Rp 48,117,850 | $ 3,379 | $ 8.4 billion | ||
| 19 | Southeast Sulawesi | Sulawesi | Rp 44,501,900 | $ 3,125 | $ 8.3 billion | ||
| 20 | West Sumatera | Sumatra | Rp 42,832,690 | $ 3,008 | $ 16.2 billion | ||
| 21 | South Kalimantan | Kalimantan | Rp 41,106,450 | $ 2,887 | $ 12.1 billion | ||
| 22 | West Java | Java | Rp 40,305,590 | $ 2,831 | $ 137.8 billion | ||
| 23 | Lampung | Sumatra | Rp 39,864,050 | $ 2,799 | $ 23.4 billion | ||
| 24 | West Kalimantan | Kalimantan | Rp 38,793,660 | $ 2,724 | $ 13.6 billion | ||
| 25 | Central Java | Java | Rp 36,783,710 | $ 2,583 | $ 89.1 billion | ||
| 26 | Yogyakarta | Java | Rp 34,142,470 | $ 2,398 | $ 9.1 billion | ||
| 27 | Bengkulu | Sumatra | Rp 33,827,180 | $ 2,375 | $ 4.7 billion | ||
| 28 | West Sulawesi | Sulawesi | Rp 32,123,750 | $ 2,256 | $ 3.1 billion | ||
| 29 | Gorontalo | Sulawesi | Rp 31,831,740 | $ 2,235 | $ 2.7 billion | ||
| 30 | North Maluku | Maluku Islands | Rp 29,609,520 | $ 2,079 | $ 2.6 billion | ||
| 31 | Aceh | Sumatra | Rp 29,521,500 | $ 2,073 | $ 11.0 billion | ||
| 32 | West Nusa Tenggara | Lesser Sunda Islands | Rp 24,706,700 | $ 1,735 | $ 8.7 billion | ||
| 33 | Maluku | Maluku Islands | Rp 24,278,490 | $ 1,705 | $ 3.0 billion | ||
| 34 | East Nusa Tenggara | Lesser Sunda Islands | Rp 18,446,780 | $ 1,295 | $ 7.0 billion |
References
- "Statistik Indonesia 2016" (in Indonesian). Jakarta: Badan Pusat Statistik. 2016. Archived from the original (PDF) on 2016-11-13.
- "Archived copy". Archived from the original on 2016-11-13. Retrieved 2016-11-14.CS1 maint: archived copy as title (link)