List of Australian states and territories by gross state product
This is the most recent list of Australian states and territories by gross state product (GSP) and GSP per capita. Also included are the GSP and population growth tables as well as a comparison table showing the surplus/deficit between state final demand (SFD) and GSP for the same financial year. All the data was taken from the Australian Bureau of Statistics website.
States and territories by GSP per capita
.svg.png)
> 100,000
100,000 - 80,000
80,000 - 70,000
70,000 - 60,000
< 60,000
| State or territory | GSP per capita (A$, 2018–19) |
GSP per capita growth (2018–19) |
GSP per capita as a ratio to national |
|---|---|---|---|
| 106,196 | 1.418 | ||
| 100,003 | 1.336 | ||
| 96,456 | 1.288 | ||
| 76,361 | 1.020 | ||
| 70,662 | 0.944 | ||
| 68,350 | 0.913 | ||
| 61,965 | 0.828 | ||
| 59,863 | 0.800 | ||
| 74,873 | 1.000 |
States and territories by GSP growth and share of national economy
.svg.png)
> 500,000
500,000 - 300,000
200,000 - 100,000
< 100,000
| State or territory | Share of National Economy (%, 2018–19)[1] |
GSP (million A$, 2008–09) |
GSP (million A$, 2018–19) |
Annual Growth Rate (2018–19) |
|---|---|---|---|---|
| 32.60% | 482,539 | 614,409 | ||
| 23.67% | 344,311 | 446,079 | ||
| 18.94% | 283,635 | 357,044 | ||
| 13.83% | 183,919 | 260,640 | ||
| 5.73% | 95,215 | 107,990 | ||
| 2.17% | 30,586 | 40,879 | ||
| 1.69% | 27,375 | 31,819 | ||
| 1.39% | 20,437 | 26,109 | ||
| 100.00% | 1,462,225 | 1,884,969 |
States and territories by population growth
| State or territory | Population[2] (June 2009) |
Population (June 2019) |
National population share (%, June 2019) |
Annual Growth Rate (2018–19) |
Comparison as multiple of (June 2009 vs. June 2019) |
|---|---|---|---|---|---|
| 5,371,934 | 6,594,804 | 26.01% | 1.228 | ||
| 354,785 | 420,379 | 1.68% | 1.203 | ||
| 4,328,771 | 5,095,100 | 20.09% | 1.177 | ||
| 2,240,250 | 2,621,680 | 10.34% | 1.170 | ||
| 7,053,755 | 8,089,526 | 31.90% | 1.147 | ||
| 1,608,902 | 1,751,693 | 6.91% | 1.089 | ||
| 226,027 | 245,869 | 0.97% | 1.088 | ||
| 504,353 | 534,281 | 2.11% | 1.059 | ||
| 21,688,777 | 25,359,662 | 100.00% | 1.169 |
States and territories by comparison between SFD and GSP
| State or territory | SFD[3] (million A$, 2018–19) |
GSP (million A$, 2017–18) |
Surplus / deficit |
|---|---|---|---|
| 603,675 | 603,143 | −532 | |
| 478,878 | 432,993 | −45,885 | |
| 354,904 | 352,248 | −2,656 | |
| 200,369 | 258,120 | 57,751 | |
| 118,854 | 106,477 | −12,377 | |
| 50,550 | 39,686 | −10,864 | |
| 35,142 | 30,710 | −4,432 | |
| 24,592 | 26,501 | 1,909 | |
| 1,866,964 | 1,849,878 | −17,086 |
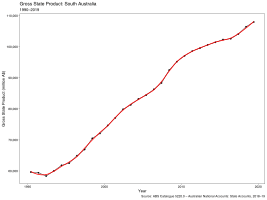
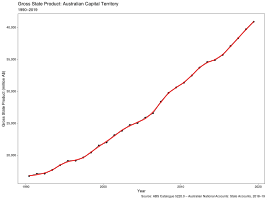
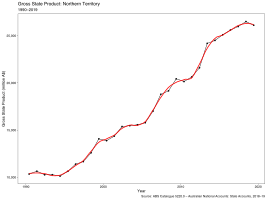
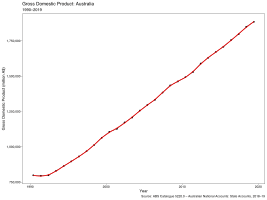
Historical gross state product (since 1989–90)
- Gross State Product (million A$) since 1989–90


See also
- Economy of Australia
- Home-ownership in Australia
- Median household income in Australia and New Zealand
- Ranked list of states and territories of Australia
References
- "5220.0 – Australian National Accounts: State Accounts, 2018–19". Australian Bureau of Statistics. Retrieved 20 November 2019.
- "3101.0 – Australian Demographic Statistics, Jun 2019". Australian Bureau of Statistics. Retrieved 10 January 2020.
- "State Final Demand, 2018–19) Financial Year". Australian Bureau of Statistics. Retrieved 11 January 2020.
This article is issued from Wikipedia. The text is licensed under Creative Commons - Attribution - Sharealike. Additional terms may apply for the media files.