List of Indian states and union territories by GDP per capita
This is a list of Indian states and union territories by NSDP per capita. Net state domestic product (NSDP) is the state counterpart to a country's Net domestic product (NDP), which equals the gross domestic product (GDP) minus depreciation on a country's capital goods. The following table gives the latest available nominal NSDP per capita figures for the States and Union Territories of India at current prices in Indian rupees. No data is available for the union territories of Dadra and Nagar Haveli and Daman and Diu, Ladakh and Lakshadweep.
| Rank | State/Union territory | NSDP Per Capita (Nominal) (2018–19)[1][2] | NSDP Per Capita (Nominal) (2019–20)[1] | NSDP Per Capita (Nominal) (2018–19 INT$) | NSDP Per capita (PPP)1 (2018–19 INT$)[3] |
|---|---|---|---|---|---|
| 1 | Goa | ₹ 4,58,304 | N/A | US$ 6,698 | US$ 25,044 |
| 2 | Delhi | ₹ 3,65,529 | N/A | US$ 5,342 | US$ 19,974 |
| 3 | Sikkim | ₹ 3,57,643 | N/A | US$ 5,227 | US$ 19,543 |
| 4 | Chandigarh | ₹ 3,29,209 | N/A | US$ 4,811 | US$ 17,990 |
| 5 | Haryana | ₹ 2,36,147 | ₹ 2,64,207 | US$ 3,451 | US$ 12,904 |
| 6 | Puducherry | ₹ 2,20,461 | ₹ 2,37,279 | US$ 3,222 | US$ 12,047 |
| 7 | Karnataka | ₹ 2,10,887 | N/A | US$ 3,082 | US$ 11,524 |
| 8 | Telangana | ₹ 2,04,488 | ₹ 2,28,216 | US$ 2,988 | US$ 11,174 |
| 9 | Kerala | ₹ 2,04,105 | N/A | US$ 2,983 | US$ 11,153 |
| 10 | Uttarakhand | ₹ 1,98,738 | N/A | US$ 2,904 | US$ 10,860 |
| 11 | Gujarat | ₹ 1,97,447 | N/A | US$ 2,885 | US$ 10,789 |
| 12 | Tamil Nadu | ₹ 1,93,750 | ₹ 2,14,237 | US$ 2,831 | US$ 10,587 |
| 13 | Maharastra | ₹ 1,91,736[4] | ₹ 2,07,727[4] | US$ 2,802 | US$ 10,477 |
| 14 | Himachal Pradesh | ₹ 1,79,188 | ₹ 1,95,255[5] | US$ 2,618 | US$ 9,792 |
| 15 | Andaman and Nicobar Islands | N/A | N/A | N/A | N/A |
| 16 | Mizoram | ₹ 1,68,626 | ₹ 2,01,741 | US$ 2,464 | US$ 9,215 |
| 17 | Punjab | ₹ 1,54,996 | N/A | US$ 2,265 | US$ 8,470 |
| 18 | Andhra Pradesh | ₹ 1,51,173 | N/A | US$ 2,209 | US$ 8,261 |
| 19 | Arunachal Pradesh | ₹ 1,39,588 | N/A | US$ 2,040 | US$ 7,628 |
| India | ₹ 1,26,406[2] | ₹ 1,34,432[6] | US$ 1,964 | US$ 6,907 (2018–19) US$ 7,346 (2019–20) | |
| 20 | Nagaland | ₹ 1,16,882 | N/A | US$ 1,708 | US$ 6,387 |
| 21 | Tripura | ₹ 1,13,102 | N/A | US$ 1,653 | US$ 6,180 |
| 22 | Rajasthan | ₹ 1,10,606 | ₹ 1,18,159 | US$ 1,616 | US$ 6,044 |
| 23 | West Bengal | ₹ 1,09,491 | N/A | US$ 1,600 | US$ 5,983 |
| 24 | Chhattisgarh | ₹ 96,887 | N/A | US$ 1,416 | US$ 5,294 |
| 25 | Odisha | ₹ 95,164 | ₹ 1,01,587 | US$ 1,390 | US$ 5,200 |
| 26 | Jammu and Kashmir | ₹ 91,882 | N/A | US$ 1,342 | US$ 5,021 |
| 27 | Madhya Pradesh | ₹ 90,998 | ₹ 99,763 | US$ 1,329 | US$ 4,973 |
| 28 | Meghalaya | ₹ 89,024 | ₹ 98,151 | US$ 1,301 | US$ 4,865 |
| 29 | Assam | ₹ 82,078 | N/A | US$ 1,199 | US$ 4,485 |
| 30 | Jharkhand | ₹ 76,019 | N/A | US$ 1,111 | US$ 4,154 |
| 31 | Manipur | ₹ 69,978 | N/A | US$ 1,022 | US$ 3,824 |
| 32 | Uttar Pradesh | ₹ 66,512 | ₹ 70,419 | US$ 972 | US$ 3,635 |
| 33 | Bihar | ₹ 43,822 | N/A | US$ 640 | US$ 2,395 |
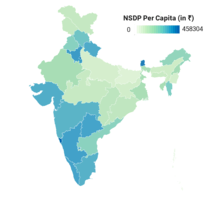
NSDP Per Capita of Indian states and UT's, 2018–19
Past NSDP per capita of Indian states
| Rank | State/Union territory | NSDP Per Capita (Nominal) 2011-12[1][2] | NSDP Per Capita (Nominal) 2012–13[1] | NSDP Per Capita (Nominal) 2013–14[1] | NSDP Per Capita (Nominal) 2014–15[1] | NSDP Per Capita (Nominal) 2015–16[1] | NSDP Per Capita (Nominal) 2016–17[1] | NSDP Per Capita (Nominal) 2017–18[1] | NSDP Per Capita (Nominal) 2018–19[1] |
|---|---|---|---|---|---|---|---|---|---|
| 1 | Goa | ₹ 2,59,444 | ₹ 2,34,354 | ₹ 2,15,776 | ₹ 2,89,185 | ₹ 3,34,575 | ₹ 3,82,140 | ₹ 4,22,155 | ₹ 4,58,304 |
| 2 | Delhi | ₹ 2,29,619 | ₹ 2,49,589 | ₹ 2,73,301 | ₹ 2,98,832 | ₹ 3,28,985 | 2,98,832 | ₹ 3,28,985 | ₹ 3,65,529 |
| 3 | Sikkim | ₹ 1,58,667 | ₹ 1,74,183 | ₹ 1,94,624 | ₹ 2,14,148 | ₹ 2,45,987 | ₹ 2,80,729 | ₹ 3,17,134 | ₹ 3,57,643 |
| 4 | Chandigarh | ₹ 1,59,116 | ₹ 1,80,624 | ₹ 2,04,542 | ₹ 2,12,786 | ₹ 2,30,417 | ₹ 2,54,263 | ₹ 2,96,434 | ₹ 3,29,209 |
| 5 | Haryana | ₹ 1,06,085 | ₹ 1,21,169 | ₹ 1,37,770 | ₹ 1,47,382 | ₹ 1,64,963 | ₹ 1,85,050 | ₹ 2,11,526 | ₹ 2,36,147 |
| 6 | Puducherry | ₹ 1,19,649 | ₹ 1,30,548 | ₹ 1,48,147 | ₹ 1,46,921 | ₹ 1,72,727 | ₹ 1,87,357 | ₹ 2,03,583 | ₹ 2,20,461 |
| 7 | Karnataka | ₹ 90,269 | ₹ 1,02,314 | ₹ 1,18,829 | ₹ 1,30,024 | ₹ 1,48,108 | ₹ 1,70,133 | ₹ 1,87,649 | ₹ 2,10,887 |
| 8 | Telangana | ₹ 91,121 | ₹ 1,01,007 | ₹ 1,12,162 | ₹ 1,24,104 | ₹ 1,40,840 | ₹ 1,59,395 | ₹ 1,80,494 | ₹ 2,04,488 |
| 9 | Kerala | ₹ 97,912 | ₹ 1,10,314 | ₹ 1,23,321 | ₹ 1,35,517 | ₹ 1,48,133 | ₹ 1,66,205 | ₹ 1,83,435 | ₹ 2,04,105 |
| 10 | Uttarakhand | ₹ 1,00,305 | ₹ 1,13,610 | ₹ 1,26,247 | ₹ 1,35,881 | ₹ 1,47,592 | ₹ 1,61,172 | ₹ 1,82,320 | ₹ 1,98,738 |
| 11 | Gujarat | ₹ 87,481 | ₹ 1,02,826 | ₹ 1,13,139 | ₹ 1,27,017 | ₹ 1,39,254 | ₹ 1,56,295 | ₹ 1,73,079 | ₹ 1,97,447 |
| 12 | Tamil Nadu | ₹ 92,984 | ₹ 1,04,943 | ₹ 1,16,236 | ₹ 1,28,372 | ₹ 1,40,441 | ₹ 1,54,272 | ₹ 1,71,583 | ₹ 1,93,750 |
| 13 | Maharastra | ₹ 99,564 | ₹ 1,11,980 | ₹ 1,25,035 | ₹ 1,32,476 | ₹ 1,46,258 | ₹ 1,62,005 | ₹ 1,76,102 | ₹ 1,91,736 |
| 14 | Himachal Pradesh | ₹ 87,721 | ₹ 99,730 | ₹ 1,14,095 | ₹ 1,23,299 | ₹ 1,35,512 | ₹ 1,50,290 | ₹ 1,67,044 | ₹ 1,79,188 |
| 15 | Andaman and Nicobar Islands | ₹ 88,177 | ₹ 96,027 | ₹ 1,06,401 | ₹ 1,19,291 | ₹ 1,26,995 | ₹ 1,40,335 | ₹ 1,59,664 | N/A |
| 16 | Mizoram | ₹ 57,654 | ₹ 65,013 | ₹ 77,583 | ₹ 1,03,049 | ₹ 1,14,055 | ₹ 1,27,107 | ₹ 1,46,765 | ₹ 1,68,626 |
| 17 | Punjab | ₹ 85,577 | ₹ 94,318 | ₹ 1,03,381 | ₹ 1,08,970 | ₹ 1,18,558 | ₹ 1,28,780 | ₹ 1,42,477 | ₹ 1,54,996 |
| 18 | Andhra Pradesh | ₹ 69,000 | ₹ 74,687 | ₹ 82,870 | ₹ 93,903 | ₹ 1,08,002 | ₹ 1,20,676 | ₹ 1,39,680 | ₹ 1,51,173 |
| 19 | Arunachal Pradesh | ₹ 73,068 | ₹ 81,353 | ₹ 91,809 | ₹ 1,10,929 | ₹ 1,12,046 | ₹ 1,17,344 | ₹ 1,30,197 | ₹ 1,39,588 |
| 20 | Nagaland | ₹ 53,010 | ₹ 61,225 | ₹ 71,510 | ₹ 78,367 | ₹ 82,466 | ₹ 92,315 | ₹ 1,04,681 | ₹ 1,16,882 |
| 21 | Tripura | ₹ 47,079 | ₹ 52,434 | ₹ 61,570 | ₹ 69,474 | ₹ 83,680 | ₹ 90,827 | ₹ 1,00,477 | ₹ 1,13,102 |
| 22 | Rajasthan | ₹ 57,192 | ₹ 63,658 | ₹ 69,480 | ₹ 76,429 | ₹ 83,426 | ₹ 91,946 | ₹ 99,366 | ₹ 1,10,606 |
| 23 | West Bengal | ₹ 51,543 | ₹ 58,195 | ₹ 65,932 | ₹ 68,876 | ₹ 75,592 | ₹ 82,291 | ₹ 93,711 | ₹ 1,09,491 |
| 24 | Chhattisgarh | ₹ 55,177 | ₹ 60,849 | ₹ 69,880 | ₹ 72,936 | ₹ 73,590 | ₹ 81,808 | ₹ 89,813 | ₹ 96,887 |
| 25 | Odisha | ₹ 48,370 | ₹ 54,703 | ₹ 60,574 | ₹ 63,169 | ₹ 64,595 | ₹ 77,255 | ₹ 84,496 | ₹ 95,164 |
| 26 | Jammu and Kashmir | ₹ 53,173 | ₹ 56,828 | ₹ 61,108 | ₹ 61,211 | ₹ 73,215 | ₹ 77,023 | ₹ 82,710 | ₹ 91,882 |
| 27 | Madhya Pradesh | ₹ 38,551 | ₹ 44,931 | ₹ 52,169 | ₹ 56,069 | ₹ 62,626 | ₹ 74,787 | ₹ 82,941 | ₹ 90,998 |
| 28 | Meghalaya | ₹ 60,013 | ₹ 64,036 | ₹ 65,118 | ₹ 64,638 | ₹ 68,836 | ₹ 73,753 | ₹ 81,098 | ₹ 89,024 |
| 29 | Assam | ₹ 41,142 | ₹ 44,599 | ₹ 49,734 | ₹ 52,895 | ₹ 60,817 | ₹ 66,330 | ₹ 74,184 | ₹ 82,078 |
| 30 | Jharkhand | ₹ 41,254 | ₹ 47,360 | ₹ 50,006 | ₹ 57,301 | ₹ 52,754 | ₹ 60,018 | ₹ 69,265 | ₹ 76,019 |
| 31 | Manipur | ₹ 39,762 | ₹ 41,230 | ₹ 47,798 | ₹ 52,717 | ₹ 55,447 | ₹ 59,345 | ₹ 65,008 | ₹ 69,978 |
| 32 | Uttar Pradesh | ₹ 32,002 | ₹ 35,812 | ₹ 40,124 | ₹ 42,267 | ₹ 47,118 | ₹ 52,744 | ₹ 58,821 | ₹ 66,512 |
| 33 | Bihar | ₹ 21,750 | ₹ 24,487 | ₹ 26,948 | ₹ 28,671 | ₹ 30,404 | ₹ 34,156 | ₹ 38,631 | ₹ 43,822 |
Historical NSDP per capita of Indian states
| Rank | State/Union territory | NSDP Per Capita (Nominal) 1996–97[1][2] | NSDP Per Capita (Nominal) 2000-01[1] | NSDP Per Capita (Nominal) 2005-06[1] | NSDP Per Capita (Nominal) 2010-11[1] | Growth from 2000–2010 |
|---|---|---|---|---|---|---|
| 1 | Goa | ₹ 26,418 | ₹ 43,735 | ₹ 84,721 | ₹ 1,68,024 | 284% |
| 2 | Delhi | ₹ 25,952 | ₹ 40,678 | ₹ 72,208 | ₹ 1,45,129 | 256% |
| 3 | Sikkim | ₹ 11,332 | ₹ 16,077 | ₹ 30,252 | ₹ 1,08,972 | 577% |
| 4 | Chandigarh | ₹ 31,158 | ₹ 49,771 | ₹ 84,993 | ₹ 1,26,651 | 154% |
| 5 | Haryana | ₹ 16,611 | ₹ 25,583 | ₹ 42,309 | ₹ 93,852 | 266% |
| 6 | Puducherry | ₹ 18,631 | ₹ 35,994 | ₹ 67,205 | ₹ 1,01,072 | 180% |
| 7 | Karnataka | ₹ 11,670 | ₹ 18,344 | ₹ 31,239 | ₹ 62,251 | 240% |
| 8 | Telangana | ₹ 11,202 | ₹ 17,195 | ₹ 28,987 | ₹ 66,951 | 289% |
| 9 | Kerala | ₹ 13,280 | ₹ 20,094 | ₹ 36,958 | ₹ 69,943 | 248% |
| 10 | Uttarakhand | ₹ 9,334 | ₹ 13,516 | ₹ 29,441 | ₹ 73,819 | 446% |
| 11 | Gujarat | ₹ 16,153 | ₹ 18,392 | ₹ 37,780 | ₹ 77,485 | 321% |
| 12 | Tamil Nadu | ₹ 13,269 | ₹ 20,972 | ₹ 35,243 | ₹ 78,473 | 274% |
| 13 | Maharastra | ₹ 13,464 | ₹ 21,892 | ₹ 40,671 | ₹ 59,587 | 172% |
| 14 | Himachal Pradesh | ₹ 9,140 | ₹ 21,824 | ₹ 35,806 | ₹ 57,797 | 164% |
| 15 | Andaman and Nicobar Islands | ₹ 15,896 | ₹ 23,658 | ₹ 41,665 | ₹ 65,712 | 177% |
| 16 | Mizoram | N/A | ₹ 16,635 | ₹ 25,826 | ₹ 40,772 | 145% |
| 17 | Punjab | ₹ 17,353 | ₹ 27,881 | ₹ 36,199 | ₹ 69,582 | 149% |
| 18 | Andhra Pradesh | ₹ 11,202 | ₹ 17,195 | ₹ 28,171 | ₹ 58,733 | 241% |
| 19 | Arunachal Pradesh | ₹ 10,816 | ₹ 15,260 | ₹ 28,171 | ₹ 60,961 | 299% |
| 20 | Nagaland | ₹ 11,805 | ₹ 16,253 | ₹ 33,792 | ₹ 55,582 | 241% |
| 21 | Tripura | ₹ 8,109 | ₹ 15,983 | ₹ 26,668 | ₹ 46,050 | 188% |
| 22 | Rajasthan | ₹ 10,102 | ₹ 13,020 | ₹ 20,275 | ₹ 44,644 | 242% |
| 23 | West Bengal | ₹ 9,857 | ₹ 16,583 | ₹ 24,720 | ₹ 47,245 | 184% |
| 24 | Chhattisgarh | ₹ 8,353 | ₹ 10,744 | ₹ 20,117 | ₹ 41,165 | 283% |
| 25 | Odisha | ₹ 6,548 | ₹ 10,453 | ₹ 18,846 | ₹ 39,537 | 278% |
| 26 | Jammu and Kashmir | ₹ 8,667 | ₹ 14,268 | ₹ 23,240 | ₹ 40,089 | 180% |
| 27 | Madhya Pradesh | ₹ 8,819 | ₹ 11,862 | ₹ 16,631 | ₹ 32,453 | 173% |
| 28 | Meghalaya | ₹ 9,243 | ₹ 15,657 | ₹ 24,885 | ₹ 43,766 | 179% |
| 29 | Assam | ₹ 7,394 | ₹ 12,803 | ₹ 18,396 | ₹ 33,087 | 158% |
| 30 | Jharkhand | ₹ 7,235 | ₹ 10,345 | ₹ 18,326 | ₹ 34,721 | 235% |
| 31 | Manipur | ₹ 7,920 | ₹ 12,369 | ₹ 20,251 | ₹ 28,336 | 130% |
| 32 | Uttar Pradesh | ₹ 7,476 | ₹ 9,828 | ₹ 14,221 | ₹ 26,698 | 171% |
| 33 | Bihar | ₹ 4,001 | ₹ 6,415 | ₹ 8,223 | ₹ 19,111 | 197% |
References
- "MOSPI Net State Domestic Product, Ministry of Statistics and Programme Implementation, Government of India". Retrieved 7 April 2020.
- "Handbook of Statistics, Reserve Bank of India – Publications". www.rbi.org.in. Retrieved 7 April 2020.
- "IMF PPP Conversion rate". IMF.
- "Economic Survey of Maharashtra 2019–20, Directorate of Economics and Statistics, Planning Department, Government of Maharashtra" (PDF). Retrieved 7 April 2020.
- "Economic Survey of HP 2019–20, Economics and Statistics Department, Government of Himachal Pradesh" (PDF). Retrieved 7 April 2020.
- "SECOND ADVANCE ESTIMATES OF NATIONAL INCOME, 2019–20 AND QUARTERLY ESTIMATES (Q4) OF GROSS DOMESTIC PRODUCT FOR THE THIRD QUARTER (OCT-DEC), 2019–20" (PDF). Ministry of Statistics and Programme Implementation. Retrieved 7 April 2020.
This article is issued from Wikipedia. The text is licensed under Creative Commons - Attribution - Sharealike. Additional terms may apply for the media files.