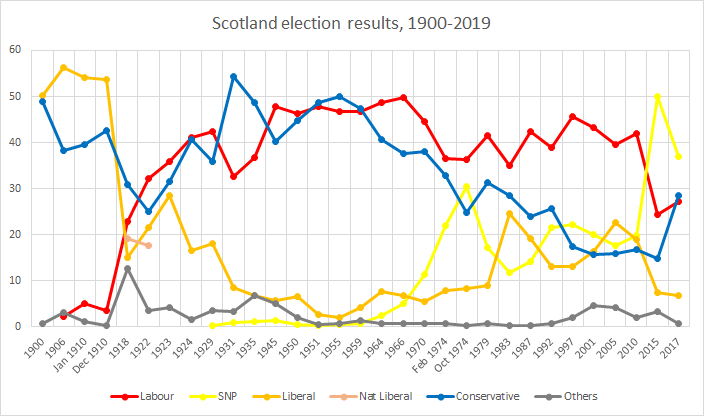
Elections in Scotland
Scotland has elections to several bodies: the Scottish Parliament, the United Kingdom Parliament, local councils and community councils. Before the United Kingdom left the European Union, Scotland elected members to the European Parliament.
 |
|---|
| This article is part of a series on the politics and government of Scotland |
|
Scottish Parliament Elections
UK General Elections
|
|
Intergovernmental Relations
Boris Johnson (C) Rishi Sunak (C)
Alister Jack (C)
|
|
Administration |
|
|
Scottish Parliament
_(1999-present).png)
Scottish Parliamentary elections use the Additional Member System (AMS). Under this system, voters are given two votes: one for their constituency, which elects a single MSP by first-past-the-post; and one for their region, which elects seven MSPs by closed list. Five Scottish Parliamentary elections have been held since the reconvention of the Scottish Parliament in 1999. Elections are held every five years, on the first Thursday in May.
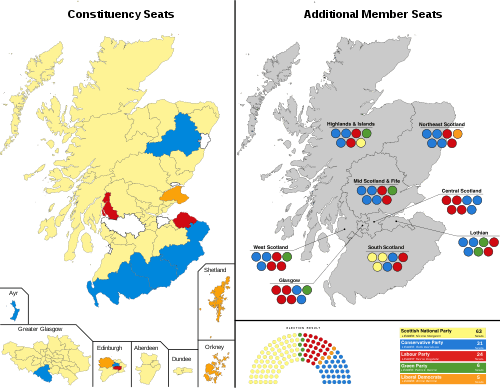
2016
| Party | Seats | Seats change |
Seats contested |
Constituency votes | Constituency votes, of total (%) | Constituency vote change (%) | Regional votes | Regional votes, of total (%) | Regional vote change (%) | |
|---|---|---|---|---|---|---|---|---|---|---|
| SNP | 63 | -6 | 129 | 1,059,897 | 46.5 | +1.1 | 953,587 | 41.7 | -2.3 | |
| Conservative | 31 | +16 | 129 | 501,844 | 22.0 | +8.1 | 524,222 | 22.9 | +10.6 | |
| Labour | 24 | -13 | 129 | 514,261 | 22.6 | -9.2 | 435,919 | 19.1 | -7.2 | |
| Scottish Green | 6 | +4 | 58 | 13,172 | 0.6 | +0.6 | 150,426 | 6.6 | +2.2 | |
| Liberal Democrats | 5 | 129 | 178,238 | 7.8 | -1.0 | 119,284 | 5.2 | |||
| Other parties | 0 | 0 | N/A | 11,741 | 0.5 | 102,314 | 4.5 | |||
Overall turnout - 55.6%
2011

Overall turnout- 50.4%
2007

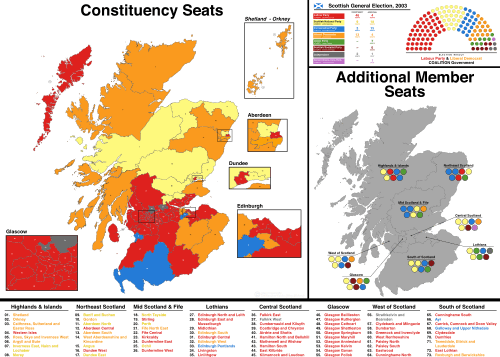
2003
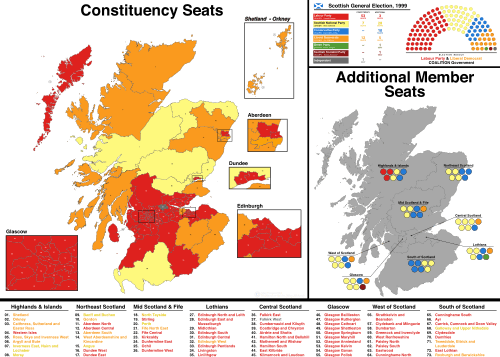
1999
By-elections
- 2014 Cowdenbeath by-election Lab hold
- 2013 Dunfermline by-election Lab gain from SNP
- 2013 Aberdeen Donside by-election SNP hold
- 2006 Moray by-election SNP hold
- 2005 Glasgow Cathcart by-election Lab hold
- 2001 Banff and Buchan by-election SNP hold
- 2001 Strathkelvin and Bearsden by-election Lab hold
- 2000 Glasgow Anniesland by-election Lab hold
- 2000 Ayr by-election Con gain from Lab
UK Parliament
2019

| Party | Seats | Seats change |
Seats contested |
Votes | Votes, of total (%) | Change (%) | |
|---|---|---|---|---|---|---|---|
| SNP | 48 | 59[note 1] | 1,242,380 | 45.0 | |||
| Conservative | 6 | 59[note 2] | 692,939 | 25.1 | |||
| Liberal Democrats | 4 | 59 | 263,417 | 9.5 | |||
| Labour | 1 | 59[note 3] | 511,838 | 18.6 | |||
| Scottish Green | 0 | 22[4] | 28,122 | 1.0 | |||
| Brexit Party | 0 | 15 | 13,243 | 0.5 | New | ||
| UKIP | 0 | 6 | 3,303 | 0.1 | |||
| Other parties | 0 | 3,819 | 0.1 | ||||
| Turnout | 2,759,061 | 68.1 | |||||
- Kirkcaldy and Cowdenbeath candidate Neale Hanvey was suspended before the election but appeared on ballot papers as an SNP candidate.
- Aberdeen North candidate Ryan Houghton and Glasgow Central candidate Flora Scarabello were both suspended before the election but appeared on the ballot paper as Conservative candidates.
- Falkirk candidate Safia Ali was suspended before the election but appeared on ballot papers as a Labour candidate.
2017

| Party | Seats | Seats change |
Seats contested |
Votes | Votes, of total (%) | Change (%) | |
|---|---|---|---|---|---|---|---|
| SNP | 35 | 59 | 977,569 | 36.9 | |||
| Conservative | 13 | 59 | 757,949 | 28.6 | |||
| Labour | 7 | 59* | 717,007 | 27.1 | |||
| Liberal Democrats | 4 | 59 | 179,061 | 6.8 | |||
| Scottish Green | 0 | 3 | 5,886 | 0.2 | |||
| UKIP | 0 | 10 | 5,302 | 0.2 | |||
| Other parties | 0 | 6,921 | 0.3 | ||||
| Turnout | 2,649,695 | 66.4 | |||||
2015

At the 2015 election the SNP won a majority of Scottish seats for the first time.
| Party | Seats | Seats change |
Seats contested |
Votes | Votes, of total (%) | Change (%) | |
|---|---|---|---|---|---|---|---|
| SNP | 56 | 59 | 1,454,436 | 50.0 | |||
| Labour | 1 | 59* | 707,147 | 24.3 | |||
| Conservative | 1 | 0 | 59 | 434,097 | 14.9 | ||
| Liberal Democrats | 1 | 59 | 219,675 | 7.5 | |||
| UKIP | 0 | 41 | 47,078 | 1.6 | |||
| Scottish Green | 0 | 32 | 39,205 | 1.3 | |||
| CISTA | 0 | 8 | 1,807 | 0.1 | New | ||
| TUSC | 0 | 10 | 1,720 | 0.1 | New | ||
| Scottish Christian | 0 | 2 | 1,467 | 0.1 | |||
| Scottish Socialist | 0 | 4 | 895 | 0.0 | |||
| National Front | 0 | 2 | 289 | 0.0 | New | ||
| Other parties | 0 | 11 | 2,649 | 0.1 | |||
| Turnout | 2,910,465 | 71.1 | |||||
2010

| Party | Seats | Seats change |
Candidates | Votes | % | % change | |
|---|---|---|---|---|---|---|---|
| Labour | 41 | 59 | 1,035,528 | 42.0 | |||
| Liberal Democrats | 11 | 59 | 465,471 | 18.9 | |||
| SNP | 6 | 59 | 491,386 | 19.9 | |||
| Conservative | 1 | 59* | 412,855 | 16.7 | |||
| UKIP | 0 | 34 | 17,223 | 0.7 | |||
| Scottish Green | 0 | 20 | 16,827 | 0.7 | |||
| BNP | 0 | 13 | 8,910 | 0.4 | |||
| TUSC | 0 | 10 | 3,530 | 0.1 | New | ||
| Scottish Socialist | 0 | 10 | 3,157 | 0.1 | |||
| Socialist Labour | 0 | 5 | 1,673 | 0.0 | |||
| Christian | 0 | 1 | 835 | 0.0 | New | ||
| Trust | 0 | 1 | 534 | 0.0 | New | ||
| Liberal | 0 | 1 | 389 | 0.0 | New | ||
| Scottish Jacobite | 0 | 2 | 290 | 0.0 | New | ||
| Communist | 0 | 2 | 237 | 0.0 | New | ||
| Turnout: | 2,465,722 | 63.8 | |||||
* Philip Lardner, the Conservative candidate for North Ayrshire and Arran was disowned by the Conservative Party for comments he posted on his website, calling homosexuality 'abnormal'. It was too late for him to be replaced and he still read as the Scottish Conservative & Unionist Party candidate on the ballot paper.
2005
| Party | Seats | Seats change |
Votes | % | % change | |
|---|---|---|---|---|---|---|
| Labour | 41 | 922,402 | 39.5 | |||
| Liberal Democrats | 11 | 528,076 | 22.6 | |||
| SNP | 6 | 412,267 | 17.7 | |||
| Conservative | 1 | 369,388 | 15.8 | |||
| Scottish Socialist | 0 | 43,514 | 1.9 | |||
| Scottish Green | 0 | 25,760 | 1.1 | |||
| UKIP | 0 | 8,859 | 0.4 | |||
| Socialist Labour | 0 | 6,696 | 0.3 | |||
| Christian | 0 | 4,004 | 0.2 | |||
| BNP | 0 | 1,591 | 0.1 | |||
| Scottish Unionist | 0 | 1,266 | 0.1 | New | ||
| Scottish Senior Citizens | 0 | 1,017 | 0.0 | New | ||
| Liberal | 0 | 916 | 0.0 | New | ||
| Turnout: | 2,333,887 | 60.6 | ||||
2001

| Party | Seats | Seats change |
Votes | % | % change | |
|---|---|---|---|---|---|---|
| Labour | 56 | 1,001,173 | 43.3 | |||
| Liberal Democrats | 10 | 378,034 | 16.3 | |||
| SNP | 5 | 464,314 | 20.1 | |||
| Conservative | 1 | 360,658 | 15.6 | |||
| Scottish Socialist | 0 | 72,516 | 3.1 | |||
| Turnout: | 2,315,703 | 58.2 | ||||
1997

| Party | Seats | Seats change |
Votes | % | % change | |
|---|---|---|---|---|---|---|
| Labour | 56 | 1,283,350 | 45.6 | |||
| Liberal Democrats | 10 | 365,362 | 13.0 | |||
| SNP | 6 | 621,550 | 22.1 | |||
| Conservative | 0 | 493,059 | 17.5 | |||
| Other | 0 | 53,427 | 2.0 | |||
| Turnout: | 2,816,748 | 71.3 | ||||
1992

| Party | Seats | Seats change |
Votes | % | % change | |
|---|---|---|---|---|---|---|
| Labour | 49 | 1,142,911 | 39.0 | |||
| Conservative | 11 | 751,950 | 25.6 | |||
| Liberal Democrats | 9 | 383,856 | 13.1 | |||
| SNP | 3 | 629,564 | 21.5 | |||
| Other | 0 | 23,417 | 0.8 | |||
| Turnout: | 2,931,698 | 75.5 | ||||
1987

| Party | Seats | Seats change |
Votes | % | % change | |
|---|---|---|---|---|---|---|
| Labour | 50 | 1,258,132 | 42.4 | |||
| Conservative | 10 | 713,081 | 24.0 | |||
| Alliance | 9 | 570,053 | 19.2 | |||
| SNP | 3 | 416,473 | 14.1 | |||
| Other | 0 | 10,069 | 0.3 | |||
| Turnout: | 2,967,808 | 75.1 | ||||
1983

| Party | Seats | Seats change |
Votes | % | % change | |
|---|---|---|---|---|---|---|
| Labour | 41 | 990,654 | 35.1 | |||
| Conservative | 21 | 801,487 | 28.4 | |||
| Alliance | 8 | 692,634 | 24.5 | |||
| SNP | 2 | 331,975 | 11.8 | |||
| Other | 0 | 7,830 | 0.3 | |||
| Turnout: | 2,824,580 | 72.7 | ||||
1979

| Party | Seats | Seats change |
Votes | % | % change | |
|---|---|---|---|---|---|---|
| Labour | 44 | 1,211,455 | 41.5 | |||
| Conservative | 22 | 916,155 | 31.4 | |||
| SNP | 2 | 504,259 | 17.3 | |||
| Liberal | 3 | 262,224 | 9.0 | |||
| SLP | 0 | 13,737 | 0.5 | New | ||
| Other | 0 | 2,881 | 0.1 | |||
| Turnout: | 2,916,637 | 76.84 | ||||
October 1974

| Party | Seats | Seats change |
Votes | % | % change | |
|---|---|---|---|---|---|---|
| Labour | 41 | 1,000,581 | 36.3 | |||
| Conservative | 16 | 681,327 | 24.7 | |||
| SNP | 11 | 839,617 | 30.4 | |||
| Liberal | 3 | 228,855 | 8.3 | |||
| Communist | 0 | 7,453 | 0.3 | |||
| National Front | 0 | 86 | 0.0 | New | ||
| Other | 0 | 182 | 0.0 | |||
| Turnout: | 2,758,101 | 74.81 | ||||
February 1974
| Party | Seats | Seats change |
Votes | % | % change | |
|---|---|---|---|---|---|---|
| Labour | 40 | 1,057,601 | 36.6 | |||
| Conservative | 21 | 950,668 | 32.9 | |||
| SNP | 7 | 633,180 | 21.9 | |||
| Liberal | 3 | 229,162 | 7.9 | |||
| Communist | 0 | 15,071 | 0.5 | |||
| Other | 0 | 1,393 | 0.1 | |||
| Turnout: | 2,887,075 | 78.86 | ||||
1970
| Party | Seats | Seats change |
Votes | % | % change | |
|---|---|---|---|---|---|---|
| Labour | 44 | 1,197,068 | 44.5 | |||
| Conservative | 23 | 1,020,674 | 38.0 | |||
| SNP | 1 | 306,802 | 11.4 | |||
| Liberal | 3 | 147,667 | 5.5 | |||
| Communist | 0 | 11,408 | 0.4 | |||
| Other | 0 | 4,616 | 0.2 | |||
| Turnout: | 2,688,235 | 73.91 | ||||
1966

| Party | Seats | Seats change |
Votes | % | % change | |
|---|---|---|---|---|---|---|
| Labour | 46 | 1,273,916 | 49.8 | |||
| Conservative | 20 | 960,675 | 37.6 | |||
| Liberal | 5 | 172,447 | 6.8 | |||
| SNP | 0 | 128,474 | 5.0 | |||
| Communist | 0 | 16,230 | 0.6 | |||
| Other | 0 | 638 | 0.0 | |||
| Turnout: | 2,552,380 | |||||
1964

| Party | Seats | Seats change | Votes | % | % Change | ||
|---|---|---|---|---|---|---|---|
| Labour Party | 43 | 1,283,667 | 48.7 | ||||
| Conservative (Total) | 24 | 1,069,695 | 40.6 | ||||
| Conservative | 24 | 981,641 | 37.3 | ||||
| National Liberal & Conservative | 0 | 88,054 | 3.3 | ||||
| Liberal | 4 | 200,063 | 7.6 | ||||
| SNP | 0 | 64,044 | 2.4 | ||||
| Communist | 0 | 12,241 | 0.5 | ||||
| Other | 0 | 4,829 | 0.2 | ||||
| Total | 71 | 2,634,539 | 100 | ||||
1959

| Party | Seats | Seats change | Votes | % | % Change | ||
|---|---|---|---|---|---|---|---|
| Labour Party | 38 | 1,245,255 | 46.7 | ||||
| Conservative (Total) | 31 | 1,260,287 | 47.3 | ||||
| Unionist | 25 | 1,060,609 | 39.8 | ||||
| National Liberal & Conservative | 6 | 199,678 | 7.5 | ||||
| Liberal | 1 | 108,963 | 4.1 | ||||
| Independent Unionist | 1 | 12,163 | 0.5 | New | |||
| SNP | 0 | 21,738 | 0.8 | ||||
| Communist | 0 | 12,150 | 0.5 | New | |||
| Fife Socialist League | 0 | 4,886 | 0.2 | New | |||
| Other | 0 | 2,071 | 0.1 | ||||
| Total | 71 | 2,667,513 | 100 | ||||
1955

| Party | Seats | Seats change | Votes | % | % Change | ||
|---|---|---|---|---|---|---|---|
| Conservative (Total) | 36 | 1,273,942 | 50.1 | ||||
| Unionist | 30 | 1,056,209 | 41.5 | ||||
| National Liberal & Conservative | 6 | 217,733 | 8.6 | ||||
| Labour Party | 34 | 1,188,058 | 46.7 | ||||
| Liberal | 1 | 47,273 | 1.9 | ||||
| Communist | 0 | 13,195 | 0.5 | ||||
| SNP | 0 | 12,112 | 0.5 | ||||
| Other | 0 | 8,674 | 0.3 | ||||
| Total | 71 | 2,543,254 | 100 | ||||
1951

| Party | Seats | Seats change | Votes | % | % Change | ||
|---|---|---|---|---|---|---|---|
| Conservative (Total) | 35 | 1,349,298 | 48.6 | ||||
| Unionist | 29 | 1,108,321 | 39.9 | ||||
| National Liberal & Conservative | 6 | 240,977 | 8.7 | ||||
| Labour Party | 35 | 1,330,244 | 47.9 | ||||
| Liberal | 1 | 76,291 | 2.7 | ||||
| Communist | 0 | 10,947 | 0.4 | ||||
| SNP | 0 | 7,299 | 0.3 | ||||
| Other | 0 | 3,758 | 0.1 | ||||
| Total | 71 | 2,777,837 | 100 | ||||
1950

| Party | Seats | Seats change | Votes | % | % Change | ||
|---|---|---|---|---|---|---|---|
| Labour Party | 37 | 1,259,410 | 46.2 | ||||
| Conservative (Total) | 31 | 1,222,010 | 44.8 | ||||
| Unionist | 26 | 1,013,909 | 37.2 | ||||
| National Liberal & Conservative | 5 | 208,101 | 7.6 | ||||
| Liberal | 2 | 180,270 | 6.6 | ||||
| SNP | 0 | 9,708 | 0.4 | ||||
| Communist | 0 | 27,559 | 1.0 | ||||
| Other | 1 | 27,727 | 1.0 | ||||
| Total | 71 | 2,726,684 | 100 | ||||
1945

| Party | Seats | Seats change | Votes | % | % Change | ||
|---|---|---|---|---|---|---|---|
| Labour Party | 37 | 1,144,310 | 47.9 | ||||
| Conservative (Total) | 27 | 964,134 | 40.3 | ||||
| Unionist | 24 | 878,206 | 36.7 | ||||
| National Liberal & Conservative | 3 | 85,937 | 3.6 | ||||
| Independent Labour Party | 3 | 40,725 | 1.7 | ||||
| Independent Liberal | 3 | 39,774 | 1.7 | ||||
| Communist | 1 | - | 33,265 | 1.4 | |||
| Liberal | 0 | 132,849 | 5.6 | ||||
| SNP | 0 | - | 30,595 | 1.3 | |||
| Common Wealth Party | 0 | - | 4,231 | 0.2 | |||
| Total | 71 | 2,389,892 | 100 | ||||
1935

| Party | Seats | Seats change | Votes | % | % Change | ||
|---|---|---|---|---|---|---|---|
| National Government (Total) | 43 | 1,135,403 | 49.8 | ||||
| Unionist | 35 | 962,595 | 42.0 | ||||
| National Liberal | 7 | 149,072 | 6.7 | ||||
| National Labour | 1 | 19,115 | 0.9 | ||||
| National | 0 | 4,621 | 0.2 | ||||
| Labour Party | 20 | 863,789 | 36.8 | ||||
| Liberal | 3 | 174,235 | 6.7 | ||||
| Independent Labour Party | 4 | 111,256 | 5.0 | ||||
| SNP | 0 | 25,652 | 1.1 | ||||
| Communist | 1 | 13,462 | 0.6 | ||||
| Total | 71 | 2,323,797 | 100 | ||||
1931

| Party | Seats | Seats change | Votes | % | % Change | ||
|---|---|---|---|---|---|---|---|
| National Government (Total) | 64 | 1,385,385 | 64.0 | ||||
| Unionist | 48 | 1,056,768 | 49.5 | ||||
| National Liberal & Conservative | 8 | New | 101,430 | 4.9 | New | ||
| Liberal | 7 | 205,384 | 8.6 | ||||
| National Labour | 1 | New | 21,803 | 1.0 | New | ||
| Labour Party | 7 | 696,248 | 32.6 | ||||
| Communist | 0 | 35,618 | 1.4 | ||||
| National Party of Scotland | 0 | 20,954 | 1.0 | ||||
| New Party | 0 | New | 3,895 | 0.2 | New | ||
| Other | 0 | 32,229 | 0.8 | ||||
| Total | 71 | 2,174,329 | 100 | ||||
1929
| Party | Seats | Seats change | Votes | % | % Change | |
|---|---|---|---|---|---|---|
| Labour | 36 | 937,300 | 42.3 | |||
| Unionist | 20 | 792,063 | 35.9 | |||
| Liberal | 13 | 407,081 | 18.1 | |||
| Communist | 0 | - | 27,114 | 1.1 | ||
| Scottish Prohibition | 1 | - | 25,037 | 1.1 | ||
| National Party of Scotland | 0 | - | 3,313 | 0.2 | New | |
| Other | 1 | 51,033 | 1.3 | |||
| Total | 71 | 2,242,941 | 100 | |||
1924

| Party | Seats | Seats change | Votes | % | % Change | |
|---|---|---|---|---|---|---|
| Unionist | 36 | 688,299 | 40.7 | |||
| Labour | 26 | 697,146 | 41.1 | |||
| Liberal | 8 | 286,540 | 16.6 | |||
| Communist | 0 | - | 15,930 | 0.7 | ||
| Other | 1 | - | 29,193 | 0.9 | ||
| Total | 71 | 1,717,108 | 100 | |||
1923

| Party | Seats | Seats change | Votes | % | % Change | |
|---|---|---|---|---|---|---|
| Labour | 34 | 532,450 | 35.9 | |||
| Liberal (Reunited) | 22 | 422,995 | 28.4 | |||
| Unionist | 14 | 468,526 | 31.6 | |||
| Communist | 0 | 39,448 | 2.4 | |||
| Other | 1 | - | 37,908 | 1.7 | ||
| Total | 71 | 1,501,327 | 100 | |||
1922

| Party | Seats | Seats change | Votes | % | % Change | |
|---|---|---|---|---|---|---|
| Labour | 29 | 501,254 | 32.2 | |||
| Liberal | 15 | 328,649 | 21.5 | |||
| Unionist | 13 | 379,396 | 25.1 | |||
| National Liberal | 12 | 288,529 | 17.7 | |||
| Communist | 1 | 23,944 | 1.4 | |||
| Other | 1 | 47,589 | 2.1 | |||
| Total | 71 | 1,569,361 | 100 | |||
1918

| Party | Seats | Seats change | Votes | % | % Change | ||
|---|---|---|---|---|---|---|---|
| Coalition (Total) | 54 | 584,259 | 52.3 | ||||
| Coalition Unionist | 28 | 336,530 | 30.8 | ||||
| Coalition Liberal | 25 | 221,145 | 19.1 | ||||
| Coalition Labour | 1 | 14,247 | 1.3 | ||||
| Coalition NDP | 0 | 12,337 | 1.1 | ||||
| Labour | 6 | 265,744 | 22.9 | +19.3 | |||
| Liberal | 8 | 163,960 | 15.0 | -36.6 | |||
| Unionist | 2 | 21,939 | 2.0 | ||||
| Co-operative Party | 0 | 19,841 | 1.8 | ||||
| Highland Land League | 0 | 8,710 | 0.8 | ||||
| Scottish Prohibition Party | 0 | 5,212 | 0.5 | ||||
| NDP | 0 | 4,297 | 0.4 | ||||
| Other | 1 | 52,749 | 4.7 | ||||
| Total | 71 | 1,126,711 | 100 | ||||
1910 December
| Party | Seats | Seats change | Votes | % | % Change | ||
|---|---|---|---|---|---|---|---|
| Liberal | 57 | 306,378 | 53.6 | ||||
| Conservative and Liberal Unionist | 10 | 244,785 | 42.6 | ||||
| Labour Party | 3 | 24,633 | 3.6 | ||||
| Other | 0 | 1,947 | 0.2 | ||||
| Total | 70 | 577,743 | 100 | ||||
1910 January
| Party | Seats | Seats change | Votes | % | % Change | ||
|---|---|---|---|---|---|---|---|
| Liberal | 58 | 354,847 | 54.2 | ||||
| Conservative and Liberal Unionist | 9 | 260,033 | 39.6 | ||||
| Labour Party | 2 | 37,852 | 5.1 | ||||
| Other | 1 | 7,710 | 1.1 | ||||
| Total | 70 | 660,442 | 100 | ||||
1906
| Party | Seats | Seats change | Votes | % | % Change | ||
|---|---|---|---|---|---|---|---|
| Liberal | 58 | 336,400 | 56.4 | ||||
| Conservative and Liberal Unionist | 10 | 225,802 | 38.2 | ||||
| Labour | 2 | 16,897 | 2.3 | ||||
| Other | 0 | 17,815 | 3.1 | ||||
| Total | 70 | 596,914 | 100 | ||||
1900
| Party | Seats | Seats change | Votes | % | % Change | ||
|---|---|---|---|---|---|---|---|
| Conservative and Liberal Unionist | 36 | 237,217 | 49.0 | ||||
| Liberal | 34 | 245,092 | 50.2 | ||||
| Scottish Workers' | 0 | 3,107 | 0.6 | ||||
| Other | 0 | 814 | 0.2 | ||||
| Total | 70 | 486,230 | 100 | ||||
1895
| Party | Seats | Seats change | Votes | % | % Change | |
|---|---|---|---|---|---|---|
| Liberal | 39 | 236,446 | 51.7 | |||
| Conservative & Liberal Unionist | 31 | 214,403 | 47.4 | |||
| Independent Labour Party | 0 | 4,269 | 0.8 | |||
| Total | 70 | 100 | ||||
1892
| Party | Seats | Seats change | Votes | % | % Change | |
|---|---|---|---|---|---|---|
| Liberal | 51 | 256,944 | 53.9 | |||
| Conservative & Liberal Unionist | 19 | 209,944 | 44.4 | |||
| Scottish Trades Councils Labour | 0 | 2,313 | 0.5 | |||
| Scottish Parliamentary Labour | 0 | 2,043 | 0.4 | |||
| Other | 0 | 3,886 | 0.8 | |||
| Total | 70 | 475,130 | 100 | |||
1886
| Party | Seats | Seats change | Votes | % | % Change | |
|---|---|---|---|---|---|---|
| Liberal | 43 | 193,801 | 53.6 | |||
| Conservative & Liberal Unionist | 27 | 164,314 | 46.4 | |||
| Total | 70 | 358,115 | 100 | |||
1885
| Party | Seats | Seats change | Votes | % | % Change | |
|---|---|---|---|---|---|---|
| Liberal | 51 | 238,627 | 53.3 | |||
| Conservative | 8 | 151,137 | 34.3 | |||
| Independent Liberal & Crofters Party | 4 | 16,551 | 3.7 | |||
| Independent Liberal | 7 | 38,214 | 8.6 | |||
| Others | 0 | |||||
| Scottish Land Restoration League | 0 | 2,359 | 0.5 | |||
| Total | 70 | 446,888 | 100 | |||
1880
| Party | Seats | Seats change | Votes | % | % Change | |
|---|---|---|---|---|---|---|
| Liberal | 52 | 195,517 | 70.1 | |||
| Conservative | 6 | 75,145 | 29.9 | |||
| Total | 58 | 269,662 | 100 | |||
1874
| Party | Seats | Seats change | Votes | % | % Change | |
|---|---|---|---|---|---|---|
| Liberal | 40 | 148,345 | 68.4 | |||
| Conservative | 18 | 63,193 | 31.6 | |||
| Total | 58 | 211,538 | 100 | |||
1868
| Party | Seats | Seats change | Votes | % | % Change | |
|---|---|---|---|---|---|---|
| Liberal | 51 | 125,356 | 82.5 | |||
| Conservative | 7 | 23,985 | 17.5 | |||
| Total | 58 | 149,341 | 100 | |||
1865
| Party | Seats | Seats change | Votes | % | % Change | |
|---|---|---|---|---|---|---|
| Liberal | 42 | 43,480 | 85.4 | |||
| Conservative | 11 | 4,305 | 14.6 | |||
| Total | 53 | 47,785 | 100 | |||
1859
| Party | Seats | Seats change | Votes | % | % Change | |
|---|---|---|---|---|---|---|
| Liberal | 40 | 5,174 | 66.4 | |||
| Conservative & Liberal Unionist | 13 | 2,616 | 33.6 | |||
| Total | 53 | 7,790 | 100 | |||
1857
| Party | Seats | Seats change | Votes | % | % Change | |
|---|---|---|---|---|---|---|
| Liberal | 39 | 31,999 | 84.8 | |||
| Conservative & Liberal Unionist | 14 | 4,060 | 15.2 | |||
| Total | 53 | 36,059 | 100 | |||
1852
| Party | Seats | Seats change | Votes | % | % Change | |
|---|---|---|---|---|---|---|
| Whig | 33 | - | 21,015 | 72.6 | ||
| Conservative & Liberal Conservative | 20 | - | 6,955 | 27.4 | ||
| Total | 53 | 27,970 | 100 | |||
1847
| Party | Seats | Seats change | Votes | % | % Change | |
|---|---|---|---|---|---|---|
| Whig | 33 | - | 20,092 | 81.7 | ||
| Conservative & Liberal Conservative | 20 | - | 3,509 | 18.3 | ||
| Total | 53 | 23,601 | 100 | |||
1841
| Party | Seats | Seats change | Votes | % | % Change | |
|---|---|---|---|---|---|---|
| Whig | 33 | - | 16,356 | 60.8 | ||
| Conservative | 20 | - | 9,793 | 38.3 | ||
| Chartist | 0 | 385 | 0.9 | |||
| Total | 53 | 26,354 | 100 | |||
1837
| Party | Seats | Seats change | Votes | % | % Change | |
|---|---|---|---|---|---|---|
| Whig | 33 | 22,082 | 54.0 | |||
| Conservative | 20 | 18,569 | 46.0 | |||
| Total | 53 | - | 40,651 | 100 | ||
1835
| Party | Seats | Seats change | Votes | % | % Change | |
|---|---|---|---|---|---|---|
| Whig | 38 | 28,307 | 62.8 | |||
| Conservative | 15 | 15,733 | 37.2 | |||
| Total | 53 | 44,040 | 100 | |||
1832
| Party | Seats | Seats change | Votes | % | % Change | |
|---|---|---|---|---|---|---|
| Whig | 43 | 44,003 | 79.0 | |||
| Tory | 10 | 9,752 | 21.0 | |||
| Total | 53 | 53,755 | 100 | |||
By-elections
Local councils
Since 1995, local elections in Scotland have been generally held every four years for all the 32 unitary authorities created under the Local Government etc. (Scotland) Act 1994. Between 1975 and 1992, elections were held every two years for either district or regional council, which sat for four-year terms. Those arrangements were set up by the Local Government (Scotland) Act 1973.
As one consequence of the Gould Report,[8] which was a response to the fiasco of the 2007 elections, the next council elections were scheduled for 2012 (one year after the Parliamentary elections in 2011)
2017
The elections were held again using the STV system of proportional representation, and as with the 2012 Scottish local elections, they were delayed for one year to ensure they were not held on the same day as the 2016 Scottish Parliament elections (which was delayed for a year, owing to the 2015 general election). For full analysis see 2017 Scottish local elections.
2012
The election was contested for the second time under the STV system of proportional representation. It was the first time in 13 years that the elections had not been held on the same day as the Scottish Parliament elections. For full analysis see 2012 Scottish local elections.
| Party | First-preference votes | Seats won | |||||
|---|---|---|---|---|---|---|---|
| # | % | Swing (pp) | # | Net Gain | % | ||
| Scottish National Party | 503,233 | 32.33 | +4.48 | 425 | +62 | 34.75 | |
| Labour | 488,703 | 31.39 | +3.26 | 394 | +46 | 32.22 | |
| Conservative | 206,599 | 13.27 | −2.35 | 115 | −28 | 9.40 | |
| Independents | 183,329 | 11.78 | +1.27 | 196 | +12 | 16.03 | |
| Liberal Democrats | 103,087 | 6.62 | −6.05 | 71 | −95 | 5.81 | |
| Green | 36,000 | 2.31 | +0.11 | 14 | +6 | 1.14 | |
| UKIP | 4,289 | 0.28 | +0.22 | 0 | ±0 | 0.00 | |
| Scottish Socialist Party | 4,183 | 0.27 | −0.61 | 1 | ±0 | 0.08 | |
| Borders Party | 3,755 | 0.24 | +0.12 | 2 | ±0 | 0.16 | |
| Action to Save St John's Hospital | 3,474 | 0.22 | +0.03 | 0 | −3 | 0.00 | |
| East Dunbartonshire Independent Alliance | 2,973 | 0.19 | −0.09 | 2 | ±0 | 0.16 | |
| Glasgow First | 2,547 | 0.16 | +0.16 | 1 | +1 | 0.08 | |
| Trade Unionist and Socialist Coalition | 2,485 | 0.16 | +0.16 | 0 | ±0 | 0.00 | |
| Christian Party | 2,344 | 0.15 | +0.12 | 0 | ±0 | 0.00 | |
| All Scotland Pensioners Party | 2,328 | 0.15 | +0.08 | 0 | ±0 | 0.00 | |
| Cumbernauld Independent Alliance | 1,894 | 0.12 | +0.02 | 1 | ±0 | 0.08 | |
| Unionist | 864 | 0.06 | −0.09 | 0 | ±0 | 0.00 | |
| Perth Independent Candidates | 805 | 0.05 | +0.05 | 1 | +1 | 0.08 | |
| Solidarity | 787 | 0.05 | −0.81 | 0 | −1 | 0.00 | |
| Socialist Labour Party | 714 | 0.05 | +0.03 | 0 | ±0 | 0.00 | |
| East Kilbride Alliance | 681 | 0.04 | −0.03 | 0 | ±0 | 0.00 | |
| Liberal | 595 | 0.04 | −0.02 | 0 | ±0 | 0.00 | |
| National Front | 369 | 0.02 | +0.02 | 0 | ±0 | 0.00 | |
| Pirate Party | 292 | 0.02 | +0.02 | 0 | ±0 | 0.00 | |
| Christian Peoples Alliance | 209 | 0.01 | +0.01 | 0 | ±0 | 0.00 | |
| Communist Party of Britain | 94 | <0.01 | +0.01 | 0 | ±0 | 0.00 | |
| Britannica | 73 | <0.01 | 0 | ±0 | 0.00 | ||
| Official Monster Raving Loony Party | 67 | <0.01 | 0 | ±0 | 0.00 | ||
| Total | 1,556,773 | 100.00 | ±0.00 | 1,223 | +1 | 100.00 | |
Past elections
By-elections
2008
- date to be announced: Abbey (4-member ward), Dumfries and Galloway, 1 member elected by single transferable vote: result pending (result May 2007: 2 Con, 1 SNP, 1 Lab)
- 1 May: Troup (3-member ward), Aberdeenshire, 1 member elected by single transferable vote: result pending (result May 2007: 1 SNP, 1 Con, 1 Ind)
- 6 March: Cambuslang East (3-member ward), South Lanarkshire, 1 member elected by single transferable vote: Lab gain from SNP (result May 2007: 2 Lab, 1 SNP; after by election: 3 Lab)
- 28 Feb: Lerwick South (4-member ward), Shetland, 1 member elected by single transferable vote: Ind hold (result May 2007: 4 Ind; after by election: 4 Ind)
- 21 Feb: Highland (3-member ward), Perth and Kinross, 1 member elected by single transferable vote: SNP hold (result May 2007: 2 SNP, 1 Con; after by election: 2 SNP, 1 Con)
- 14 Feb: Elgin City South (3-member ward), Moray, 1 member elected by single transferable vote: SNP gain from Ind (result May 2007: 1 SNP, 1 Lab, 1 Ind; after by election: 2 SNP, 1 Lab)
- 31 January: Kilsyth (3-member ward), North Lanarkshire, 1 member elected by single transferable vote: Lab hold (result May 2007: 2 Lab, 1 SNP; after by election: 2 Lab, 1 SNP)
2007
- 22 November: Lochee (4-member ward), Dundee, 1 member elected by single transferable vote: SNP hold (result May 2007: 2 SNP, 2 Lab; after by election: 2 SNP, 2 Lab)
- 4 October: Helensburgh and Lomond South (3-member ward), Argyll and Bute, 1 member elected by single transferable vote: Lib Dem gain from Ind (result May 2007: 1 Con, 1 Ind, 1 Lib Dem; after by election: 2 Lib Dem, 1 Con)
- 16 August: Midstocket/Rosemount (3-member ward), Aberdeen, 1 member elected by single transferable vote: SNP gain from Con (result May 2007: 1 Con, 1 SNP, 1 Lab; after by election: 2 SNP, 1 Lab)
2006
- 8 December: Elderslie, Renfrewshire, Lab hold (16% swing Lab to SNP)
- 28 September: Markinch and Woodside East, Fife, SNP gain from Lab
- 10 August: Lochardil, Highland, Lib Dem gain from Ind
- 15 June: Dumbarton West, West Dunbartonshire, SNP gain from Lab
- 18 May: Altonhill Hillhead and Longpark, East Ayrshire, SNP hold
- 11 May: Biggar, Symington and Black Mount, South Lanarkshire, Con gain from SNP
- 30 March: Avondale South, South Lanarkshire, Con hold
- 30 March: Borestone, Stirling, SNP gain from Lab
- 30 March: King's Park, Glasgow, Lib Dem gain from Lab
- 16 February: Milton, Glasgow, SNP gain from Lab
- 2 February: North Carrick and Maybole East, South Ayrshire, Ind gain from Lab
2005
- 8 December: Kirkshaws, North Lanarkshire, Lab hold
- 10 November: Knightswood Park, Glasgow, Lab hold
- 10 November: Loanhead, Midlothian, SNP gain from Ind
- 10 November: Murrayfield, Edinburgh, Con hold
- 13 October: Lochside, Dumfries and Galloway, Lab gain from Ind
- 29 September: Auchtertool and Burntisland East, Fife, SNP gain from Ind
- 11 August: Herbertshire, Falkirk, SNP gain from Lab
- 16 June: Kildrum and Park, North Lanarkshire, SNP gain from Ind
- 9 June: Huntly East, Aberdeenshire, Con hold
- 9 June: Kilnknowe and Clovenfords, Borders, SNP gain from Ind
- 17 March: Dalkeith/Woodburn, Midlothian, Lib Dem gain from Lab
- 17 March: Dumbarton West, West Dunbartonshire, Lab hold
European Parliament
In 1999, a Scotland-wide constituency replaced eight first-past-the-post constituencies used in the elections between 1979 and 1994. This returned eight MEPs under the d'Hondt method of party-list proportional representation system. Since then the number of MEPs returned by Scotland has been reduced twice, to seven in 2004, and then to six in 2009.
Following the United Kingdom's exit from the European Union on 31st January 2020, Scotland no longer elects representatives to the European Parliament.
Elected candidates are shown in bold. Brackets indicate the number of votes per seat won.
2019
| European Election 2019: Scotland[10][11][12][13] | |||||
|---|---|---|---|---|---|
| List | Candidates | Votes | % | ± | |
| SNP | Alyn Smith, Christian Allard, Aileen McLeod Margaret Ferrier, Heather Anderson, Alex Kerr[14] |
594,553 (198,184.3) |
37.8% | +8.8 | |
| Brexit Party | Louis Stedman-Bryce Karina Walker, James Ferguson-Hannah, Stuart Waiton, Paul Aitken, Calum Walker |
233,006 | 14.8% | N/A | |
| Liberal Democrats | Sheila Ritchie Fred Mackintosh, Catriona Bhatia, Vita Zaporozcenko, John Edward, Clive Sneddon[15] |
218,285 | 13.8% | +6.8 | |
| Conservative | Nosheena Mobarik Ian McGill, Shona Haslam, Iain Whyte, Andrea Gee, Michael Kusznir[16] |
182,476 | 11.6% | -5.6 | |
| Labour | David Martin, Jayne Baxter, Craig Miller, Amy Lee Fraioli, Callum O’Dwyer, Angela Bretherton[17] | 146,724 | 9.3% | -16.6 | |
| Scottish Green | Maggie Chapman, Lorna Slater, Gillian MacKay, Chas Booth, Mags Hall, Allan Faulds | 129,603 | 8.2% | +0.1 | |
| Change UK | David Macdonald,1 Kate Forman, Peter Griffiths, Heather Astbury, Colin McFadyen, Cathy Edgeworth | 30,004 | 1.9% | N/A | |
| UKIP | Donald MacKay, Janice MacKay, Otto Inglis, Mark Meechan, Roy Hill[18] | 28,418 | 1.8% | -8.7 | |
| Independent | Gordon Edgar[19] | 6,128 | 0.4% | N/A | |
| Independent | Ken Parke[19] | 2,049 | 0.1% | N/A | |
| Turnout | 1,561,226 | 39.9% | + 6.4 | ||
2014
| European Parliament election 2014: Scotland [20][21][22][23] | |||||
|---|---|---|---|---|---|
| List | Candidates | Votes | % | ± | |
| SNP | Ian Hudghton, Alyn Smith, Tasmina Ahmed-Sheikh, Stephen Gethins, Toni Giugliano, Chris Stephens |
389,503 (194,751.5) |
29.0 | –0.1 | |
| Labour | David Martin, Catherine Stihler, Derek Munn, Katrina Murray, Asim Khan, Kirsty O'Brien |
348,219 (174,109.5) |
25.9 | +5.1 | |
| Conservative | Ian Duncan, Belinda Don, Nosheena Mobarik, Jamie Gardiner, Iain McGill, Stuart McIntyre |
231,330 | 16.8 | +0.4 | |
| UKIP | David Coburn, Kevin Newton, Otto Inglis, Denise Baykal, Hugh Hatrick, Malcolm Mackay | 140,534 | 10.5 | +5.3 | |
| Scottish Green | Maggie Chapman, Chas Booth, Grace Murray, Alastair Whitelaw, Anne Thomas, Steen Parish | 108,305 | 8.1 | +0.8 | |
| Liberal Democrats | George Lyon, Christine Jardine, Richard Brodie, Jade Holden, Siobhan Mathers, Euan Davidson |
95,319 | 7.1 | –4.4 | |
| Britain First | James Dowson, John Arthur Randall, Jayda Fransen, Geoffrey Clynch, Margaret Clynch, Jane Shepherd | 13,551 | 2.0 | [new] | |
| BNP | Kenneth McDonald, David Orr, Victoria McKenzie, Angus Matthys, Paul Stafford, Stacey Fleming | 10,150 | 0.8 | –1.7 | |
| NO2EU | John Foster. Andrew Elliott, Murdo Maclean, Gail Morrow, Brian Smith, Richard Veitch | 6,388 | 0.5 | –0.4 | |
| Turnout | 1,343,299 | 33.5% | +5.0% | ||
2009
| European Parliament election 2009: Scotland[24][25] | |||||
|---|---|---|---|---|---|
| List | Candidates | Votes | % | ± | |
| SNP | Ian Hudghton, Alyn Smith Aileen McLeod, Drew Hendry, Duncan Ross, Gordon Archer |
321,007 (160,503.5) |
29.1 | +9.4 | |
| Labour | David Martin, Catherine Stihler Mary Lockhart, Paul McAleavely, Kirsty Connell, Nasim Khan[26] |
229,853 (114,926.5) |
20.8 | -5.6 | |
| Conservative | Struan Stevenson Belinda Don, Helen Gardiner, Donald G. MacDonald, Gerald Michaluk, PJ Lewis[27] |
185,794 | 16.8 | -0.9 | |
| Liberal Democrats | George Lyon Euan Robson, Robert Aldridge, Patsy Kenton, Douglas Herbison, Clive Sneddon[28] |
127,038 | 11.5 | -1.6 | |
| Scottish Green | Elaine Morrison, Chas Booth, Kirsten Robb, Alastair Whitelaw, Ruth Dawkins, Peter McColl | 80,442 | 7.3 | +0.5 | |
| UKIP | Peter Adams, Paul Hencke, Phillip Anderson, Matthew Desmond, Donald Mackay, Paul Wiffen, Kathleen Desmond [29] | 57,788 | 5.2 | -1.5 | |
| BNP | Gary Raikes, Charlie Baillie, Deborah McKnight, Roy Jones, Max Dunbar, Elise Jones [30] | 27,174 | 2.5 | +0.8 | |
| Socialist Labour | Louise McDaid, David Jacobsen, Katherine McGavigan, James Berrington, Claire Watt, James McDaid | 22,135 | 2.0 | +2.0 | |
| Scottish Christian | Sheila McLaughlan, John Smart, Brian Ross, Archie Linnegan, Christine Cormack, Isobel Anne Macleod | 16,738 | 1.5 | +1.5 | |
| Scottish Socialist | Colin Fox, Angela Gorrie, Johanna Dind, Nick McKerrell, Raphie de Santos, Felicity Garvie | 10,404 | 0.9 | -4.3 | |
| Independent | Duncan Robertson | 10,189 | 0.9 | +0.9 | |
| NO2EU | John Foster, Tommy Sheridan, Leah Ganley, Stuart Hyslop, Ajit Singh Uppal, Tom Morrison | 9,693 | 0.9 | +0.9 | |
| Jury Team | Alan Wallace, John O'Callaghan, Stuart Brown, Kenneth Lees, Mev Brown, Austin Compson-Bradford[31] | 6,257 | 0.6 | +0.6 | |
| Turnout | 1,104,512 | 28.5 | −2.4 | ||
2004
| European Parliament election 2004: Scotland[32] | |||||
|---|---|---|---|---|---|
| List | Candidates | Votes | % | ± | |
| Labour | David Martin, Catherine Stihler Bill Miller, Kirsty O'Brien, Colin Smyth, Catriona Renton, Gemma Doyle |
310,865 (155,432.5) |
26.4 | -2.3 | |
| SNP | Ian Hudghton, Alyn Smith Kenneth Gibson, Douglas Henderson, Alexander Nicholson, Alex Orr, Janet Law, Duncan Ross |
231,505 (115,752.5) |
19.7 | -7.5 | |
| Conservative | Struan Stevenson, John Purvis Cameron Buchanan, Sebastian Leslie, Anne Harper, Paul Nelson, Douglas Taylor |
209,028 (104,514) |
17.8 | -2.0 | |
| Liberal Democrats | Elspeth Attwooll Robert Aldridge, Alex Bruce, Karen Freel, Douglas Herbison, Clive Sneddon, Christine James, Jermaine Allison |
154,178 | 13.1 | +3.3 | |
| Scottish Green | Chas Booth, Tara O'Leary, Martin Bartos, Moira Dunworth, Alastair Whitelaw, Katherine Joester, James Park | 79,695 | 6.8 | +1.0 | |
| UKIP | Peter Troy, Philip Anderson, George Cormack, Michael Phillips, Janice Murdock, Donald Mackay, Peter Nielson | 78,828 | 6.7 | +5.4 | |
| Scottish Socialist | Felicity Garvie, Nick McKerrel, Hugh Kerr, Catriona Grant, Lynn Sheridan, John Sangster, Andrew Rossiter | 61,356 | 5.2 | +1.2 | |
| Christian Vote | George Hargreaves, William Thompson, Richard Russell, David Braid, Marion McNeill, Mary Hay, Rose Irtwange | 21,056 | 1.8 | N/A | |
| BNP | Steven Blake, Scott McLean, David Kerr, Stephen Burns, Bryan Dickson, Craig McComb, John Bean[33] | 19,427 | 1.7 | +1.3 | |
| Scottish Wind Watch | Brendan Hamill, Sylvia Thorne, Charles Bennie, Jennifer Scobie, Bennie Palmer, Helen Pass, Richard Hammock | 7,255 | 0.6 | N/A | |
| Independent | Fergus Tait | 3,624 | 0.3 | N/A | |
| Turnout | 1,176,817 | 30.9 | +6.2 | ||
1999
| European Parliament election 1999: Scotland[34] | |||||
|---|---|---|---|---|---|
| List | Candidates | Votes | % | ± | |
| Labour | David Martin, Bill Miller, Catherine Taylor Christine May, Hugh McMahon, James Paton, John Clifford, Jeanette Bradley |
283,490 (94,496.67) |
28.7 | N/A | |
| SNP | Ian Hudghton, Neil MacCormick Anne Gillies, Gordon Wilson, Janet Law, Kris Browne, Ian Goldie, Josephine Docherty |
268,528 (134,264) |
27.2 | N/A | |
| Conservative | Struan Stevenson, John Purvis Anne Harper, Cameron Buchanan, Sebastian Leslie, Iain Mitchell, Peter Ramsay, Anthony Gilbey |
195,296 (97,648) |
19.8 | N/A | |
| Liberal Democrats | Elspeth Attwooll Robert Aldridge, Neil Mitchison, Heather Lyall, Clive Sneddon, Danus Skene, Karen Freel, Jayne Struthers |
96,971 | 9.8 | N/A | |
| Scottish Green | Marion Coyne, Eleanor Scott, Phil O'Brien, Graeme Farmer, Linda Hendry, Chris Ballance, Kay Allan, Alastair Whitelaw | 57,142 | 5.8 | N/A | |
| Scottish Socialist | Hugh Kerr, Rosie Kane, Harvey Duke, Catherine Stewart, Colin Fox, Shareen Blackall, Steve Arnott, Frances Curran | 39,720 | 4.0 | N/A | |
| Pro-Euro Conservative | Paul Dwyer, Joanna Lavender, Douglas McConchie, Richard Ashurst, Neasa MacEarlean, Oliver Grant, Alexander Skinner, James Waters | 17,781 | 1.8 | N/A | |
| UKIP | Alistair McConnachie, Donald Mackay, James McKenna, Stuart Brown, Matthew Henderson, Joseph Smith, Peter Nielson, John Mumford | 12,459 | 1.3 | N/A | |
| Socialist Labour | Louise McDaid, Christopher Herriot, Katharine McGavigan, Stephen Mayes, Patricia Graham, Colin Turbett, Margaret Stead, James Galloway | 9,385 | 1.0 | N/A | |
| BNP | Kenneth Smith, Scott McLean,[35] Russell Bradley, Mark Allen, Paul Wilkinson, Robert Currie, David Kerr,[36] James Mills | 3,729 | 0.4 | N/A | |
| Natural Law | James McKissock, George Stidolph, Diana Kras, Kenneth Blair, David Pettigrew, Iain Petrie, Anna Rawlinson, Thomas Pringle | 2,087 | 0.2 | N/A | |
| Accountant for Lower Scottish Taxes | Charles Lawson | 1,632 | 0.2 | N/A | |
| Turnout | 988,310 | 24.7 | N/A | ||
Pre-1999 elections
For full details of results please referee to related articles;
1994
| Party | Seats | Seats change |
Votes | % | % change | |
|---|---|---|---|---|---|---|
| Labour | 6 | -1 | 635,955 | 42.51 | +0.65 | |
| SNP | 2 | +1 | 487,239 | 32.57 | +6.94 | |
| Conservative | 0 | 216,669 | 14.48 | –6.41 | ||
| Liberal Democrats | 0 | 107,811 | 7.21 | +2.92 | ||
| Scottish Green | 0 | 23,304 | 1.56 | –5.69 | ||
| Scottish Militant Labour | 0 | – | 12,113 | 0.81 | – | |
| Natural Law | 0 | – | 5,037 | 0.34 | – | |
| Liberal | 0 | – | 3,249 | 0.22 | – | |
| Socialist (GB) | 0 | – | 1,832 | 0.12 | – | |
| UKIP | 0 | – | 1,096 | 0.07 | – | |
| Communist | 0 | 689 | 0.05 | –0.02 | ||
| Independent | 0 | – | 584 | 0.04 | – | |
| International Communist | 0 | 381 | 0.03 | +0.02 | ||
| Turnout: | 1,495,959 | |||||
1989
| Party | Seats | Seats change |
Votes | % | % change | |
|---|---|---|---|---|---|---|
| Labour | 7 | +2 | 664,263 | 41.86 | +0.87 | |
| SNP | 1 | 406,686 | 25.63 | +7.81 | ||
| Conservative | 0 | –2 | 331,495 | 20.89 | –4.83 | |
| Green | 0 | 115,028 | 7.25 | +7.05 | ||
| SLD | 0 | 68,056 | 4.29 | –11.31 | ||
| Communist | 0 | – | 1,164 | 0.07 | – | |
| International Communist | 0 | – | 193 | 0.01 | – | |
| Turnout: | 1,586,885 | |||||
1984
| Party | Seats | Seats change |
Votes | % | % change | |
|---|---|---|---|---|---|---|
| Labour | 5 | +3 | 526,066 | 40.99 | +8.00 | |
| Conservative | 2 | –3 | 332,771 | 25.72 | –7.96 | |
| SNP | 1 | 230,594 | 17.82 | –1.56 | ||
| Alliance | 0 | 201,782 | 15.60 | –1.65 | ||
| Ecology | 0 | – | 2,560 | 0.20 | – | |
| Turnout: | 1,293,773 | |||||
1979
| Party | Seats | Seats change |
Votes | % | % change | |
|---|---|---|---|---|---|---|
| Conservative | 5 | – | 430,772 | 33.68 | – | |
| Labour | 2 | – | 421,968 | 32.99 | – | |
| SNP | 1 | – | 247,836 | 19.38 | – | |
| Liberal | 0 | – | 178,433 | 13.95 | – | |
| Turnout: | 1,279,009 | |||||
Referendums
To date seven referendums have been held in Scotland, covering a wide range of issues.
- 1975 United Kingdom European Communities membership referendum
- 1979 Scottish devolution referendum
- 1994 Strathclyde water referendum
- 1997 Scottish devolution referendum
- 2005 Edinburgh congestion charge referendum
- 2014 Scottish independence referendum[37][38][39]
- 2016 United Kingdom European Union membership referendum
See also
- Politics of Scotland
- Electoral systems in Scotland
- political parties
References
- "Scottish Parliament Elections". BBC. 5 April 2007. Retrieved 1 November 2006.
- Nicola McEwen. "Is Devolution at Risk?: Examining attitudes towards the Scottish Parliament in light of the 2003 Election". Scottish Affairs. Archived from the original on 16 September 2011. Retrieved 2012-05-11.
- "Results of the 2019 General Election in Scotland". BBC. Retrieved 28 December 2019.
- "Scottish Greens release list of 2019 general election candidates". Holyrood. 14 November 2019. Retrieved 28 December 2019.
- "Scotland Results". BBC News.
- "Scotland Results". BBC News.
- Compared to the Liberals in 1979
- "Probe says May poll failed voters". BBC News. 23 October 2007. Retrieved 1 May 2010.
- "Scottish Elections :: Local Elections 2012 - election results".
- "Who are the MEP candidates in Scotland?". BBC. 25 April 2019.
- European elections: List of candidates for Scotland BBC News Scotland, 28 April 2019
- The UK’s European elections 2019 | Gains for The Brexit Party and Lib Dems BBC News
- EU Elections 2019 – The Results Ballot Box Scotland; N.B.: This also gives the number of votes for each party in each council area.
- "SNP reveal list for Euro elections as party go for three MEPs". The National. 20 April 2019.
- "Scottish Lib Dems unveil Euro election candidates". BBC News. Retrieved 19 April 2019.
- "The list of Conservative MEP candidates for Scotland". Conservative Home.
- "Scotland's main parties reveal candidates for European Parliament elections". The Scotsman. 19 April 2019.
- "EU candidates". UK Independence Party.
- "Who are the MEP candidates in Scotland?". BBC News. 25 April 2019. Retrieved 26 April 2019.
- The Scotsman, 25/26 May 2014 https://www.scotsman.com/news/politics/scottish-european-election-2014-results-1-3422454 N.B.: This also gives the number of votes for each party in each council area.
- European Parliament Information Office in Edinburgh, Newsletter Issue 2, October 2014 http://www.europarl.europa.eu/unitedkingdom/resource/static/files/epio-in-edinburgh---october-newsletter.pdf
- "Vote 2014: European election candidates for Scotland". BBC News. 28 April 2014.
- Scotl, Ballot Box (28 May 2019). "EU Elections 2019 – The Results". Ballot Box Scotland.
- "City of Edinburgh Council" (PDF).
- "BBC NEWS | European Election 2009 | UK Results | Scotland". news.bbc.co.uk.
- "Labour's 2009 EP candidates". Jon Worth Euroblog. 4 April 2008.
- "Conservative Party website, accessed 17 July 2008".
- "CIX ONLINE, accessed 17 July 2008". Archived from the original on 8 May 2009.
- UK Independence Party accessed 28 August 2008 Archived 8 December 2008 at the Wayback Machine
- British National Party Scotland accessed 6 March 2009
- http://www.juryteam.org/region.php?select=scotland
- "2004 Election candidates". UK Office of the European Parliament. Archived from the original on 4 October 2009. Retrieved 4 June 2009.
- "Scotcand".
- "1999 Election candidates". UK Office of the European Parliament. Archived from the original on 28 August 2009. Retrieved 4 June 2009.
- "BBC News | Programmes | Under the skin of the BNP". news.bbc.co.uk.
- "BBC News | Programmes | Under the skin of the BNP". news.bbc.co.uk.
- Black, Andrew (21 March 2013). "Scottish independence: Referendum to be held on 18 September, 2014". BBC News. Retrieved 8 October 2016.
- Carrell, Severin (21 March 2013). "Alex Salmond announces Scottish independence referendum date". The Guardian. ISSN 0261-3077. Retrieved 8 October 2016.
- "Scotland decides on 18 September 2014". 21 March 2013.
External links
| Scottish Parliament | |
|---|---|
| Parliament of Scotland |
|
| Convention of Estates |
|
| UK Parliament |
|
| Local elections | |
| Referendums | |