1996 United States presidential election in Arizona
The 1996 United States presidential election in Arizona took place on November 5, 1996, as part of the 1996 United States presidential election. Voters chose eight representatives, or electors to the Electoral College, who voted for president and vice president.
| |||||||||||||||||||||||||||||||||
| |||||||||||||||||||||||||||||||||
 County Results
| |||||||||||||||||||||||||||||||||
| |||||||||||||||||||||||||||||||||
| Elections in Arizona | ||||||||||
|---|---|---|---|---|---|---|---|---|---|---|
 | ||||||||||
|
||||||||||
|
||||||||||
|
||||||||||
|
|
||||||||||
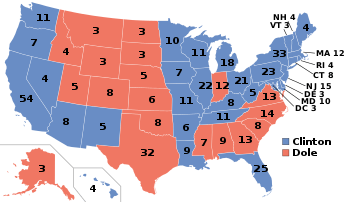
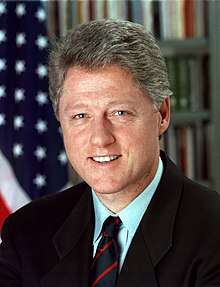
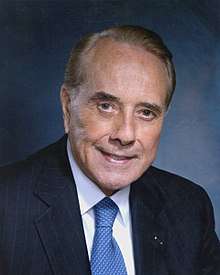
Arizona was won by President Bill Clinton (D) over Senator Bob Dole (R-KS), with Clinton winning 46.52% to 44.29% by a margin of 2.22%.[1][2]
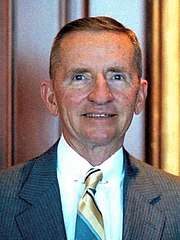
Clinton had come fairly close to winning Arizona four years earlier. In his re-election bid, he was able to gain a larger share of the vote in Democratic-trending Pima County as well as most of northern Arizona. He also increased his support in Maricopa County, although it was again carried by the Republican candidate. His statewide margin of victory was slightly over 31,000 votes out of about 1.4 million cast. Billionaire businessman Ross Perot (Reform-TX) finished in third, with 7.98% of the popular vote. Exit polls suggest he did not change the outcome.[3] As of the 2016 presidential election, this is the last time that a Democrat won Arizona in a presidential election. Had Dole won the state, Arizona would have the longest streak of consecutive Republican wins, last voting Democratic in 1948. This was also the last election in which the following counties have voted for a Democratic presidential candidate: Gila, Greenlee, Navajo, Pinal and La Paz.[4]
This is the only presidential election in Arizona's history in which Maricopa County, containing more than half of Arizona's population as of 2016, and Yavapai County, home to the major city of Prescott, voted for a candidate that lost the state.
Results
| 1996 United States presidential election in Arizona | ||||||
|---|---|---|---|---|---|---|
| Party | Candidate | Running mate | Votes | Percentage | Electoral votes | |
| Democratic | Bill Clinton (incumbent) | Al Gore | 653,288 | 46.52% | 8 | |
| Republican | Robert Dole | Jack Kemp | 622,073 | 44.29% | 0 | |
| Reform | Ross Perot | Patrick Choate | 112,072 | 7.98% | 0 | |
| Libertarian | Harry Browne | Jo Jorgensen | 14,358 | 1.02% | 0 | |
| Green | Ralph Nader | Winona LaDuke | 2,062 | 0.15% | 0 | |
| U.S. Taxpayers' | Howard Phillips | 347 | 0.02% | 0 | ||
| Natural Law | Dr. John Hagelin | Dr. V. Tompkins | 153 | 0.01% | 0 | |
| No Party | Charles Collins | Rosemary Giumarra | 36 | 0.00% | 0 | |
| No party | Write-in | 16 | 0.00% | 0 | ||
| Totals | 1,404,405 | 100.00% | 8 | |||
Results by county
| County | William Jefferson Clinton Democratic |
Robert Joseph Dole Republican |
Henry Ross Perot Reform |
Harry Browne[2] Libertarian |
Various candidates[2] Other parties |
Margin | Total votes cast | ||||||
|---|---|---|---|---|---|---|---|---|---|---|---|---|---|
| # | % | # | % | # | % | # | % | # | % | # | % | ||
| Apache | 12,394 | 66.33% | 4,761 | 25.48% | 1,296 | 6.94% | 204 | 1.09% | 29 | 0.16% | 7,633 | 40.85% | 18,684 |
| Cochise | 13,782 | 43.17% | 14,365 | 45.00% | 3,346 | 10.48% | 383 | 1.20% | 47 | 0.15% | -583 | -1.83% | 31,923 |
| Coconino | 20,475 | 53.15% | 13,638 | 35.40% | 3,666 | 9.52% | 609 | 1.58% | 137 | 0.36% | 6,837 | 17.75% | 38,522 |
| Gila | 8,577 | 49.26% | 6,407 | 36.80% | 2,211 | 12.70% | 204 | 1.17% | 12 | 0.07% | 2,170 | 12.46% | 17,411 |
| Graham | 3,938 | 42.36% | 4,222 | 45.42% | 1,034 | 11.12% | 100 | 1.08% | 2 | 0.02% | -284 | -3.06% | 9,296 |
| Greenlee | 1,755 | 51.72% | 1,159 | 34.16% | 426 | 12.56% | 53 | 1.56% | 0 | 0.00% | 596 | 17.57% | 3,393 |
| La Paz | 1,964 | 43.71% | 1,902 | 42.33% | 597 | 13.29% | 30 | 0.67% | 0 | 0.00% | 62 | 1.38% | 4,493 |
| Maricopa | 363,991 | 44.53% | 386,015 | 47.22% | 58,479 | 7.15% | 7,551 | 0.92% | 1,396 | 0.17% | -22,024 | -2.69% | 817,432 |
| Mohave | 16,629 | 40.04% | 17,997 | 43.33% | 6,369 | 15.33% | 481 | 1.16% | 57 | 0.14% | -1,368 | -3.29% | 41,533 |
| Navajo | 12,912 | 51.78% | 9,262 | 37.14% | 2,461 | 9.87% | 272 | 1.09% | 31 | 0.12% | 3,650 | 14.64% | 24,938 |
| Pima | 137,983 | 52.16% | 104,121 | 39.36% | 18,809 | 7.11% | 2,894 | 1.09% | 745 | 0.28% | 33,862 | 12.80% | 264,552 |
| Pinal | 19,579 | 53.07% | 13,034 | 35.33% | 3,972 | 10.77% | 293 | 0.79% | 17 | 0.05% | 6,545 | 17.74% | 36,895 |
| Santa Cruz | 5,241 | 64.17% | 2,256 | 27.62% | 600 | 7.35% | 65 | 0.80% | 5 | 0.06% | 2,985 | 36.55% | 8,167 |
| Yavapai | 21,801 | 36.64% | 29,921 | 50.29% | 6,649 | 11.18% | 1,009 | 1.70% | 115 | 0.19% | -8,120 | -13.65% | 59,495 |
| Yuma | 12,267 | 44.33% | 13,013 | 47.03% | 2,157 | 7.80% | 210 | 0.76% | 24 | 0.09% | -746 | -2.70% | 27,671 |
| Totals | 653,288 | 46.52% | 622,073 | 44.29% | 112,072 | 7.98% | 14,358 | 1.02% | 2,614 | 0.19% | 31,215 | 2.22% | 1,404,405 |
References
- Dave Leip’s U.S. Election Atlas; 1996 Presidential General Election Results – Arizona
- Our Campaigns; AZ US President Race, November 05, 1996
- http://www.cnn.com/ELECTION/AZPxp.html
- Sullivan, Robert David; ‘How the Red and Blue Map Evolved Over the Past Century’; America Magazine in The National Catholic Review; June 29, 2016