Hammersmith and Fulham London Borough Council election, 2010
| |||||||||||||||||||||||||
All 46 seats to Hammersmith and Fulham London Borough Council 24 seats needed for a majority | |||||||||||||||||||||||||
|---|---|---|---|---|---|---|---|---|---|---|---|---|---|---|---|---|---|---|---|---|---|---|---|---|---|
| Turnout |
61.9% ( | ||||||||||||||||||||||||
| |||||||||||||||||||||||||
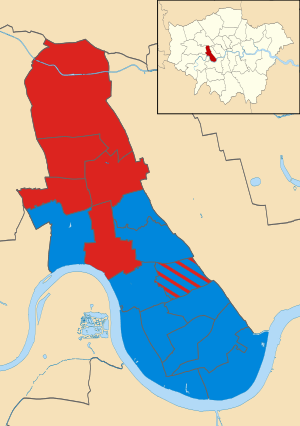 Map of the results of the 2010 Hammersmith and Fulham council election. Conservatives in blue and Labour in red. | |||||||||||||||||||||||||
| |||||||||||||||||||||||||
Elections for Hammersmith and Fulham Council in London were held on 6 May 2010. The 2010 United Kingdom General Election and other local elections took place on the same day.
In London council elections the entire council is elected every four years, as opposed to some local elections where one councillor is elected every year in three of the four years.
Summary of results
| Party | Seats | Gains | Losses | Net gain/loss | Seats % | Votes % | Votes | +/− | |
|---|---|---|---|---|---|---|---|---|---|
| Conservative | 31 | 0 | 2 | -2 | 67% | 44.6% | 94,246 | -5.8% | |
| Labour | 15 | 2 | 0 | +2 | 33% | 34.5% | 72,896 | +1.4% | |
| Liberal Democrat | 0 | 0 | 0 | 0 | 0% | 20.0% | 42229 | +6.1% | |
| Green | 0 | 0 | 0 | 0 | 0% | 0.7% | 1500 | +0.2% | |
After taking control four years previously at the last election, the Conservative Party maintained control - with just two seats changing hands.
Ward results
The borough is divided into 16 electoral wards, all bar two electing three councillors apiece[3][4].
Addison
| Party | Candidate | Votes | % | ± | |
|---|---|---|---|---|---|
| Conservative | Chalk, Alex | 2320 | 39.4% | ||
| Conservative | Donovan, Belinda C. Ms. * | 2226 | |||
| Conservative | Tobias, Peter H.J. * | 2027 | |||
| Labour | Ellard, Andrew | 1657 | 28.2% | ||
| Labour | Jones, Elizabeth Ms. | 1632 | |||
| Labour | Smallman, Melanie Ms. | 1572 | |||
| Liberal Democrat | Burden, Janet L. Ms. | 1251 | 21.3% | ||
| Liberal Democrat | Empson, Sally J. Ms. | 1169 | |||
| Liberal Democrat | Sutton, John B. | 829 | |||
| Green | Faull, Gareth | 653 | 11.1% | ||
Askew
| Party | Candidate | Votes | % | ± | |
|---|---|---|---|---|---|
| Labour | Needham, Caroline Ms. | 2616 | 43.9% | ||
| Labour | Vaughan, Rory * | 2346 | |||
| Labour | Homan, Lisa Ms. * | 2304 | |||
| Liberal Democrat | Bristow, Nathalie Y.C. Ms. | 1749 | 29.4% | ||
| Liberal Democrat | Bewley, Henrietta S. Ms. | 1675 | |||
| Conservative | Howard, John | 1591 | 26.7% | ||
| Conservative | Cann, David | 1570 | |||
| Liberal Democrat | Easthope, Rob | 1362 | |||
| Conservative | Izard, Kayser | 1302 | |||
Avonmore & Brook Green
| Party | Candidate | Votes | % | ± | |
|---|---|---|---|---|---|
| Conservative | Binmore, Helen Ms. | 2505 | 45.4% | ||
| Conservative | Carlebach, Joe | 2243 | |||
| Conservative | Iggulden, Robert * | 2192 | |||
| Labour | Allen, Chris | 1534 | 27.8% | ||
| Labour | Power, Dan | 1424 | |||
| Labour | Burke, Stephen | 1402 | |||
| Liberal Democrat | Harris, Suzanna C. Ms. | 1279 | 23.2% | ||
| Liberal Democrat | Impey, Rufus A. | 955 | |||
| Liberal Democrat | Miller, Thomas D. | 921 | |||
| Independent | Gillard-Marshall, Seraphina Ms. | 200 | 3.6% | ||
College Park & Old Oak
| Party | Candidate | Votes | % | ± | |
|---|---|---|---|---|---|
| Labour | Chumnery, Elaine Ms. | 1718 | 52.6% | ||
| Labour | Harcourt, Wesley S. * | 1694 | |||
| Conservative | Hennessy, Tony | 716 | 21.9% | ||
| Conservative | Higton, Mark | 639 | |||
| Liberal Democrat | Jones, Meghan A. Ms. | 462 | 14.2% | ||
| Liberal Democrat | Batstone, Dinti W. | 411 | |||
| Green | Miles, Rollo | 267 | 8.2% | ||
| Independent | Brennan, Stephen P. | 102 | 3.1% | ||
Fulham Broadway
| Party | Candidate | Votes | % | ± | |
|---|---|---|---|---|---|
| Conservative | Brocklebank-Fowler, Victoria S.A. Ms. * | 2178 | 49.2% | ||
| Conservative | Ford, Rachel Ms. * | 2131 | |||
| Conservative | Thorley, Matt | 2007 | |||
| Labour | Butler, Tom | 1369 | 31.0% | ||
| Labour | Cash, Tony | 1311 | |||
| Labour | Napier, Charlie | 1138 | |||
| Liberal Democrat | Kennedy, Laura Ms. | 876 | 19.8% | ||
| Liberal Democrat | Bassford, Daniel P. | 874 | |||
| Liberal Democrat | Binnell, Brynn A. | 813 | |||
Fulham Reach
| Party | Candidate | Votes | % | ± | |
|---|---|---|---|---|---|
| Conservative | Donovan, Gavin * | 2177 | 43.6% | ||
| Conservative | Graham, Peter | 2146 | |||
| Conservative | Johnson, Andrew * | 2030 | |||
| Labour | Lukey, Vivienne J. Ms. | 1806 | 36.1% | ||
| Labour | Mills, James | 1790 | |||
| Labour | Rathbone, Jill Ms. | 1679 | |||
| Liberal Democrat | Barnes, Gillian Ms. | 1014 | 20.3% | ||
| Liberal Democrat | Clements, Lee J. | 817 | |||
| Liberal Democrat | Perrin, Julie C. Ms. | 772 | |||
Hammersmith Broadway
| Party | Candidate | Votes | % | ± | |
|---|---|---|---|---|---|
| Labour | Cowan, Stephen * | 2186 | 43.6% | ||
| Labour | Cartwright, Michael * | 2177 | |||
| Labour | Murphy, PJ | 2129 | |||
| Conservative | Glenny, Chris | 1792 | 35.7% | ||
| Conservative | Largan, Robert | 1665 | |||
| Conservative | Large, Dan | 1614 | |||
| Liberal Democrat | Defries, Emma P.J. Ms. | 1035 | 20.6% | ||
| Liberal Democrat | Harris, Ian J. | 953 | |||
| Liberal Democrat | Thomas, Jonathan D.C. | 783 | |||
Munster
| Party | Candidate | Votes | % | ± | |
|---|---|---|---|---|---|
| Conservative | Adam, Michael F. * | 2924 | 55.2% | ||
| Conservative | Alford, Adronie E. Ms. * | 2792 | |||
| Conservative | Karmel, Alex * | 2647 | |||
| Labour | Hunter, William | 902 | 17.0% | ||
| Liberal Democrat | Priestner, Ian D. | 890 | 16.8% | ||
| Liberal Democrat | Smith, Robert C. | 781 | |||
| Labour | Kadoo, Mr | 747 | |||
| Labour | Stanley, Simon | 681 | |||
| Liberal Democrat | Studd, James B. | 663 | |||
| Green | Baker, Rupert J. | 580 | 11.0% | ||
North End
| Party | Candidate | Votes | % | ± | |
|---|---|---|---|---|---|
| Conservative | Cooney, Georgie Ms. | 2125 | 41.6% | ||
| Labour | Brown, Daryl Ms. | 1987 | 38.9% | ||
| Conservative | Crofts, Tom | 1979 | |||
| Conservative | Ffiske, Caroline R. Ms. * | 1842 | |||
| Labour | Schmid, Max | 1697 | |||
| Labour | Turmaine, Matt | 1679 | |||
| Liberal Democrat | Falkner, Robert | 998 | 19.5% | ||
| Liberal Democrat | Mcveigh, Patrick C. | 810 | |||
| Liberal Democrat | Oliaji, Meher | 774 | |||
Palace Riverside
| Party | Candidate | Votes | % | ± | |
|---|---|---|---|---|---|
| Conservative | Johnson, Donald M. * | 2459 | 62.1% | ||
| Conservative | Ginn, Marcus W.P. | 2285 | |||
| Liberal Democrat | Buchan, Rachel J. Ms. | 856 | 21.6% | ||
| Liberal Democrat | Dragadze, Tamara Ms. | 758 | |||
| Labour | Lukey, Frank | 645 | 16.3% | ||
| Labour | Treloggan, Charlie | 530 | |||
Parson's Green & Walham
| Party | Candidate | Votes | % | ± | |
|---|---|---|---|---|---|
| Conservative | Botterill, Nick * | 3320 | 67.7% | ||
| Conservative | Stainton, Frances M. Ms. * | 3036 | |||
| Conservative | Loveday, Mark A. * | 3003 | |||
| Labour | Homan, Rob | 816 | 16.6% | ||
| Liberal Democrat | Bagwell, William H. | 766 | 15.6% | ||
| Liberal Democrat | Gerson, Delia R. Ms. | 763 | |||
| Liberal Democrat | Buchanan-Barrow, Paul M. | 682 | |||
| Labour | Liburd, Joan Ms. | 676 | |||
| Labour | Stead, Barrie | 561 | |||
Ravenscourt Park
| Party | Candidate | Votes | % | ± | |
|---|---|---|---|---|---|
| Conservative | Ivimy, Lucy V. Ms. * | 2300 | 42.6% | ||
| Conservative | Dewhirst, Charlie | 2143 | |||
| Conservative | Phibbs, Richard H. * | 2107 | |||
| Labour | Bailey, Olivia J. Ms. | 1855 | 34.3% | ||
| Labour | Cobb, Nic | 1609 | |||
| Labour | Dennistoun, Felicity Ms. | 1500 | |||
| Liberal Democrat | Cook, Michael F. | 1247 | 23.1% | ||
| Liberal Democrat | Goldstein, Callum J. | 1151 | |||
| Liberal Democrat | Goldstein, Margaret C. Ms. | 1128 | |||
Sands End
| Party | Candidate | Votes | % | ± | |
|---|---|---|---|---|---|
| Conservative | De Lisle, Ali Ms. | 2547 | 49.6% | ||
| Conservative | Hamilton, Stephen J. * | 2409 | |||
| Conservative | Law, Jane V. Ms. * | 2361 | |||
| Labour | Bird, Brendan | 1626 | 31.7% | ||
| Labour | Lawrence, Ron | 1410 | |||
| Labour | Patterson, Bryanna Ms. | 1290 | |||
| Liberal Democrat | Buchanan-Barrow, Eithne A. | 957 | 18.7% | ||
| Liberal Democrat | Gibbons, Reuben L.B. | 889 | |||
| Liberal Democrat | Mckelvie, Allan W. | 830 | |||
Shepherd's Bush Green
| Party | Candidate | Votes | % | ± | |
|---|---|---|---|---|---|
| Labour | Coleman, Iain | 2389 | 46.4% | ||
| Labour | Jones, Andrew | 2277 | |||
| Labour | Umeh, Mercy Ms. * | 2275 | |||
| Conservative | Evans, Alex | 1450 | 28.2% | ||
| Conservative | Macdonald, Andrew J. | 1267 | |||
| Conservative | St. Clair, Liz Ms. | 1184 | |||
| Liberal Democrat | Lastman, Robert | 1113 | 21.6% | ||
| Liberal Democrat | Owen, Patricia Ms. | 1023 | |||
| Liberal Democrat | Lidou, Annik C. Ms. | 900 | |||
| UKIP | Crichton, Vanessa Ms. | 192 | 3.7% | ||
Town
| Party | Candidate | Votes | % | ± | |
|---|---|---|---|---|---|
| Conservative | Craig, Oliver D. * | 2639 | 56.0% | ||
| Conservative | Stephen Greenhalgh* | 2548 | |||
| Conservative | Smith, Greg * | 2399 | |||
| Liberal Democrat | Kennedy, Paul | 1117 | 23.7% | ||
| Liberal Democrat | Braund, Henry C. | 989 | |||
| Labour | Coleman, Ben | 960 | 20.4% | ||
| Liberal Democrat | Muir, Graham P. | 886 | |||
| Labour | Cardigan, Oliver P. | 882 | |||
| Labour | Shepherd, Natalia P. Ms. | 837 | |||
Wormholt & White City
| Party | Candidate | Votes | % | ± | |
|---|---|---|---|---|---|
| Labour | Campbell, Jean Ms. * | 3052 | 60.1% | ||
| Labour | Aherne, Colin * | 2971 | |||
| Labour | Powell, Sally Ms. * | 2813 | |||
| Conservative | Frew, Robert | 1186 | 23.3% | ||
| Conservative | Adetuberu, Nini Ms. | 1152 | |||
| Conservative | Cranfield, Evan Ms. | 1071 | |||
| Liberal Democrat | Handover, Mary E. Ms. | 843 | 16.6% | ||
| Liberal Democrat | Morris, Stephen J. | 727 | |||
| Liberal Democrat | Remy, Catherine E.R. Ms. | 723 | |||
References
- ↑ "Archived copy". Archived from the original on 11 May 2010. Retrieved 23 May 2010.
- ↑ "Hammersmith and Fulham". London Councils. Archived from the original on 11 May 2010. Retrieved 9 May 2010.
- ↑ https://data.london.gov.uk/dataset/borough-council-election-results-2010
- ↑ http://www.andrewteale.me.uk/leap/results/2010/8/
| Mayor of London | |
|---|---|
| London Assembly | |
| Inner London Education Authority | |
| Greater London Council | |
| London County Council | |
| Borough Councils | |
| Referendums | |
| |
This article is issued from
Wikipedia.
The text is licensed under Creative Commons - Attribution - Sharealike.
Additional terms may apply for the media files.