Sunderland City Council election, 2010
|
| |||||||||||||||||||||||||||||||||||||||||||||||
| |||||||||||||||||||||||||||||||||||||||||||||||
One third of 75 seats on Sunderland City Council 38 seats needed for a majority | |||||||||||||||||||||||||||||||||||||||||||||||
|---|---|---|---|---|---|---|---|---|---|---|---|---|---|---|---|---|---|---|---|---|---|---|---|---|---|---|---|---|---|---|---|---|---|---|---|---|---|---|---|---|---|---|---|---|---|---|---|
| |||||||||||||||||||||||||||||||||||||||||||||||
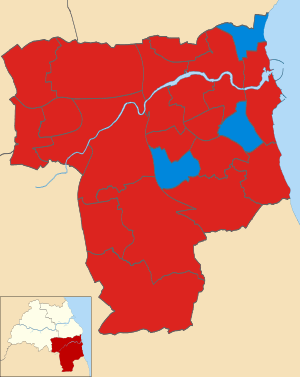 Map of the 2010 Sunderland City Council election results. Labour in red and Conservatives in blue. | |||||||||||||||||||||||||||||||||||||||||||||||
| |||||||||||||||||||||||||||||||||||||||||||||||
The 2010 Sunderland Council election took place on 6 May 2010 to elect members of Sunderland Metropolitan Borough Council in Tyne and Wear, England. One third of the council was up for election and the Labour party stayed in overall control of the council.[1] The election took place on the same day as the 2010 General Election.
Campaign
Before the election Sunderland council had 48 Labour, 21 Conservative, 1 Liberal Democrat and 5 Independent councillors.[2] The Independents were made up of 4 in an alliance and 1, Eddie Wake, described as an "Independent Conservative" having been suspended from the Conservative Party in the period since the last local elections in May 2008.[3]
In total 89 candidates stood for the 25 seats being contested, with a full 25 from the Labour party, 23 Conservatives, 23 Liberal Democrats, 12 British National Party, 2 Green Party and 4 Independents.[2] This was a substantial decline in candidates for the British National Party, which in previous years had contested every ward.[2] The 2 seats not contested by the Conservative party in Copt Hill and Houghton were where Independent candidates had been successful in previous years, with the Conservative party leader on the council Lee Martin saying the party would not have been able to win the seats.[2] The seats were again contested by Independents campaigning against the Houghton Quarry landfill site.[2]
Labour were confident of making gains, pointing to the lowest council tax in the North East and efforts to improve schools and address unemployment.[2] However the Conservatives were also looking to make gains and particularly targeted seats they had previously won in Doxford, Ryhope and Washington South.[2]
Election results
The results saw the Labour party increase their majority on the council after gaining 4 seats to hold 52 of the 75 seats.[4] Labour held every seat they had been defending, while gaining seats from the Conservatives in Barnes, St Peter's and Washington East, and taking Millfield from an Independent, Peter Maddison.[5] Peter Maddison, who was deputy leader of the Independent group, came last in Millfield with 133 votes and independents also failed to take Copt Hill and Houghton.[6] Meanwhile, the Liberal Democrats failed to win any seats, but did see an increase in votes for the party.[6] Overall turnout was 55.02%, compared to 34.9% at the 2008 election, with the highest turnout in Fulwell at 68%.[7]
The Conservative leader on the council Lee Martin put his parties failure down to a higher turnout due to the election taking place at the same time as the general election and a higher than usual vote share for the Liberal Democrats.[5] Following the election Lee Martin resigned as leader of the Conservative group and was succeeded by Tony Morrissey.[8]
| Party | Seats | Gains | Losses | Net gain/loss | Seats % | Votes % | Votes | +/− | |
|---|---|---|---|---|---|---|---|---|---|
| Labour | 22 | 4 | 0 | 88 | 49 | 57,058 | |||
| Conservative | 3 | 0 | 3 | 12 | 25.2 | 29,358 | |||
| Liberal Democrat | 0 | 0 | 0 | 0 | 18.3 | 21,290 | |||
| Independent | 0 | 0 | 1 | 0 | 4 | 4,621 | |||
| BNP | 0 | 0 | 0 | 0 | 3.3 | 3,886 | |||
| Green | 0 | 0 | 0 | 0 | 0.3 | 325 | |||
This resulted in the following composition of the Council:[10]
| Party | Previous Council | New Council | |
|---|---|---|---|
| Labour | 48 | 52 | |
| Conservatives | 21 | 18 | |
| Independent | 5 | 4 | |
| Liberal Democrats | 1 | 1 | |
| Total | 75 | 75 | |
| Working majority | 21 | 29 | |
Ward by ward results
Barnes ward
| Party | Candidate | Votes | % | ± | |
|---|---|---|---|---|---|
| Labour | Michael Essl | 2,280 | 41.2 | +16.8 | |
| Conservative | Angela Barkess | 1,991 | 36.0 | -15.6 | |
| Liberal Democrat | Gouilnara Dixon | 1,001 | 18.1 | +3.4 | |
| BNP | Ethan Maggiore | 265 | 4.8 | -4.5 | |
| Majority | 289 | 5.2 | |||
| Turnout | 5,537 | 62.6 | +24.6 | ||
| Labour gain from Conservative | Swing | ||||
Castle ward
| Party | Candidate | Votes | % | ± | |
|---|---|---|---|---|---|
| Labour | Doris MacKnight | 2,173 | 51.3 | -1.5 | |
| Independent | Tony Clarke | 774 | 18.3 | +8.2 | |
| Liberal Democrat | Jon Dewart | 505 | 11.9 | +4.9 | |
| Conservative | Geoffrey Scott | 449 | 10.6 | -2.6 | |
| BNP | Ian McDonald | 338 | 8.0 | -5.4 | |
| Majority | 1,399 | 33.0 | -6.4 | ||
| Turnout | 4,239 | 50.0 | +19.5 | ||
| Labour hold | Swing | ||||
Copt Hill ward
| Party | Candidate | Votes | % | ± | |
|---|---|---|---|---|---|
| Labour | Bob Heron | 2,174 | 45.0 | +10.5 | |
| Independent | Paul Marriner | 1,971 | 40.8 | -4.8 | |
| Liberal Democrat | Louise Powell | 687 | 14.2 | +14.2 | |
| Majority | 203 | 4.2 | |||
| Turnout | 4,832 | 55.2 | +18.5 | ||
| Labour hold | Swing | ||||
Doxford ward
| Party | Candidate | Votes | % | ± | |
|---|---|---|---|---|---|
| Labour | Betty Gibson | 2,463 | 52.0 | +17.0 | |
| Conservative | John Wiper | 1,411 | 29.8 | -11.8 | |
| Liberal Democrat | David Sullivan | 867 | 18.3 | +5.2 | |
| Majority | 1,052 | 22.2 | |||
| Turnout | 4,741 | 60.7 | +25.0 | ||
| Labour hold | Swing | ||||
Fulwell ward
| Party | Candidate | Votes | % | ± | |
|---|---|---|---|---|---|
| Conservative | George Howe | 2,797 | 45.2 | -8.0 | |
| Labour | Barry Curran | 2,208 | 35.7 | +9.5 | |
| Liberal Democrat | Geoffrey Pryke | 1,186 | 19.2 | +7.5 | |
| Majority | 589 | 9.5 | -17.4 | ||
| Turnout | 6,191 | 68.4 | +24.9 | ||
| Conservative hold | Swing | ||||
Hendon ward
| Party | Candidate | Votes | % | ± | |
|---|---|---|---|---|---|
| Labour | Barbara McClennan | 1,976 | 52.7 | +16.3 | |
| Conservative | Sammy Doran | 994 | 26.5 | +5.0 | |
| Liberal Democrat | Nathan Hazlett | 779 | 20.8 | +11.7 | |
| Majority | 982 | 26.2 | +13.0 | ||
| Turnout | 3,749 | 44.7 | +15.2 | ||
| Labour hold | Swing | ||||
Hetton ward
| Party | Candidate | Votes | % | ± | |
|---|---|---|---|---|---|
| Labour | David Tate | 2,465 | 56.1 | -13.1 | |
| Liberal Democrat | Philip Dowell | 966 | 22.0 | +22.0 | |
| Conservative | Paula Wilkinson | 575 | 13.1 | -17.7 | |
| BNP | John Richardson | 389 | 8.9 | +8.9 | |
| Majority | 1,499 | 34.1 | -4.3 | ||
| Turnout | 4,395 | 50.4 | +19.8 | ||
| Labour hold | Swing | ||||
Houghton ward
| Party | Candidate | Votes | % | ± | |
|---|---|---|---|---|---|
| Labour | Dennis Richardson | 2,290 | 47.1 | +10.1 | |
| Independent | John Ellis | 1,743 | 35.9 | -8.9 | |
| Liberal Democrat | David Snowball | 824 | 17.0 | +17.0 | |
| Majority | 547 | 11.3 | |||
| Turnout | 4,857 | 54.7 | +18.9 | ||
| Labour hold | Swing | ||||
Millfield ward
| Party | Candidate | Votes | % | ± | |
|---|---|---|---|---|---|
| Labour | Iain Kay | 1,363 | 38.6 | +14.3 | |
| Liberal Democrat | Jim Major | 1,241 | 35.1 | -10.9 | |
| Conservative | Vijaya Das | 580 | 16.4 | +1.4 | |
| BNP | Edward McFarlane | 217 | 6.1 | -1.7 | |
| Independent | Peter Maddison† | 133 | 3.8 | +0.1 | |
| Majority | 122 | 3.5 | |||
| Turnout | 3,534 | 48.0 | +15.7 | ||
| Labour gain from Liberal Democrat | Swing | ||||
†Peter Maddison had been elected in 2006 as a Liberal Democrat candidate, but subsequently left the party to sit as an Independent councillor. As such, this win for Labour was technically a gain from the Liberal Democrats.
Pallion ward
| Party | Candidate | Votes | % | ± | |
|---|---|---|---|---|---|
| Labour | Cecilia Gofton | 1,866 | 51.4 | +7.1 | |
| Conservative | Peter O'Connor | 739 | 20.3 | -6.8 | |
| Liberal Democrat | Amanda Robinson | 709 | 19.5 | +6.7 | |
| BNP | Lynne Hudson | 318 | 8.8 | -7.0 | |
| Majority | 1,127 | 31.0 | +13.8 | ||
| Turnout | 3,632 | 48.7 | +17.1 | ||
| Labour hold | Swing | ||||
Redhill ward
| Party | Candidate | Votes | % | ± | |
|---|---|---|---|---|---|
| Labour | Paul Stewart | 2,669 | 69.5 | +20.0 | |
| Conservative | Martin Anderson | 684 | 17.8 | +7.3 | |
| BNP | Terence Woolford | 490 | 12.8 | -6.7 | |
| Majority | 1,985 | 51.7 | +21.6 | ||
| Turnout | 3,843 | 45.2 | +14.2 | ||
| Labour hold | Swing | ||||
Ryhope ward
| Party | Candidate | Votes | % | ± | |
|---|---|---|---|---|---|
| Labour | Alan Emerson | 2,904 | 62.7 | +30.0 | |
| Conservative | Shaun Cudworth | 1,727 | 37.3 | +3.6 | |
| Majority | 1,177 | 25.4 | |||
| Turnout | 4,631 | 58.1 | +21.8 | ||
| Labour hold | Swing | ||||
Sandhill ward
| Party | Candidate | Votes | % | ± | |
|---|---|---|---|---|---|
| Labour | David Allan | 2,197 | 57.6 | +10.6 | |
| Conservative | Paul Tweddle | 842 | 22.1 | -3.9 | |
| Liberal Democrat | Robert Peel | 778 | 20.4 | +7.5 | |
| Majority | 1,355 | 35.5 | +14.5 | ||
| Turnout | 3,817 | 46.5 | +15.8 | ||
| Labour hold | Swing | ||||
Shiney Row ward
| Party | Candidate | Votes | % | ± | |
|---|---|---|---|---|---|
| Labour | Mel Speding | 2,974 | 54.3 | +5.9 | |
| Conservative | Malcolm Vardy | 1,420 | 25.9 | -1.8 | |
| Liberal Democrat | Carol Attewell | 1,083 | 19.8 | +6.7 | |
| Majority | 1,554 | 28.4 | +7.7 | ||
| Turnout | 5,477 | 56.1 | +22.7 | ||
| Labour hold | Swing | ||||
Silksworth ward
| Party | Candidate | Votes | % | ± | |
|---|---|---|---|---|---|
| Labour | Philip Tye | 2,740 | 57.7 | +8.4 | |
| Conservative | Dominic McDonough | 1,126 | 23.7 | -4.7 | |
| Liberal Democrat | Andy Bex | 881 | 18.6 | +9.6 | |
| Majority | 1,614 | 34.0 | +13.1 | ||
| Turnout | 4,747 | 56.7 | +20.0 | ||
| Labour hold | Swing | ||||
Southwick ward
| Party | Candidate | Votes | % | ± | |
|---|---|---|---|---|---|
| Labour | Norma Wright | 2,145 | 54.1 | +10.6 | |
| Conservative | Terry Docherty | 858 | 21.6 | -4.9 | |
| Liberal Democrat | Anne Griffin | 615 | 15.5 | +5.6 | |
| BNP | John McCaffrey | 350 | 8.8 | -11.2 | |
| Majority | 1,287 | 32.4 | +15.4 | ||
| Turnout | 3,968 | 48.7 | +16.0 | ||
| Labour hold | Swing | ||||
St Anne's ward
| Party | Candidate | Votes | % | ± | |
|---|---|---|---|---|---|
| Labour | Thomas Wright | 2,263 | 58.8 | +13.5 | |
| Liberal Democrat | Simon Dawes | 781 | 20.3 | +4.9 | |
| Conservative | Neil Robinson | 656 | 17.0 | -5.0 | |
| Green | Emily Blyth | 151 | 3.9 | +3.9 | |
| Majority | 1,482 | 38.5 | +15.2 | ||
| Turnout | 3,851 | 46.3 | +16.8 | ||
| Labour hold | Swing | ||||
St Chad's ward
| Party | Candidate | Votes | % | ± | |
|---|---|---|---|---|---|
| Conservative | Robert Oliver | 2,165 | 47.2 | -3.1 | |
| Labour | Darryl Dixon | 1,848 | 40.3 | +3.8 | |
| Liberal Democrat | Sus Wilson | 572 | 12.5 | +6.9 | |
| Majority | 317 | 6.9 | -6.9 | ||
| Turnout | 4,585 | 58.9 | +17.2 | ||
| Conservative hold | Swing | ||||
St Michael's ward
| Party | Candidate | Votes | % | ± | |
|---|---|---|---|---|---|
| Conservative | Paul Maddison | 2,328 | 42.4 | -17.8 | |
| Labour | Juliana Heron | 1,773 | 32.3 | +8.9 | |
| Liberal Democrat | Paul Edgeworth | 1,013 | 18.4 | +8.3 | |
| BNP | Paul Anderson | 206 | 3.7 | -2.7 | |
| Green | John Lowther | 174 | 3.2 | +3.2 | |
| Majority | 555 | 10.1 | -26.6 | ||
| Turnout | 5,494 | 64.2 | +23.4 | ||
| Conservative hold | Swing | ||||
St Peter's ward
| Party | Candidate | Votes | % | ± | |
|---|---|---|---|---|---|
| Labour | Stephen Bonallie | 1,917 | 37.2 | +10.5 | |
| Conservative | Shirley Leadbitter | 1,843 | 35.8 | -12.0 | |
| Liberal Democrat | Diana Matthew | 1,038 | 20.1 | +6.0 | |
| BNP | Derek Wright | 357 | 6.9 | -4.5 | |
| Majority | 74 | 1.4 | |||
| Turnout | 5,155 | 60.4 | +22.6 | ||
| Labour gain from Conservative | Swing | ||||
Washington Central ward
| Party | Candidate | Votes | % | ± | |
|---|---|---|---|---|---|
| Labour | Linda Williams | 2,799 | 53.1 | +12.8 | |
| Conservative | Tina Richardson | 1,256 | 23.8 | -2.4 | |
| Liberal Democrat | John Mclelland | 1,220 | 23.1 | -0.2 | |
| Majority | 1,543 | 29.3 | +15.2 | ||
| Turnout | 5,275 | 60.2 | +23.9 | ||
| Labour hold | Swing | ||||
Washington East ward
| Party | Candidate | Votes | % | ± | |
|---|---|---|---|---|---|
| Labour | Neville Padgett | 2,378 | 45.0 | +4.7 | |
| Conservative | Hilary Johnson | 1,681 | 31.8 | -11.4 | |
| Liberal Democrat | Malcolm Bannister | 990 | 18.7 | +6.2 | |
| BNP | Linda Birtwell | 240 | 4.5 | +0.4 | |
| Majority | 697 | 13.2 | |||
| Turnout | 5,289 | 60.7 | +23.6 | ||
| Labour gain from Conservative | Swing | ||||
Washington North ward
| Party | Candidate | Votes | % | ± | |
|---|---|---|---|---|---|
| Labour | Jill Fletcher | 2,537 | 57.2 | +4.2 | |
| Liberal Democrat | Steve Thomas | 875 | 19.7 | +6.7 | |
| Conservative | Tracy Young | 624 | 14.1 | -8.1 | |
| BNP | James Reed | 396 | 8.9 | -2.8 | |
| Majority | 1,662 | 37.5 | +6.7 | ||
| Turnout | 4,432 | 51.2 | +18.9 | ||
| Labour hold | Swing | ||||
Washington South ward
| Party | Candidate | Votes | % | ± | |
|---|---|---|---|---|---|
| Labour | Graeme Miller | 2,062 | 41.4 | +3.8 | |
| Conservative | Joyce Wake | 1,586 | 31.8 | -10.7 | |
| Liberal Democrat | David Griffin | 1,333 | 26.8 | +14.3 | |
| Majority | 476 | 9.6 | |||
| Turnout | 4,981 | 60.7 | +23.2 | ||
| Labour hold | Swing | ||||
Washington West ward
| Party | Candidate | Votes | % | ± | |
|---|---|---|---|---|---|
| Labour | Dorothy Trueman | 2,594 | 49.4 | +3.3 | |
| Liberal Democrat | Irene Bannister | 1,316 | 25.0 | +7.2 | |
| Conservative | Olwyn Bird | 1,026 | 19.5 | -5.8 | |
| BNP | Rian Birtwell | 320 | 6.1 | -4.7 | |
| Majority | 1,278 | 24.3 | +3.5 | ||
| Turnout | 5,256 | 58.4 | +24.5 | ||
| Labour hold | Swing | ||||
References
- ↑ "Sunderland". BBC News Online. 2009-04-19. Retrieved 2010-12-31.
- 1 2 3 4 5 6 7 Robertson, Ross (2010-04-09). "Battle begins for your vote". Sunderland Echo.
- ↑ "Rape joke councillor suspended". Retrieved 2018-07-03.
- ↑ Hunt, Amy (2010-05-08). "Labour victorious in local elections". The Journal. p. 9.
- 1 2 "Good night for Labour in local elections". Sunderland Echo. 2010-05-07.
- 1 2 "Bad night for independents in council elections". Sunderland Echo. 2010-05-07.
- ↑ "All the results from Tyneside and Wearside's local councils". Evening Chronicle. 2010-05-08. p. 2.
- ↑ "City Tories name new leader". Sunderland Echo. 2010-05-18.
- 1 2 3 4 5 6 7 8 9 10 11 12 13 14 15 16 17 18 19 20 21 22 23 24 25 26 "Results of Poll". Sunderland City Council. Retrieved 2010-12-31.
- 1 2 "Local elections 2010". London: guardian.co.uk. 2010-05-07. Retrieved 2010-12-31.
| Preceded by Sunderland City Council election, 2008 |
Sunderland City Council elections | Succeeded by Sunderland City Council election, 2011 |
| Gateshead Metropolitan Borough Council | |
|---|---|
| Newcastle City Council | |
| North Tyneside Metropolitan Borough Council | |
| South Tyneside Metropolitan Borough Council | |
| Sunderland City Council | |
| Tyne and Wear County Council |
|
| |