Central Suffolk and North Ipswich (UK Parliament constituency)
| Central Suffolk and North Ipswich | |
|---|---|
|
County constituency for the House of Commons | |
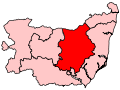 Boundary of Central Suffolk and North Ipswich in Suffolk. | |
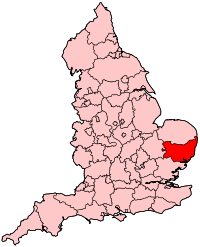 Location of Suffolk within England. | |
| County | Suffolk |
| Population | 98,935 (2011 census)[1] |
| Electorate | 76,177 (December 2010)[2] |
| Current constituency | |
| Created | 1997 |
| Member of parliament | Dan Poulter (Conservative) |
| Number of members | One |
| Created from | Central Suffolk |
| Overlaps | |
| European Parliament constituency | East of England |
Central Suffolk and North Ipswich is a constituency[n 1] represented in the House of Commons of the UK Parliament since 2010 by Dan Poulter of the Conservative Party.[n 2]
History
Sir Michael Lord, knighted in 2001, was the first MP who served the seat, from 1997 until 2010. The 2010 general election saw the fourth win for a Conservative with the election of Dan Poulter.
Boundaries
1997-2010: The District of Mid Suffolk wards of Barham, Barking, Bramford, Claydon, Creeting, Debenham, Eye, Fressingfield, Helmingham, Hoxne, Mendlesham, Palgrave, Stonham, Stradbroke, Wetheringsett, Weybread, and Worlingworth, the District of Suffolk Coastal wards of Bealings, Dennington, Earl Soham, Framlingham, Glemham, Grundisburgh and Witnesham, Hasketon, Kesgrave, Otley, Rushmere, and Wickham Market, and the Borough of Ipswich wards of Broom Hill, Castle Hill, Whitehouse, and Whitton.
2010-present: The District of Mid Suffolk wards of Barking and Somersham, Bramford and Blakenham, Claydon and Barham, Debenham, Eye, Fressingfield, Helmingham and Coddenham, Hoxne, Mendlesham, Palgrave, Stradbroke and Laxfield, The Stonhams, Wetheringsett, and Worlingworth, the District of Suffolk Coastal wards of Earl Soham, Framlingham, Grundisburgh, Hacheston, Kesgrave East, Kesgrave West, Otley, Rushmere St Andrew, Wickham Market, and Witnesham, and the Borough of Ipswich wards of Castle Hill, Whitehouse, and Whitton.
Constituency profile
Central Suffolk and North Ipswich is a Conservative safe seat, primarily made up of rural farming communities and retirement properties. The exception to this are the three wards from Ipswich Borough Council, which polarise support between the Conservatives and Labour, and Kesgrave, a new satellite town, which shows strong support for the Conservatives. The rural areas which make up the majority of the constituency, consistently return a majority of Conservative councillors. The local government make up of the seat, in respect of the number of borough and district councillors elected by party is 27 Conservative, 5 Labour, 4 Independent, 3 Liberal Democrat, and 2 Green. (Barking by-election 2016 was Green gain)
Members of Parliament
| Election | Member[3] | Party | |
|---|---|---|---|
| 1997 | Sir Michael Lord | Conservative | |
| 2010 | Dan Poulter | Conservative | |
Elections
Elections in the 2010s
| Party | Candidate | Votes | % | ± | |
|---|---|---|---|---|---|
| Conservative | Dan Poulter | 33,992 | 60.1 | +4.1 | |
| Labour | Elizabeth Hughes | 16,807 | 29.7 | +10.9 | |
| Liberal Democrat | Aidan Van de Weyer | 2,431 | 4.3 | −1.8 | |
| Green | Regan Scott | 1,659 | 2.9 | −2.0 | |
| UKIP | Stephen Searle | 1,635 | 2.9 | −10.9 | |
| Majority | 17,185 | 30.4 | −6.9 | ||
| Turnout | 56,524 | 72.4 | +1.8 | ||
| Conservative hold | Swing | −3.4 | |||
| Party | Candidate | Votes | % | ± | |
|---|---|---|---|---|---|
| Conservative | Dan Poulter | 30,317 | 56.1 | +5.3 | |
| Labour | Jack Abbott | 10,173 | 18.8 | +2.6 | |
| UKIP | Mark Cole | 7,459 | 13.8 | +9.4 | |
| Liberal Democrat | Jon Neal | 3,314 | 6.1 | −18.8 | |
| Green | Rhodri Griffiths | 2,664 | 4.9 | +2.2 | |
| English Democrat | Tony Holyoak | 162 | 0.3 | N/A | |
| Majority | 20,144 | 37.2 | +11.4 | ||
| Turnout | 54,089 | 68.7 | −1.7 | ||
| Conservative hold | Swing | +1.4 | |||
| Party | Candidate | Votes | % | ± | |
|---|---|---|---|---|---|
| Conservative | Dan Poulter | 27,125 | 50.8 | +6.2 | |
| Liberal Democrat | Andrew Aalders-Dunthorne | 13,339 | 25.0 | +4.7 | |
| Labour | Bhavna Joshi | 8,636 | 16.2 | −12.3 | |
| UKIP | Roy Philpott | 2,361 | 4.4 | +0.9 | |
| Green | Andrew Stringer | 1,452 | 2.7 | −0.6 | |
| Independent | Mark Trevitt | 389 | 0.7 | N/A | |
| New Party | Richard Vass | 118 | 0.2 | N/A | |
| Majority | 13,786 | 25.8 | +10.4 | ||
| Turnout | 53,420 | 70.4 | +3.4 | ||
| Conservative hold | Swing | +0.8 | |||
Elections in the 2000s
| Party | Candidate | Votes | % | ± | |
|---|---|---|---|---|---|
| Conservative | Michael Lord | 22,333 | 43.9 | −0.5 | |
| Labour | Neil Macdonald | 14,477 | 28.5 | −8.6 | |
| Liberal Democrat | Andrew Houseley | 10,709 | 21.1 | +5.0 | |
| UKIP | John West | 1,754 | 3.4 | +1.0 | |
| Green | Martin Wolfe | 1,593 | 3.1 | N/A | |
| Majority | 7,856 | 15.4 | +8.1 | ||
| Turnout | 50,866 | 66.7 | +3.2 | ||
| Conservative hold | Swing | +4.1 | |||
| Party | Candidate | Votes | % | ± | |
|---|---|---|---|---|---|
| Conservative | Michael Lord | 20,924 | 44.4 | +1.8 | |
| Labour | Carol Jones | 17,455 | 37.1 | +1.2 | |
| Liberal Democrat | Ann Elvin | 7,593 | 16.1 | −4.5 | |
| UKIP | Jonathan Wright | 1,132 | 2.4 | N/A | |
| Majority | 3,469 | 7.3 | +0.6 | ||
| Turnout | 47,104 | 63.5 | −11.5 | ||
| Conservative hold | Swing | +0.3 | |||
Elections in the 1990s
| Party | Candidate | Votes | % | ± | |
|---|---|---|---|---|---|
| Conservative | Michael Lord | 22,493 | 42.6 | N/A | |
| Labour | Carol Jones | 18,955 | 35.9 | N/A | |
| Liberal Democrat | Minone Goldspink | 10,886 | 20.6 | N/A | |
| Independent Conservative | Stephanie A. Bennell | 489 | 0.9 | N/A | |
| Majority | 3,538 | 6.7 | N/A | ||
| Turnout | 52,823 | 75.0 | N/A | ||
| Conservative win (new seat) | |||||
See also
Notes and references
- Notes
- ↑ A county constituency (for the purposes of election expenses and type of returning officer)
- ↑ As with all constituencies, the constituency elects one Member of Parliament (MP) by the first past the post system of election at least every five years.
- References
- ↑ "Central Suffolk and North Ipswich: Usual Resident Population, 2011". Neighbourhood Statistics. Office for National Statistics. Retrieved 20 February 2015.
- ↑ "Electorate Figures - Boundary Commission for England". 2011 Electorate Figures. Boundary Commission for England. 4 March 2011. Archived from the original on 6 November 2010. Retrieved 13 March 2011.
- ↑ Leigh Rayment's Historical List of MPs – Constituencies beginning with "S" (part 6)
- ↑ http://www.babergh.gov.uk/assets/Elections/Election-Notices/2017.06.08/CSNI-Statement-of-Persons-Nominated-Notice-of-Poll-and-Situation-of-Polling-Stations.pdf
- ↑ "Suffolk Central & Ipswich North parliamentary constituency - Election 2017" – via www.bbc.co.uk.
- ↑ "Election Data 2015". Electoral Calculus. Archived from the original on 17 October 2015. Retrieved 17 October 2015.
- ↑ "2015 Election Results". BBC News.
- ↑ "Election Data 2010". Electoral Calculus. Archived from the original on 26 July 2013. Retrieved 17 October 2015.
- ↑ "Election Data 2005". Electoral Calculus. Archived from the original on 15 October 2011. Retrieved 18 October 2015.
- ↑ "Election Data 2001". Electoral Calculus. Archived from the original on 15 October 2011. Retrieved 18 October 2015.
- ↑ "Election Data 1997". Electoral Calculus. Archived from the original on 15 October 2011. Retrieved 18 October 2015.
External links
- nomis Constituency Profile for Central Suffolk and North Ipswich — presenting data from the ONS annual population survey and other official statistics.