San Juan, Abra
| San Juan | |
|---|---|
| Municipality | |
| Municipality of San Juan | |
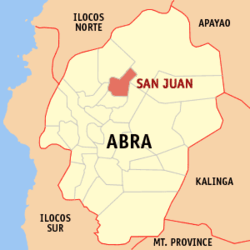 Map of Abra with San Juan highlighted | |
.svg.png) San Juan Location within the Philippines | |
| Coordinates: 17°41′N 120°44′E / 17.68°N 120.73°ECoordinates: 17°41′N 120°44′E / 17.68°N 120.73°E | |
| Country |
|
| Region | Cordillera Administrative Region (CAR) |
| Province | Abra |
| District | Lone District |
| Barangays | 19 (see Barangays) |
| Government [1] | |
| • Type | Sangguniang Bayan |
| • Mayor | Marco Magala Bautista |
| • Electorate | 6,657 voters (2016) |
| Area [2] | |
| • Total | 64.08 km2 (24.74 sq mi) |
| Population (2015 census)[3] | |
| • Total | 9,867 |
| • Density | 150/km2 (400/sq mi) |
| Time zone | UTC+8 (PST) |
| ZIP code | 2823 |
| PSGC | 140122000 |
| IDD : area code | +63 (0)74 |
| Climate type | Tropical rainforest climate |
| Income class | 5th municipal income class |
| Revenue (₱) | 48,307,619.69 (2016) |
| Native languages |
Itneg language Ilocano Tagalog |
San Juan, officially the Municipality of San Juan, (Ilokano: Ili ti San Juan; Tagalog: Bayan ng San Juan), is a 5th class municipality in the province of Abra, Philippines. According to the 2015 census, it has a population of 9,867 people.[3]
A major tourist attraction is Abualan Cave, but it is not yet developed. The climate is characterized by 2 distinct seasons. The dry season, which occurs from November to April, is marked by daily blue skies and clear starry nights and the wet season for the rest of the year with high rainfall intensities accompanied by storms and typhoons.
Geography
San Juan is located at 17°41′N 120°44′E / 17.68°N 120.73°E.
According to the Philippine Statistics Authority, the municipality has a land area of 64.08 square kilometres (24.74 sq mi) [2] constituting 1.54% of the 4,165.25-square-kilometre- (1,608.21 sq mi) total area of Abra.
Barangays
San Juan is politically subdivided into 19 barangays.[4]
| PSGC | Barangay | Population | ±% p.a. | |||
|---|---|---|---|---|---|---|
| 2015[3] | 2010[5] | |||||
| 140122001 | Abualan | 7.1% | 698 | 885 | −4.42% | |
| 140122002 | Ba-ug | 11.2% | 1,107 | 1,104 | 0.05% | |
| 140122003 | Badas | 3.7% | 363 | 463 | −4.53% | |
| 140122004 | Cabcaborao | 10.3% | 1,021 | 1,032 | −0.20% | |
| 140122005 | Colabaoan | 3.1% | 308 | 295 | 0.82% | |
| 140122006 | Culiong | 4.6% | 455 | 483 | −1.13% | |
| 140122007 | Daoidao | 1.6% | 160 | 152 | 0.98% | |
| 140122008 | Guimba | 3.8% | 371 | 369 | 0.10% | |
| 140122009 | Lam-ag | 5.7% | 558 | 546 | 0.41% | |
| 140122010 | Lumobang | 3.7% | 363 | 363 | 0.00% | |
| 140122011 | Nangobongan | 4.0% | 393 | 393 | 0.00% | |
| 140122012 | Pattaoig | 1.2% | 117 | 122 | −0.79% | |
| 140122013 | Poblacion North | 8.4% | 828 | 980 | −3.16% | |
| 140122014 | Poblacion South | 4.0% | 397 | 542 | −5.76% | |
| 140122015 | Quidaoen | 6.9% | 680 | 679 | 0.03% | |
| 140122016 | Sabangan | 3.2% | 311 | 244 | 4.73% | |
| 140122017 | Silet | 4.6% | 449 | 495 | −1.84% | |
| 140122018 | Supi-il | 6.4% | 628 | 680 | −1.50% | |
| 140122019 | Tagaytay | 6.7% | 660 | 719 | −1.62% | |
| Total | 9,867 | 10,546 | −1.26% | |||
Demographics
| Population census of San Juan | ||
|---|---|---|
| Year | Pop. | ±% p.a. |
| 1903 | 2,192 | — |
| 1939 | 3,842 | +1.57% |
| 1948 | 4,603 | +2.03% |
| 1960 | 5,400 | +1.34% |
| 1970 | 6,833 | +2.38% |
| 1975 | 6,989 | +0.45% |
| 1980 | 7,233 | +0.69% |
| 1990 | 8,445 | +1.56% |
| 1995 | 8,461 | +0.04% |
| 2000 | 8,821 | +0.90% |
| 2007 | 9,714 | +1.34% |
| 2010 | 10,546 | +3.04% |
| 2015 | 9,867 | −1.26% |
| Source: Philippine Statistics Authority[3][5][6][7] | ||
In the 2015 census, San Juan had a population of 9,867.[3] The population density was 150 inhabitants per square kilometre (390/sq mi).
Economy
San Juan is an agricultural town. Its major products are rice, corn and tobacco. The town has two major rivers: the Malanas River and Tineg River. These two rivers supply the townspeople with fish and they are also used to transport bamboo which is sold to resort owners in Vigan.
During the dry season, the townsfolk also plant string beans, eggplant, peanuts, bitter gourds, squashes, okra and tomatoes. Some also cultivate mangoes.
References
- ↑ "Municipality". Quezon City, Philippines: Department of the Interior and Local Government. Retrieved 31 May 2013.
- 1 2 "Province: Abra". PSGC Interactive. Quezon City, Philippines: Philippine Statistics Authority. Retrieved 12 November 2016.
- 1 2 3 4 5 Census of Population (2015). "Cordillera Administrative Region (CAR)". Total Population by Province, City, Municipality and Barangay. PSA. Retrieved 20 June 2016.
- ↑ "Municipal: San Juan, Abra". PSGC Interactive. Quezon City, Philippines: Philippine Statistics Authority. Retrieved 8 January 2016.
- 1 2 Census of Population and Housing (2010). "Cordillera Administrative Region (CAR)". Total Population by Province, City, Municipality and Barangay. NSO. Retrieved 29 June 2016.
- ↑ Censuses of Population (1903–2007). "Cordillera Administrative Region (CAR)". Table 1. Population Enumerated in Various Censuses by Province/Highly Urbanized City: 1903 to 2007. NSO.
- ↑ "Province of Abra". Municipality Population Data. Local Water Utilities Administration Research Division. Retrieved 17 December 2016.
External links
| Wikimedia Commons has media related to San Juan, Abra. |
Places adjacent to San Juan, Abra | ||||||||||
|---|---|---|---|---|---|---|---|---|---|---|
| ||||||||||
Bangued (capital) | |
| Municipalities | |
| Barangays | |