Saint-Mathieu, Quebec
| Saint-Mathieu | |
|---|---|
| Municipality | |
 | |
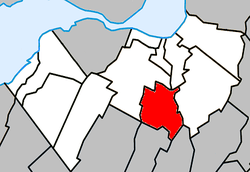 Location within Roussillon RCM | |
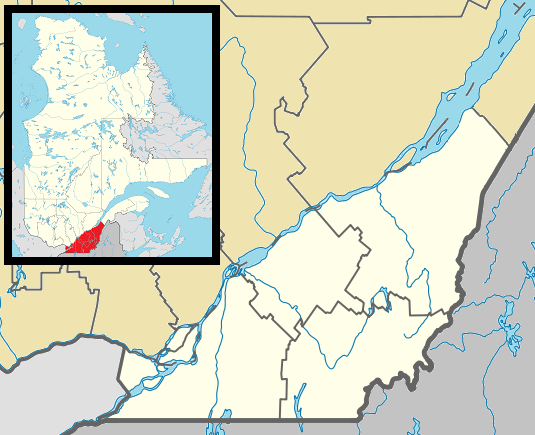 Saint-Mathieu Location in southern Quebec | |
| Coordinates: 45°19′N 73°31′W / 45.32°N 73.52°WCoordinates: 45°19′N 73°31′W / 45.32°N 73.52°W[1] | |
| Country |
|
| Province |
|
| Region | Montérégie |
| RCM | Roussillon |
| Constituted | August 1, 1917 |
| Government[2][3] | |
| • Mayor | Lise Poissant |
| • Federal riding | La Prairie |
| • Prov. riding | Sanguinet |
| Area[2][4] | |
| • Total | 31.50 km2 (12.16 sq mi) |
| • Land | 31.59 km2 (12.20 sq mi) |
|
There is an apparent contradiction between two authoritative sources | |
| Population (2011)[4] | |
| • Total | 1,879 |
| • Density | 59.5/km2 (154/sq mi) |
| • Pop 2006-2011 |
|
| • Dwellings | 783 |
| Time zone | UTC−5 (EST) |
| • Summer (DST) | UTC−4 (EDT) |
| Postal code(s) | J0L 2H0 |
| Area code(s) | 450 and 579 |
| Website |
municipalite |
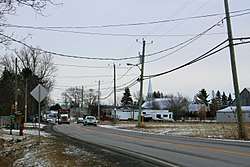
Saint-Mathieu is a municipality situated in the Montérégie administrative region in Quebec, Canada. The population as of the Canada 2011 Census was 1,879. It is part of the Roussillon Regional County Municipality.
Demographics
Population
| Canada census – Saint-Mathieu, Quebec community profile | |||
|---|---|---|---|
| 2011 | 2006 | ||
| Population: | 1,879 (-0.8% from 2006) | 1,894 (-3.4% from 2001) | |
| Land area: | 31.59 km2 (12.20 sq mi) | 31.59 km2 (12.20 sq mi) | |
| Population density: | 59.5/km2 (154/sq mi) | 60.0/km2 (155/sq mi) | |
| Median age: | 42.2 (M: 41.7, F: 42.8) | 41.3 (M: 41.8, F: 41.0) | |
| Total private dwellings: | 783 | 767 | |
| Median household income: | $.N/A | $52,114 | |
| Notes: 2011 income data for this area has been suppressed for data quality or confidentiality reasons. – References: 2011[4] 2006[5] earlier[6] | |||
| Historical Census Data - Saint-Mathieu, Quebec[7] | ||
|---|---|---|
| Year | Pop. | ±% |
| 1991 | 1,753 | — |
| 1996 | 1,925 | +9.8% |
| 2001 | 1,961 | +1.9% |
| 2006 | 1,894 | −3.4% |
| 2011 | 1,879 | −0.8% |
Language
| Canada Census Mother Tongue - Saint-Mathieu, Quebec[7] | ||||||||||||||||||
|---|---|---|---|---|---|---|---|---|---|---|---|---|---|---|---|---|---|---|
| Census | Total | French |
English |
French & English |
Other | |||||||||||||
| Year | Responses | Count | Trend | Pop % | Count | Trend | Pop % | Count | Trend | Pop % | Count | Trend | Pop % | |||||
2011 |
1,875 |
1,720 | 91.73% | 85 | 4.53% | 20 | 1.07% | 50 | 2.67% | |||||||||
2006 |
1,890 |
1,715 | 90.74% | 100 | 5.29% | 25 | 1.32% | 50 | 2.65% | |||||||||
2001 |
1,965 |
1,805 | 91.86% | 125 | 6.36% | 10 | 0.51% | 25 | 1.27% | |||||||||
1996 |
1,940 |
1,790 | n/a | 92.27% | 120 | n/a | 6.19% | 15 | n/a | 0.77% | 15 | n/a | 0.77% | |||||
See also
References
- ↑ Reference number 57213 of the Commission de toponymie du Québec (in French)
- 1 2 Ministère des Affaires municipales, des Régions et de l'Occupation du territoire: Saint-Mathieu
- ↑ Riding history for Beauharnois—Salaberry, Quebec from the Library of Parliament
- 1 2 3 "2011 Community Profiles". Canada 2011 Census. Statistics Canada. July 5, 2013. Retrieved 2014-02-16.
- ↑ "2006 Community Profiles". Canada 2006 Census. Statistics Canada. March 30, 2011. Retrieved 2014-02-16.
- ↑ "2001 Community Profiles". Canada 2001 Census. Statistics Canada. February 17, 2012.
- 1 2 Statistics Canada: 1996, 2001, 2006, 2011 census
| Wikimedia Commons has media related to Saint-Mathieu, Quebec. |
Adjacent Municipal Subdivisions | |
|---|---|
| Cities | |
|---|---|
| Municipalities | |
| Parishes | |
| |
This article is issued from
Wikipedia.
The text is licensed under Creative Commons - Attribution - Sharealike.
Additional terms may apply for the media files.