Liverpool City Council election, 2010
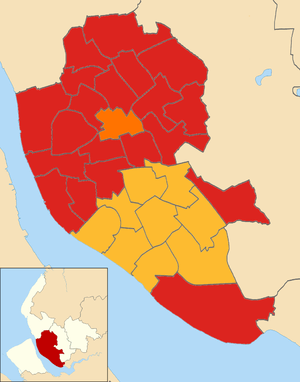
2010 local election results in Liverpool
Elections to Liverpool City Council were held on 6 May 2010. One third of the council was up for election. (30 seats)
As Liverpool Council is elected in thirds, councillors elected in the 2006 elections defend their seats this year, and the vote share changes are compared on that basis.
After the election, the composition of the council was:
| Party | Seats | ± | |
|---|---|---|---|
| Labour | 47 | +8 | |
| Liberal Democrat | 38 | -8 | |
| Liberal | 3 | 0 | |
| Green | 1 | -1 | |
Election result
| Party | Seats | Gains | Losses | Net gain/loss | Seats % | Votes % | Votes | +/− | |
|---|---|---|---|---|---|---|---|---|---|
| Liberal Democrat | 9 | 1 | 9 | -8 | 33.33% | 29.80% | 53,193 | ||
| Labour | 20 | 8 | 0 | +8 | 66.6% | 52.10% | 93,004 | ||
| Liberal | 1 | 0 | 0 | 0 | 3.2% | 5.95% | 10,624 | ||
| Green | 0 | 0 | 1 | -1 | 0% | 4.66% | 8,312 | ||
| Conservative | 0 | 0 | 0 | 0 | 0% | 7.33% | 13,092 | ||
| BNP | 0 | 0 | 0 | 0 | 0% | 1.34% | 2,394 | ||
| Independent | 0 | 0 | 0 | 0 | 0% | 0.13% | 238 | ||
| Socialist Labour | 0 | 0 | 0 | 0 | 0% | 0.21% | 370 | ||
Ward results
Changes in vote share are compared with the corresponding elections in 2006.
* - Retiring Councillor
Allerton and Hunts Cross
| Party | Candidate | Votes | % | ± | |
|---|---|---|---|---|---|
| Liberal Democrat | Vera Best * | 3,148 | 43.95 | -5.7% | |
| Labour | Colin McAlley | 2,750 | 38.3 | +17.3 | |
| Conservative | Adam Marsden | 1,010 | 14.1 | -2.9 | |
| Green | Margaret Williams | 270 | 3.8 | -2.7 | |
| Majority | 398 | ||||
| Registered electors | 11,085 | ||||
| Turnout | 7,178 | 64.75 | +34.8 | ||
| Rejected ballots | 29 | ||||
| Liberal Democrat hold | Swing | ||||
Anfield
| Party | Candidate | Votes | % | ± | |
|---|---|---|---|---|---|
| Labour | Ian Francis | 2,817 | 54.5% | +22.8% | |
| Liberal Democrat | Ann Kendrick | 1,526 | 29.5 | -12.8 | |
| BNP | Karen Otty | 278 | 5.4 | N/A | |
| Liberal | Stephen Houghland | 274 | 5.3 | -11.9 | |
| Conservative | Brenda Copell | 185 | 3.6 | -0.1 | |
| Green | Jean Hill | 88 | 1.7 | -3.4 | |
| Majority | 1,291 | ||||
| Registered electors | 9,531 | ||||
| Turnout | 5,168 | 54.2 | +31.2 | ||
| Rejected ballots | 18 | ||||
| Labour gain from Liberal Democrat | Swing | ||||
Belle Vale
| Party | Candidate | Votes | % | ± | |
|---|---|---|---|---|---|
| Labour | Pauline Walton * | 3,811 | 61.5% | +9.8% | |
| Liberal Democrat | Ian Phillips | 1,963 | 31.7 | -10.6 | |
| Conservative | Stephen Fitxsimmons | 287 | 4.6 | +2.0 | |
| Green | Julie Birch-Holt | 141 | 2.3 | N/A | |
| Majority | 1,848 | ||||
| Registered electors | 10,642 | ||||
| Turnout | 6,202 | 58.3 | +26.3 | ||
| Rejected ballots | 34 | ||||
| Labour hold | Swing | ||||
Central
| Party | Candidate | Votes | % | ± | |
|---|---|---|---|---|---|
| Labour | Nick Small * | 2,084 | 53.2% | -0.1% | |
| Liberal Democrat | Richard Marbrow | 1,107 | 20.3 | -9.0 | |
| Conservative | Thomas Roberts | 410 | 10.5 | +2.9 | |
| Green | Fiona Coyne | 237 | 6.1 | -1.6 | |
| Liberal | John Gannon | 81 | 2.1 | +0.0 | |
| Majority | 977 | 25.0 | +1.0 | ||
| Registered electors | 12,031 | ||||
| Turnout | 3,919 | 32.6 | +20.6 | ||
| Rejected ballots | |||||
| Labour hold | Swing | ||||
Childwall
| Party | Candidate | Votes | % | ± | |
|---|---|---|---|---|---|
| Liberal Democrat | Pat Moloney | 3,162 | 42.3% | -19.6% | |
| Labour | Rosemary Connell | 2,900 | 38.8 | +19.2 | |
| Conservative | Jade Adamowicz | 661 | 8.8 | +0.1 | |
| Liberal | Philip Daley | 537 | 7.2 | +4.6 | |
| Green | Pierre Van Der Vorst | 222 | 3.0 | -4.2 | |
| Majority | 262 | 3.5 | -38.8 | ||
| Registered electors | 11,116 | ||||
| Turnout | 7,482 | 67.3 | +37.3 | ||
| Rejected ballots | 64 | ||||
| Liberal Democrat hold | Swing | ||||
Church
| Party | Candidate | Votes | % | ± | |
|---|---|---|---|---|---|
| Liberal Democrat | Tom Morrison | 3,171 | 45.91% | -14.3% | |
| Labour | Peter Clarke | 2,074 | 30.0 | +16.9 | |
| Conservative | James Barnaby | 702 | 10.2 | +2.6 | |
| Liberal | James MacGregor | 556 | 8.1 | +4.9 | |
| Green | Eleanor Martin | 404 | 5.9 | -2.8 | |
| Independent | Jeffrey Berman | 152 | 2.2 | -5.0 | |
| Majority | 1.097 | 15.9 | +8.7 | ||
| Registered electors | 10,836 | ||||
| Turnout | 7,059 | 65.1 | +30.9 | ||
| Rejected ballots | 49 | ||||
| Liberal Democrat hold | Swing | ||||
Clubmoor
| Party | Candidate | Votes | % | ± | |
|---|---|---|---|---|---|
| Labour | Roz Gladden * | 4,245 | 73.9% | +25.3% | |
| Liberal | David Maher | 1,073 | 18.7 | -8.0 | |
| BNP | Peter Squire | 364 | 6.33 | N/A | |
| Conservative | Victoria MacDonald | 281 | 4.9 | +0.4 | |
| Green | Mark Bacon | 148 | 2.6 | -1.4 | |
| Majority | 4,425 | ||||
| Registered electors | 11,618 | ||||
| Turnout | 6,111 | 52.6 | +27.6 | ||
| Rejected ballots | 20 | ||||
| Labour hold | Swing | ||||
County
| Party | Candidate | Votes | % | ± | |
|---|---|---|---|---|---|
| Labour | Gerard Woodhouse | 3,131 | 63.4% | +22.1% | |
| Liberal Democrat | Ruth Gould | 1,591 | 32.2 | -20.5 | |
| BNP | Peter Stafford | 222 | 4.5 | N/A | |
| Conservative | Angela Oates | 156 | 3.2 | +0.4 | |
| Green | Tony Jones | 61 | 1.2 | N/A | |
| Majority | 1,540 | ||||
| Registered electors | 9,771 | ||||
| Turnout | 5,161 | 52.8 | +28.8 | ||
| Rejected ballots | 19 | ||||
| Labour gain from Liberal Democrat | Swing | ||||
Cressington
| Party | Candidate | Votes | % | ± | |
|---|---|---|---|---|---|
| Liberal Democrat | Richard Oglethorpe * | 3,127 | 44.3% | -8.2% | |
| Labour | Anna Briggs | 2,635 | 37.3 | +15.3 | |
| Conservative | Paul Athans | 952 | 13.5 | +2.7 | |
| Green | Mark Bowman | 294 | 4.2 | -4.1 | |
| Liberal | Michael Williams | 50 | 0.7 | -5.7 | |
| Majority | 492 | ||||
| Registered electors | 11,240 | ||||
| Turnout | 7,058 | 62.8 | +31.8 | ||
| Rejected ballots | 37 | ||||
| Liberal Democrat hold | Swing | ||||
Croxteth
| Party | Candidate | Votes | % | ± | |
|---|---|---|---|---|---|
| Labour | Peter Mitchell | 3,307 | 59.6% | +1.9 | |
| Liberal Democrat | Mark Coughlin | 1,711 | 30.8 | +0.1 | |
| Conservative | Grace Tyldsley | 271 | 4.9 | -0.2 | |
| Socialist Labour | Kai Anderson | 244 | 4.4 | N/A | |
| Liberal | Michael Morgan | 181 | 3.3 | +0.7 | |
| Green | Don Ross | 78 | 1.4 | -3.7 | |
| Majority | 1,596 | ||||
| Registered electors | 10,604 | ||||
| Turnout | 5,792 | 54.6 | +26.6 | ||
| Rejected ballots | 73 | ||||
| Labour hold | Swing | ||||
Everton
| Party | Candidate | Votes | % | ± | |
|---|---|---|---|---|---|
| Labour | John McIntosh * | 3,623 | 79.3% | +10.5% | |
| Liberal | Linda Roberts | 532 | 11.7 | +6.4 | |
| BNP | Jackie Stafford | 281 | 6.15 | N/A | |
| Conservative | James Rogers | 278 | 11.7 | +5.4 | |
| Green | Raphael Levy | 134 | 2.9 | -3.3 | |
| Majority | 3,623 | 66.7 | +11.3 | ||
| Registered electors | 9,908 | ||||
| Turnout | 4,848 | 48.93 | +28.9 | ||
| Rejected ballots | 23 | ||||
| Labour hold | Swing | ||||
Fazakerley
| Party | Candidate | Votes | % | ± | |
|---|---|---|---|---|---|
| Labour | Dave Hanratty * | 4,250 | 68.0% | -19.9% | |
| Liberal Democrat | Graham Seddon | 1,415 | 22.6 | -21.6 | |
| Conservative | Paul Barber | 324 | 5.2 | +1.5 | |
| BNP | Peter Stafford | 292 | 4.7 | N/A | |
| Liberal | Irene Mayes | 187 | 3.0 | -1.0 | |
| Green | Edward Gommon | 75 | 1.2 | N/A | |
| Majority | 2,835 | 45.4 | |||
| Registered electors | 11,363 | ||||
| Turnout | 6,534 | 57.6 | +31.6 | ||
| Rejected ballots | 30 | ||||
| Labour hold | Swing | ||||
Greenbank
| Party | Candidate | Votes | % | ± | |
|---|---|---|---|---|---|
| Liberal Democrat | Elaine Allen | 2,530 | 41.8% | +1.0% | |
| Labour | Laura Robertson-Collins | 2,039 | 33.7 | +8.7 | |
| Green | Peter Cranie | 800 | 13.2 | -6.1 | |
| Conservative | Christopher Hall | 562 | 9.3 | -0.5 | |
| Liberal | Terence Formby | 119 | 2.0 | -3.2 | |
| Majority | 491 | 8.1 | -7.7 | ||
| Registered electors | 10,728 | ||||
| Turnout | 6,050 | 56.4 | +33.4 | ||
| Rejected ballots | 22 | ||||
| Liberal Democrat hold | Swing | ||||
Kensington & Fairfield
| Party | Candidate | Votes | % | ± | |
|---|---|---|---|---|---|
| Labour | Louise Baldock * | 2,949 | 62.1% | +17.1% | |
| Liberal Democrat | Frank Doran | 1,379 | 29.0% | -9.2% | |
| Green | Michael Ryan | 179 | 3.8% | -2.3% | |
| Conservative | Ann Nugent | 139 | 2.9% | -0.6% | |
| Liberal | Shelly Harrison | 107 | 2.3% | -4.9% | |
| Majority | 1,570 | 33.0% | +26.2% | ||
| Registered electors | 8,891 | ||||
| Turnout | 4,753 | 53.5% | +29.5% | ||
| Rejected ballots | 15 | ||||
| Labour hold | Swing | ||||
Kirkdale
| Party | Candidate | Votes | % | ± | |
|---|---|---|---|---|---|
| Labour | Malcolm Kennedy | 4,284 | 85.7% | +7.5% | |
| BNP | Steven Greenhalgh | 403 | 8.1% | N/A | |
| Liberal | George Roberts | 336 | 6.7% | N/A | |
| Conservative | Nigel Barber | 246 | 4.9% | +2.1% | |
| Green | Jonathan Clatworthy | 133 | 2.7% | +0.1% | |
| Independent | Will Thomson | 86 | 1.7% | N/A | |
| Majority | 4,284 | ||||
| Registered electors | 11,358 | ||||
| Turnout | 5,488 | 48.3% | |||
| Rejected ballots | 35 | ||||
| Labour hold | Swing | ||||
Knotty Ash
| Party | Candidate | Votes | % | ± | |
|---|---|---|---|---|---|
| Labour | Jacqui Nasuh | 3,044 | 51.4% | +10.7% | |
| Liberal Democrat | Elizabeth Parr | 2,303 | 38.9% | -5.2% | |
| Liberal | Patricia Elmour | 247 | 4.2% | -4.1% | |
| Conservative | June Brandwood | 203 | 3.4% | -3.5% | |
| Green | Eveline Van der Steen | 124 | 2.1% | N/A | |
| Majority | 741 | ||||
| Registered electors | 9,903 | ||||
| Turnout | 5,921 | 59.8% | +31.8% | ||
| Rejected ballots | 16 | ||||
| Labour gain from Liberal Democrat | Swing | ||||
Mossley Hill
| Party | Candidate | Votes | % | ± | |
|---|---|---|---|---|---|
| Liberal Democrat | Tina Gould * | 3,171 | 46.7% | -8.8% | |
| Labour | Christopher Helm | 2,351 | 33.9% | +15.9% | |
| Conservative | Giselle McDonald | 909 | 13.1% | +2.0% | |
| Green | Robert Smith | 418 | 6.02% | -4.7% | |
| Liberal | David Wood | 97 | 1.4% | -3.3% | |
| Majority | 820 | ||||
| Registered electors | 10,668 | ||||
| Turnout | 6,946 | 65.1% | +33.1% | ||
| Rejected ballots | 35 | ||||
| Liberal Democrat hold | Swing | ||||
Norris Green
| Party | Candidate | Votes | % | ± | |
|---|---|---|---|---|---|
| Labour | Vi Bebb * | 3,948 | 80.6% | +21.4% | |
| Liberal | Charles Mayes | 550 | 11.2% | +7.0% | |
| BNP | John Edgar | 312 | 6.4% | -11.4% | |
| Conservative | George Powell | 308 | 6.3% | +0.01% | |
| Green | Elspeth Anwar | 93 | 1.9% | +2.2% | |
| Socialist Labour | Kim Singleton | 40 | 0.8% | N/A | |
| Majority | 3,948 | ||||
| Registered electors | 10,224 | ||||
| Turnout | 5,251 | 51.4% | +30.4% | ||
| Rejected ballots | 24 | ||||
| Labour hold | Swing | ||||
Old Swan
| Party | Candidate | Votes | % | ± | |
|---|---|---|---|---|---|
| Labour | Joanne Anderson | 3,557 | 55.4% | +26.4% | |
| Liberal Democrat | Keith Turner | 2,341 | 36.5% | -11.9% | |
| BNP | Steven McEllenborough | 242 | 3.78% | N/A | |
| Conservative | Gwynneth Hicklin | 231 | 3.6% | -1.4% | |
| Green | Vikki Gregorich | 194 | 3.0% | -1.5% | |
| Liberal | Elaine Tyrer | 100 | 1.6% | -4.2% | |
| Majority | 1,216 | ||||
| Registered electors | 11,283 | ||||
| Turnout | 6,423 | 56.9% | +32.9% | ||
| Rejected ballots | 48 | ||||
| Labour gain from Liberal Democrat | Swing | ||||
Picton
| Party | Candidate | Votes | % | ± | |
|---|---|---|---|---|---|
| Labour | Timothy Beaumont | 2,937 | 54.4% | +19.6% | |
| Liberal Democrat | Laurence Sidorczuk * | 1,786 | 33.1% | -16.6% | |
| Green | Ian Harvey | 198 | 3.7% | -3.4% | |
| Liberal | Griffith Parry | 251 | 4.7% | -3.9% | |
| Conservative | Pauline Shuttleworth | 225 | 4.2% | N/A | |
| Majority | 1,151 | ||||
| Registered electors | 10,832 | ||||
| Turnout | 5,397 | 49.8% | +28.8% | ||
| Rejected ballots | 35 | ||||
| Labour gain from Liberal Democrat | Swing | ||||
Princes Park
| Party | Candidate | Votes | % | ± | |
|---|---|---|---|---|---|
| Labour | Anna Rothery | 2,740 | 53.4% | +8.9% | |
| Liberal Democrat | Mumin Khan | 1,293 | 25.2 | +1.0 | |
| Green | Abdullahi Mahmoud | 634 | 12.4 | -4.5 | |
| Conservative | Dianne Watson | 294 | 5.8 | +2.2 | |
| Liberal | Thomas Peel | 166 | 3.2 | -4.5 | |
| Majority | 1,447 | ||||
| Registered electors | 10,008 | ||||
| Turnout | 5,127 | 51.2% | +27.2% | ||
| Rejected ballots | 48 | ||||
| Labour hold | Swing | ||||
Riverside
| Party | Candidate | Votes | % | ± | |
|---|---|---|---|---|---|
| Labour | Joe Anderson * | 3,978 | 67.5% | +1.5% | |
| Liberal Democrat | Reg Standish | 1,022 | 17.3% | +6.0% | |
| Conservative | Alma McGing | 420 | 7.1% | -1.6% | |
| Green | Lewis Coyne | 281 | 4.8% | ||
| Liberal | Maria Langley | 193 | 3.27% | -2.8% | |
| Majority | 2,956 | ||||
| Registered electors | 11,598 | ||||
| Turnout | 5,896 | 50.8% | +23.3 | ||
| Rejected ballots | 25 | ||||
| Labour hold | Swing | ||||
St. Michael's
| Party | Candidate | Votes | % | ± | |
|---|---|---|---|---|---|
| Liberal Democrat | Sharon Green | 2,002 | 34.0% | -7.5% | |
| Green | Tom Crone | 1,790 | 30.4% | +5.2% | |
| Labour | Matthew Garlick | 1,710 | 29.0% | +4.0% | |
| Conservative | David Patmore | 394 | 6.7% | -1.7% | |
| Majority | 292 | ||||
| Registered electors | 10,054 | ||||
| Turnout | 5,896 | 58.6% | +32.6% | ||
| Rejected ballots | 39 | ||||
| Liberal Democrat hold | Swing | ||||
Speke-Garston
| Party | Candidate | Votes | % | ± | |
|---|---|---|---|---|---|
| Labour | Doreen Knight * | 4,847 | 80.6% | +21.3% | |
| Liberal Democrat | Rachel Oelbaum | 432 | 7.2% | -24.3% | |
| Conservative | Norman Coppell | 386 | 6.42% | +3.4% | |
| Liberal | John Pagan | 141 | 2.3% | +0.0% | |
| Green | Helen McAlister | 209 | 3.5% | -0.4% | |
| Majority | 4,415 | ||||
| Registered electors | 12,683 | ||||
| Turnout | 6,015 | 47.4% | +20.4% | ||
| Rejected ballots | 66 | ||||
| Labour hold | Swing | ||||
Tuebrook & Stoneycroft
| Party | Candidate | Votes | % | ± | |
|---|---|---|---|---|---|
| Liberal | Chris Lenton * | 3,523 | 59.3% | -1.3% | |
| Labour | Dan Barrington | 2,041 | 34.3% | +10.3% | |
| Green | Natalie Clark | 190 | 3.2% | N/A | |
| Conservative | Prashant Singh | 190 | 3.2% | -0.5% | |
| Majority | 1,482 | ||||
| Registered electors | 10,474 | ||||
| Turnout | 5,944 | 56.8% | +34.8% | ||
| Rejected ballots | 18 | ||||
| Liberal hold | Swing | ||||
Warbreck
| Party | Candidate | Votes | % | ± | |
|---|---|---|---|---|---|
| Labour | Maria McEvoy | 3,761 | 58.7% | +14.4% | |
| Liberal Democrat | Richard Roberts | 2,238 | 34.9% | -10.3% | |
| Conservative | David Jeffrey | 248 | 3.9% | -0.5% | |
| Green | Eleanor Pontin | 161 | 2.5% | N/A | |
| Majority | 1.523 | ||||
| Registered electors | 11,278 | ||||
| Turnout | 6,408 | 56.8% | +29.8% | ||
| Rejected ballots | 46 | ||||
| Labour gain from Liberal Democrat | Swing | ||||
Wavertree
| Party | Candidate | Votes | % | ± | |
|---|---|---|---|---|---|
| Liberal Democrat | Rosie Jolly | 3,118 | 46.9% | -17.6% | |
| Labour | Tony Murphy | 2,454 | 36.9% | +18.4% | |
| Green | Elizabeth Pascoe | 350 | 5.3% | -3.4% | |
| Conservative | Christopher Clinton | 338 | 5.1% | +0.4% | |
| Liberal | Mary Jane Canning | 383 | 5.8% | +2.2% | |
| Majority | 664 | ||||
| Registered electors | 10,452 | ||||
| Turnout | 6,643 | 63.6% | +35.6% | ||
| Rejected ballots | 4 | ||||
| Liberal Democrat hold | Swing | ||||
West Derby
| Party | Candidate | Votes | % | ± | |
|---|---|---|---|---|---|
| Labour | Pam Thomas | 3,391 | 48.1% | +25.3% | |
| Liberal Democrat | Stuart Monkcom * | 2,326 | 33.0% | -16.5% | |
| Liberal | Ann Hines | 674 | 9.6% | +1.8% | |
| Conservative | Andrew Desborough | 567 | 8.0% | -2.8% | |
| Green | Martin Randall | 91 | 1.3% | -5.8% | |
| Majority | 1,065 | 15.1% | |||
| Registered electors | 10,960 | ||||
| Turnout | 7,049 | 64.3% | +39.3% | ||
| Rejected ballots | 10 | ||||
| Labour gain from Liberal Democrat | Swing | ||||
Woolton
| Party | Candidate | Votes | % | ± | |
|---|---|---|---|---|---|
| Liberal Democrat | Malcolm Kelly * | 3,543 | 50.6% | -5.7% | |
| Labour | John Fulham | 1,728 | 24.8% | +11.6 | |
| Conservative | Richard Downey | 1,500 | 21.5% | -0.1% | |
| Green | Alexander Rudkin | 197 | 2.8% | -2.6% | |
| Majority | 1.815 | 26.05% | |||
| Registered electors | 10,467 | ||||
| Turnout | 6,968 | 66.6% | +33.3% | ||
| Rejected ballots | 26 | ||||
| Liberal Democrat hold | Swing | ||||
Yew Tree
| Party | Candidate | Votes | % | ± | |
|---|---|---|---|---|---|
| Labour | Tony Conception | 3,618 | 58.3% | +16.4% | |
| Liberal Democrat | Gary Airey | 1,788 | 28.8% | -13.6% | |
| Conservative | Matthew Taylor | 415 | 6.7% | -1.2% | |
| Liberal | Tracey Hawksford | 266 | 4.3% | -3.4% | |
| Green | Will Ward | 118 | 1.9% | N/A | |
| Socialist Labour | Barbara Bryan | 131 | 2.1% | N/A | |
| Majority | 1,830 | 29.5% | |||
| Registered electors | 11,344 | ||||
| Turnout | |||||
| Rejected ballots | 36 | ||||
| Labour gain from Liberal Democrat | Swing | ||||
By-elections
Croxteth, 18 November 2010
Caused by the death of Councillor Rose Bailey (Labour, elected 1 May 2008) and the resignation of Councillor Phil Moffat (Liberal Democrat, elected 3 May 2007).
| Party | Candidate | Votes | % | ± | |
|---|---|---|---|---|---|
| Labour | Martin Cummins | 1,447 | 32% | ||
| Labour | Stephanie Till | 1,424 | 31% | ||
| Liberal Democrat | Mark Coughlin | 611 | 13% | ||
| Liberal Democrat | Michael John Marner | 479 | 11% | ||
| Socialist Labour | Kai Anderson | 135 | 3% | ||
| BNP | Peter Tierney | 117 | 2.6% | ||
| Socialist Labour | Barbara Bryan | 70 | 1.6% | ||
| Green | Green Party | 63 | 1.4% | ||
| UKIP | Tony Stop-Mass-Immigration Hammond | 50 | 1.1% | ||
| English Democrat | Paul Duane Rimmer | 35 | 0.77% | ||
| English Democrat | Steven McEllenborough | 33 | 0.73% | ||
| Conservative | Norman Coppell | 31 | 0.68% | ||
| Conservative | Brenda Coppell | 29 | 0.64% | ||
| UKIP | Michael John Lane | 19 | 0.42% | ||
| Majority | 836 | ||||
| Registered electors | 10,604 | ||||
| Turnout | 2,489 | 23% | |||
| Rejected ballots | 16 | ||||
| Labour hold | Swing | ||||
| Labour gain from Liberal Democrat | Swing | ||||
References
- ↑ Liverpool Daily Post 7 May 2010
- ↑ "Municipal Elections - Thursday, 6th May, 2010". Liverpool City Council. Retrieved 13 April 2017.
- ↑ "Croxteth By Election 18 November 2010". Liverpool City Council. Retrieved 13 April 2017.
This article is issued from
Wikipedia.
The text is licensed under Creative Commons - Attribution - Sharealike.
Additional terms may apply for the media files.