List of U.S. cities with large African-American populations
This is a list of the United States cities over 100,000 people that have populations that are more than 30% Black or African American.[note 1] Statistics include Black people regardless of nationality.
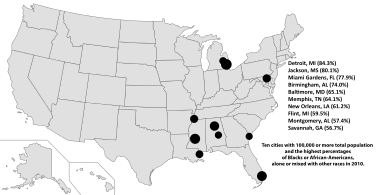
Cities with the highest percentage of Blacks or African Americans in 2010.
There are 19 American cities with populations over 100,000 that have majority (over 50%) Black or African-American populations. These cities are located in the following 13 states: Alabama, Florida, Georgia, Indiana, Louisiana, Maryland, Michigan, Mississippi, New Jersey, Ohio, Tennessee, Texas, and Virginia, as well as Washington, D.C.
Cities with the highest percentage of Black or African-Americans
| City | Total population | Black or African American, alone or with other races | Black or African American, alone | Mixed-race Black/African-American | |||
|---|---|---|---|---|---|---|---|
| Rank | Percentage of total population | Rank | Percentage of total population |
Rank | Percentage of total population | ||
| Detroit, Michigan | 713,777 | 1 | 84.3 | 1 | 82.7 | 83 | 1.6 |
| Jackson, Mississippi | 173,514 | 2 | 80.1 | 2 | 79.4 | 242 | 0.7 |
| Miami Gardens, Florida | 107,167 | 3 | 77.9 | 3 | 76.3 | 91 | 1.6 |
| Birmingham, Alabama | 212,237 | 4 | 74.0 | 4 | 73.4 | 257 | 0.6 |
| Baltimore, Maryland | 620,961 | 5 | 65.1 | 5 | 63.7 | 134 | 1.3 |
| Memphis, Tennessee | 646,889 | 6 | 64.1 | 6 | 63.3 | 225 | 0.8 |
| New Orleans, Louisiana | 343,831 | 7 | 61.2 | 7 | 60.2 | 184 | 1.0 |
| Flint, Michigan | 102,434 | 8 | 59.5 | 9 | 56.6 | 9 | 2.9 |
| Montgomery, Alabama | 205,764 | 9 | 57.4 | 8 | 56.6 | 231 | 0.8 |
| Savannah, Georgia | 136,286 | 10 | 56.7 | 10 | 55.4 | 139 | 1.3 |
| City | Total population |
Black or African American, alone or mixed with other races | Black or African American, alone | Mixed-race Black/African-American | |||
|---|---|---|---|---|---|---|---|
| Rank | Percent of total population |
Rank | Percent of total population |
Rank | Percent of total population | ||
| Lansing, Michigan | 114,297 | 45 | 27.8 | 78 | 23.7 | 1 | 4.1 |
| Tacoma, Washington | 198,397 | 132 | 15.0 | 145 | 11.2 | 2 | 3.8 |
| Killeen, Texas | 127,921 | 40 | 37.9 | 46 | 34.1 | 3 | 3.8 |
| Syracuse, New York | 145,170 | 51 | 33.1 | 57 | 29.5 | 4 | 3.6 |
| Providence, Rhode Island | 178,042 | 109 | 19.4 | 114 | 16.0 | 5 | 3.3 |
| Fairfield, California | 105,321 | 111 | 19.0 | 118 | 15.7 | 6 | 3.3 |
| Rochester, New York | 210,565 | 29 | 44.9 | 33 | 41.7 | 7 | 3.2 |
| Fayetteville, North Carolina | 200,564 | 31 | 44.8 | 32 | 41.9 | 8 | 2.9 |
| Vallejo, California | 115,942 | 81 | 24.9 | 83 | 22.1 | 10 | 2.9 |
Cities with the highest number of Black or African American people
| City | Total population |
Black or African American, alone or mixed with other races |
Black or African American, alone |
Mixed-race Black/African-American | |||
|---|---|---|---|---|---|---|---|
| Rank | Number | Rank | Number | Rank | Number | ||
| New York, NY | 8,175,133 | 1 | 2,228,145 | 1 | 2,088,510 | 1 | 139,635 |
| Chicago, IL | 2,695,598 | 2 | 913,009 | 2 | 887,608 | 3 | 25,401 |
| Philadelphia, PA | 1,526,006 | 3 | 686,870 | 3 | 661,839 | 4 | 25,031 |
| Detroit, MI | 713,777 | 4 | 601,988 | 4 | 590,226 | 13 | 11,762 |
| Houston, TX | 2,099,451 | 5 | 594,217 | 5 | 498,466 | 8 | 11,751 |
| Memphis, TN | 646,889 | 6 | 414,928 | 6 | 409,687 | 58 | 5,241 |
| Baltimore, MD | 620,961 | 7 | 403,998 | 7 | 395,781 | 29 | 8,217 |
| Los Angeles, CA | 3,792,621 | 8 | 402,448 | 8 | 365,118 | 2 | 37,330 |
| Washington, DC | 601,723 | 9 | 314,352 | 9 | 305,125 | 22 | 9,227 |
| Dallas, TX | 1,197,816 | 10 | 308,087 | 10 | 298,993 | 23 | 9,094 |
Select cities with a large percentage of Black or African American people
The following data was sourced from the 2010 U.S. Census.
| Rank | City | Percentage Black or African American | Total Black or African American |
|---|---|---|---|
| 1 | Detroit, MI | 82.7 | 590,226 |
| 2 | Jackson, MS | 79.4 | 137,716 |
| 3 | Chester, PA | 77.8 | 26,429 |
| 4 | Miami Gardens, FL | 76.3 | 81,776 |
| 5 | Orangeburg, SC | 75.04 | 13,964 |
| 6 | Birmingham, AL | 73.4 | 155,791 |
| 7 | Albany, GA | 71.6 | 55,442 |
| 8 | Macon, GA | 67.9 | 91,351 |
| 9 | Baltimore, MD | 63.7 | 395,781 |
| 10 | Memphis, TN | 63.3 | 409,687 |
| 11 | New Orleans, LA | 60.2 | 206,871 |
| 12 | Baton Rouge, LA | 58.5 | 126,250 |
| 12 | Wilmington, DE | 58 | 41,326 |
| 13 | Flint, MI | 56.6 | 57,939 |
| 14 | Savannah, GA | 55.4 | 75,507 |
| 15 | Augusta, GA | 54.7 | 107,182 |
| 16 | Shreveport, LA | 54.7 | 109,022 |
| 17 | Montgomery, AL | 54.5 | 116,524 |
| 18 | Atlanta, GA | 54.0 | 226,894 |
| 19 | Cleveland, OH | 53.3 | 211,672 |
| 20 | Portsmouth, VA | 53.3 | 50,878 |
| 21 | Harrisburg, PA | 52.4 | 25,957 |
| 22 | Newark, NJ | 52.4 | 145,085 |
| 23 | Valdosta, GA | 51.1 | 27,860 |
| 24 | Washington, D.C. | 50.7 | 305,125 |
| 25 | Richmond, VA | 50.6 | 103,342 |
| 26 | Mobile, AL | 50.6 | 98,691 |
| 27 | St. Louis, MO | 49.2 | 157,160 |
| 28 | Danville, VA | 48.3 | 43,055 |
| 29 | Beaumont, TX | 47.3 | 55,931 |
| 30 | North Charleston, SC | 47.2 | 45,964 |
| 31 | Jackson, TN | 45.7 | 29,802 |
| 32 | Columbus, GA | 45.5 | 86,398 |
| 33 | Cincinnati, OH[3] | 45.0 | 123,157 |
| 34 | Saginaw, MI | 44.9 | 23,127 |
| 35 | Inglewood, CA | 43.9 | 48,164 |
| 36 | Philadelphia, PA | 43.4 | 661,839 |
| 37 | Norfolk, VA | 43.1 | 104,672 |
| 38 | Dayton, OH | 42.9 | 60,705 |
| 39 | Suffolk, VA | 42.7 | 36,120 |
| 40 | Little Rock, AR | 42.3 | 81,889 |
| 41 | Columbia, SC | 42.2 | 54,537 |
| 42 | Fayetteville, NC | 41.9 | 82,235 |
| 43 | Rochester, NY | 41.7 | 87,897 |
| 44 | Durham, NC | 41.0 | 93,517 |
| 45 | Fort Pierce, FL | 40.9 | 17,617 |
| 46 | Newport News, VA | 40.7 | 73,514 |
| 47 | Greensboro, NC | 40.6 | 109,586 |
| 48 | Milwaukee, WI | 40.0 | 237,769 |
| 49 | Hartford, CT | 38.7 | 48,331 |
| 50 | Buffalo, NY | 38.6 | 100,774 |
| 51 | Penn Hills, PA | 37.1 | 15,688 |
| 52 | McKeesport, PA | 36.5 | 7,201 |
| 53 | Bronx, NY[4] | 36.5 | 505,200 |
| 54 | New Haven, CT | 35.4 | 45,938 |
| 55 | Tallahassee, FL | 35.0 | 63,475 |
| 56 | Charlotte, NC | 35.0 | 256,241 |
| 57 | Chattanooga, TN | 34.9 | 58,507 |
| 58 | Winston-Salem, NC | 34.7 | 79,598 |
| 59 | Brooklyn, NY[4] | 34.3 | 860,083 |
| 60 | High Point, NC | 33.0 | 34,532 |
| 61 | Chicago, IL | 32.9 | 887,608 |
| 62 | Compton, CA | 32.9 | 31,688 |
| 63 | Cheltenham, PA | 32.8 | 12,097 |
| 64 | Hopkinsville, KY | 31.9 | 10,273 |
| 65 | Paterson, NJ | 31.7 | 46,314 |
| 66 | Akron, OH | 31.5 | 62,321 |
| 67 | Greenville, SC | 31.5 | 18,422 |
| 68 | Huntsville, AL | 31.2 | 56,229 |
| 69 | Brockton, MA | 31.2 | 30,147 |
| 70 | Jacksonville, FL | 30.7 | 252,421 |
| 71 | Kansas City, MO | 29.9 | 137,540 |
| 72 | Raleigh, NC | 29.3 | 117,160 |
| 73 | Lafayette, LA | 28.51 | 34,654 |
| 74 | Orlando, FL | 28.1 | 66,876 |
| 75 | Columbus, OH | 28.0 | 220,241 |
| 76 | Oakland, CA | 28.0 | 109,471 |
| 77 | Nashville, TN | 27.7 | 181,387 |
| 78 | Hawthorne, CA | 27.7 | 23,385 |
| 79 | Upper Darby, PA | 27.5 | 22,769 |
| 80 | Indianapolis, IN | 27.2 | 226,671 |
| 81 | Toledo, OH | 27.2 | 69,243 |
| 82 | Kansas City, KS | 26.8 | 39,080 |
| 83 | Richmond, CA | 26.6 | 27,542 |
| 84 | South Bend, IN | 26.6 | 26,906 |
| 85 | Tampa, FL | 26.2 | 87,872 |
| 86 | Pittsburgh, PA | 26.1 | 79,710 |
| 87 | Charleston, SC | 25.4 | 30,496 |
| 88 | Dallas, TX | 25.0 | 298,993 |
| 89 | Boston, MA | 24.4 | 150,437 |
| 90 | Houston, TX | 23.6 | 498,466 |
| 91 | Springfield, MA | 22.3 | 34,073 |
| 92 | Louisville, KY | 22.2 | 136,611 |
| 93 | Queens, NY[4] | 20.1 | 446,098 |
| 94 | North Las Vegas, NV | 19.9 | 47,502 |
| 95 | Virginia Beach, VA | 19.6 | 85,935 |
| 96 | Minneapolis, MN | 18.6 | 71,160 |
| 97 | Erie, PA | 16.8 | 17,141 |
| 98 | Victorville, CA | 16.8 | 19,483 |
| 99 | Port St. Lucie, FL | 16.3 | 27,876 |
| 100 | Aurora, CO | 15.7 | 51,196 |
| 101 | Manhattan, NY[4] | 15.6 | 246,687 |
| 102 | Waterloo, IA | 15.5 | 10,602 |
| 103 | Oklahoma City, OK | 15.1 | 87,354 |
| 104 | San Bernardino, CA | 15.0 | 31,582 |
| 105 | Sacramento, CA | 14.6 | 68,335 |
| 106 | Lexington, KY | 14.5 | 46,110 |
| 107 | Bowling Green, KY | 13.9 | 9,067 |
| 108 | Omaha, NE | 13.7 | 56,027 |
| 109 | Wichita, KS | 11.5 | 43,972 |
| 110 | Des Moines, IA | 10.2 | 20,750 |
See also
Notes and references
- Notes
- ↑ The United States Census Bureau defines Archived 2014-03-27 at the Wayback Machine. a "Black or African American" as "[a] person having origins in any of the Black racial groups of Africa. It includes people who indicate their race as 'Black, African Am., or Negro'; or report entries such as African American, Kenyan, Nigerian, or Haitian."
- References
- 1 2 The Black Population: 2010 (PDF) (Report). U.S. Census Bureau. Table 7.
- ↑ The Black Population: 2010 (PDF) (Report). U.S. Census Bureau. Table 6.
- ↑ 2010 census figures for Saginaw Archived 2011-05-20 at the Wayback Machine.
- 1 2 3 4 Brooklyn, The Bronx, and Queens are not cities, but rather boroughs of New York City.
This article is issued from
Wikipedia.
The text is licensed under Creative Commons - Attribution - Sharealike.
Additional terms may apply for the media files.