Global warming
Global warming is the observed century-scale rise in the average temperature of the Earth's climate system and its related effects,[2] as part of climate change. Multiple lines of scientific evidence show that the climate system is warming.[3][4][5] Many of the observed changes since the 1950s are unprecedented in the instrumental temperature record, and in paleoclimate proxy records of climate change over thousands to millions of years.[6] The terms Global warming and climate change are often used interchangeably; a 2008 NASA article defines global warming as "the increase in Earth's average surface temperature due to rising levels of greenhouse gases", and climate change as "a long-term change in the Earth's climate, or of a region on Earth".[7]
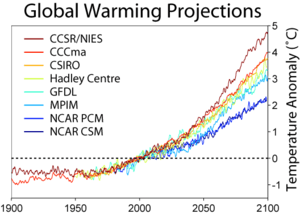
In 2013, the Intergovernmental Panel on Climate Change (IPCC) Fifth Assessment Report concluded, "It is extremely likely that human influence has been the dominant cause of the observed warming since the mid-20th century."[8] The largest human influence has been the emission of greenhouse gases such as carbon dioxide, methane, and nitrous oxide. In view of the dominant role of human activity in causing it, the phenomenon is sometimes called "anthropogenic global warming" or "anthropogenic climate change". Climate model projections summarized in the report indicated that during the 21st century, the global surface temperature is likely to rise a further 0.3 to 1.7 °C (0.5 to 3.1 °F) to 2.6 to 4.8 °C (4.7 to 8.6 °F) depending on the rate of greenhouse gas emissions.[9] These findings have been recognized by the national science academies of the major industrialized nations[10][lower-alpha 1] and are not disputed by any scientific body of national or international standing.[12][13]
Future climate change and associated impacts will differ from region to region.[14][15] Anticipated effects include rising sea levels, changing precipitation, and expansion of deserts in the subtropics.[16] Warming is expected to be greater over land than over the oceans and greatest in the Arctic, with the continuing retreat of glaciers, permafrost, and sea ice. Other likely changes include more frequent extreme weather events such as heat waves, droughts, wildfires, heavy rainfall with floods, and heavy snowfall;[17] ocean acidification; and species extinctions due to shifting temperature regimes. Effects significant to humans include the threat to food security from decreasing crop yields and the abandonment of populated areas due to rising sea levels.[18][19] Because the climate system has a large "inertia" and greenhouse gases will remain in the atmosphere for a long time, many of these effects will persist for not only decades or centuries, but tens of thousands of years.[20]
Possible societal responses to global warming include mitigation by emissions reduction, adaptation to its effects, building systems resilient to its effects, and possible future climate engineering. Most countries are parties to the United Nations Framework Convention on Climate Change (UNFCCC),[21] whose ultimate objective is to prevent dangerous anthropogenic climate change.[22] Parties to the UNFCCC have agreed that deep cuts in emissions are required[23] and that global warming should be limited to well below 2.0 °C (3.6 °F) compared to pre-industrial levels,[lower-alpha 2] with efforts made to limit warming to 1.5 °C (2.7 °F).[25] Some scientists call into question climate adaptation feasibility, with higher emissions scenarios,[26] or the two degree temperature target.[27]
Public reactions to global warming and concern about its effects are also increasing. A global 2015 Pew Research Center report showed that a median of 54% of all respondents asked consider it "a very serious problem". Significant regional differences exist, with Americans and Chinese (whose economies are responsible for the greatest annual CO2 emissions) among the least concerned.[28]
Observed temperature changes
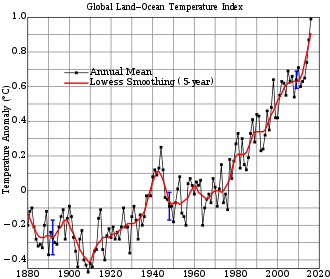
Multiple independently produced datasets confirm that from 1880 to 2012 the global average (land and ocean) surface temperature increased by 0.85 [0.65 to 1.06] °C.[29] From 1906 to 2005, Earth's average surface temperature rose by 0.74±0.18 °C. The rate of warming almost doubled in the last half of that period (0.13±0.03 °C per decade, against 0.07±0.02 °C per decade).[30] Although the popular press often reports the increase of the average near-surface atmospheric temperature as the measure of global warming, most of the additional energy stored in the climate system since 1970 has accumulated in the oceans. The rest has melted ice and warmed the continents and the atmosphere.[31][lower-alpha 3]
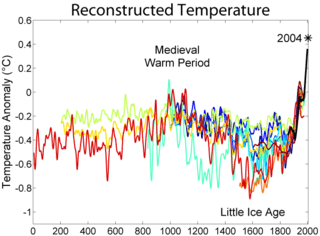
Since 1979, the average temperature of the lower troposphere has increased between 0.12 and 0.135 °C (0.216 and 0.243 °F) per decade, satellite temperature measurements confirm.[32][33] Climate proxies show the temperature to have been relatively stable over the one or two thousand years before 1850, with regionally varying fluctuations such as the Medieval Warm Period and the Little Ice Age.[34]
The warming evident in the instrumental temperature record is consistent with a wide range of observations, as documented by many independent scientific groups.[35] Examples include sea level rise,[36] widespread melting of snow and land ice,[37] increased heat content of the oceans,[35] increased humidity,[35] and the earlier timing of spring events,[38] e.g., the flowering of plants.[39] The probability that these changes could have occurred by chance is virtually zero.[35]
Regional trends and short-term fluctuations
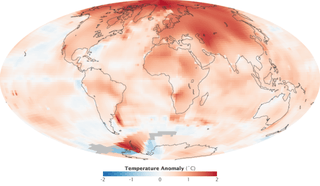
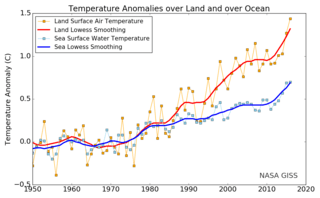
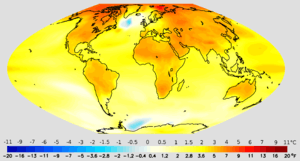
Global warming refers to global averages. It is not uniform around the world: effects can vary by region.[40] Since 1979, global average land temperatures have increased about twice as fast as global average ocean temperatures (0.25 °C per decade against 0.13 °C per decade).[41] Ocean temperatures increase more slowly than land temperatures because of the larger heat capacity of the oceans and because oceans lose more heat by evaporation.[42] Since the beginning of industrialisation in the 18th century, the temperature difference between the hemispheres has increased due to melting of sea ice and snow in the North, and because there is more land in the Northern Hemisphere.[43] In the past 100 years, average Arctic temperatures have increased at almost twice the rate of the rest of the world.[44] This has been referred to as Arctic amplification.
Although more greenhouse gases are emitted in the Northern than in the Southern Hemisphere, this does not contribute to the difference in warming because the major greenhouse gases persist long enough to diffuse within and between the two hemispheres.[45]
There are different ways in which a climate can be forced to change, but because the climate system has large thermal inertia, it can take centuries – or even longer – for the climate to fully adjust. One climate commitment study concluded that if greenhouse gases were stabilized at year 2000 levels, surface temperatures would still increase by about 0.5 °C,[46] and another found that if they were stabilized at 2005 levels, surface warming could exceed a whole degree Celsius. Some of this surface warming would be driven by past natural forcings which have not yet reached equilibrium in the climate system. One study using a highly simplified climate model indicates these past natural forcings may account for as much as 64% of the committed 2050 surface warming, and their influence will fade with time compared to the human contribution.[47]
Global temperature is subject to short-term fluctuations that overlay long-term trends, and can temporarily mask or magnify them.[48][49] The relative stability in surface temperature from 2002 to 2009, which has since been dubbed the global warming hiatus by the media and some scientists,[50] may be an example of such an episode.[51][52] 2015 updates to account for differing methods of ocean surface temperature measurements show a positive trend over the recent decade.[53][54]
Warmest years vs. overall trend
Sixteen of the seventeen warmest years on record have occurred since 2000.[55] While record-breaking years attract considerable public interest, individual years are less significant than the overall trend. Some climatologists have criticized the attention that the popular press gives to "warmest year" statistics. In particular, ocean oscillations such as the El Niño–Southern Oscillation (ENSO) can cause temperatures of a given year to be abnormally warm or cold for reasons unrelated to the overall trend of climate change. Gavin Schmidt stated: "the long-term trends or the expected sequence of records are far more important than whether any single year is a record or not."[56]
Initial causes of temperature changes (external forcings)
By itself, the climate system may generate random changes in global temperatures for years to decades at a time, but long-term changes emanate only from so-called external forcings.[57][58][59] These forcings are "external" to the climate system, but not necessarily external to Earth.[60] Examples of external forcings include changes in the composition of the atmosphere (e.g., increased concentrations of greenhouse gases), solar luminosity, volcanic eruptions, and variations in Earth's orbit around the Sun.[61]
Greenhouse gases
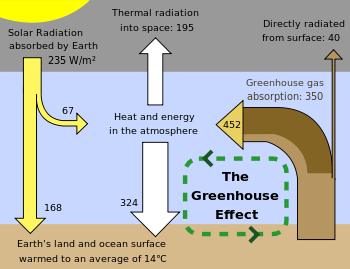
The greenhouse effect is the process by which absorption and emission of infrared radiation by gases in a planet's atmosphere warm its lower atmosphere and surface. It was proposed by Joseph Fourier in 1824, discovered in 1860 by John Tyndall,[62] was first investigated quantitatively by Svante Arrhenius in 1896,[63] and the hypothesis was reported in the popular press as early as 1912.[64][65] The scientific description of global warming was further developed in the 1930s through 1960s by Guy Stewart Callendar.[66][67]
_png.png)
On Earth, an atmosphere containing naturally occurring amounts of greenhouse gases causes air temperature near the surface to be warmer by about 33 °C (59 °F) than it would be in their absence.[68][lower-alpha 4] Without the Earth's atmosphere, the Earth's average temperature would be well below the freezing temperature of water.[69] The major greenhouse gases are water vapour, which causes about 36–70% of the greenhouse effect; carbon dioxide (CO2), which causes 9–26%; methane (CH4), which causes 4–9%; and ozone (O3), which causes 3–7%.[70][71][72]
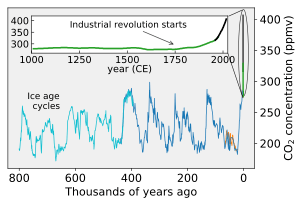
Human activity since the Industrial Revolution has increased the amount of greenhouse gases in the atmosphere, leading to increased radiative forcing from CO2, methane, tropospheric ozone, CFCs, and nitrous oxide. According to work published in 2007, the concentrations of CO2 and methane had increased by 36% and 148% respectively since 1750.[73] These levels are much higher than at any time during the last 800,000 years, the period for which reliable data has been extracted from ice cores.[74][75][76][77] Less direct geological evidence indicates that CO2 values higher than this were last seen about 20 million years ago.[78]
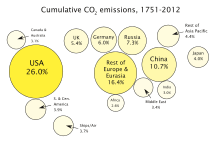
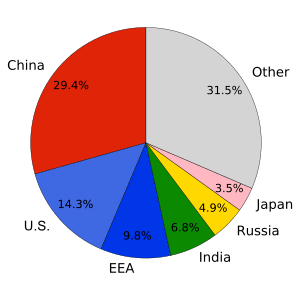
Fossil fuel burning has produced about three-quarters of the increase in CO2 from human activity over the past 20 years. The rest of this increase is caused mostly by changes in land-use, particularly deforestation.[79] Another significant non-fuel source of anthropogenic CO2 emissions is the calcination of limestone for clinker production, a chemical process which releases CO2.[80] Estimates of global CO2 emissions in 2011 from fossil fuel combustion, including cement production and gas flaring, was 34.8 billion tonnes (9.5 ± 0.5 PgC), an increase of 54% above emissions in 1990. Coal burning was responsible for 43% of the total emissions, oil 34%, gas 18%, cement 4.9% and gas flaring 0.7%.[81]
In May 2013, it was reported that readings for CO2 taken at the world's primary benchmark site in Mauna Loa surpassed 400 ppm. According to professor Brian Hoskins, this is likely the first time CO2 levels have been this high for about 4.5 million years.[82][83] Monthly global CO2 concentrations exceeded 400 ppm in March 2015, probably for the first time in several million years.[84] On 12 November 2015, NASA scientists reported that human-made carbon dioxide continues to increase above levels not seen in hundreds of thousands of years; currently, about half of the carbon dioxide released from the burning of fossil fuels is not absorbed by vegetation and the oceans and remains in the atmosphere.[85]
Over the last three decades of the twentieth century, gross domestic product per capita and population growth were the main drivers of increases in greenhouse gas emissions.[86] CO2 emissions are continuing to rise due to the burning of fossil fuels and land-use change.[87][88]:71 Emissions can be attributed to different regions. Attributions of emissions due to land-use change are subject to considerable uncertainty.[89][90]:289
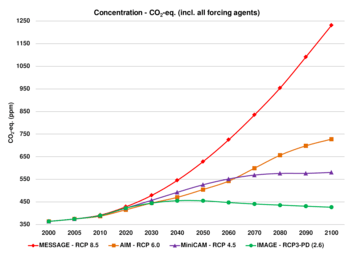
Emissions scenarios, estimates of changes in future emission levels of greenhouse gases, have been projected that depend upon uncertain economic, sociological, technological, and natural developments.[91] In most scenarios, emissions continue to rise over the century, while in a few, emissions are reduced.[92][93] Fossil fuel reserves are abundant, and will not limit carbon emissions in the 21st century.[94] Emission scenarios, combined with modelling of the carbon cycle, have been used to produce estimates of how atmospheric concentrations of greenhouse gases might change in the future. Using the six IPCC SRES "marker" scenarios, models suggest that by the year 2100, the atmospheric concentration of CO2 could range between 541 and 970 ppm.[95]
Aerosols and soot
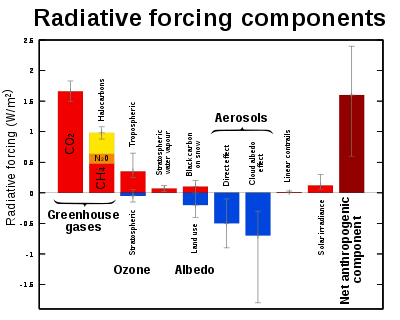
Global dimming, a gradual reduction in the amount of global direct irradiance at the Earth's surface, was observed from 1961 until at least 1990.[96] Solid and liquid particles known as aerosols, produced by volcanoes and human-made pollutants, are thought to be the main cause of this dimming. They exert a cooling effect by increasing the reflection of incoming sunlight. The effects of the products of fossil fuel combustion – CO2 and aerosols – have partially offset one another in recent decades, so that net warming has been due to the increase in non-CO2 greenhouse gases such as methane.[97] Radiative forcing due to aerosols is temporally limited due to the processes that remove aerosols from the atmosphere. Removal by clouds and precipitation gives tropospheric aerosols an atmospheric lifetime of only about a week, while stratospheric aerosols can remain for a few years. Carbon dioxide has a lifetime of a century or more, and as such, changes in aerosols will only delay climate changes due to carbon dioxide.[98] Black carbon is second only to carbon dioxide for its contribution to global warming (contribution being estimated at 17 to 20%, whereas carbon dioxide contributes 40 to 45% to global warming[99][100]).[101]
In addition to their direct effect by scattering and absorbing solar radiation, aerosols have indirect effects on the Earth's radiation budget. Sulfate aerosols act as cloud condensation nuclei and thus lead to clouds that have more and smaller cloud droplets. These clouds reflect solar radiation more efficiently than clouds with fewer and larger droplets, a phenomenon known as the Twomey effect.[102] This effect also causes droplets to be of more uniform size, which reduces growth of raindrops and makes the cloud more reflective to incoming sunlight, known as the Albrecht effect.[103] Indirect effects are most noticeable in marine stratiform clouds, and have very little radiative effect on convective clouds. Indirect effects of aerosols represent the largest uncertainty in radiative forcing.[104]
Soot may either cool or warm Earth's climate system, depending on whether it is airborne or deposited. Atmospheric soot directly absorbs solar radiation, which heats the atmosphere and cools the surface. In isolated areas with high soot production, such as rural India, as much as 50% of surface warming due to greenhouse gases may be masked by atmospheric brown clouds.[105] When deposited, especially on glaciers or on ice in arctic regions, the lower surface albedo can also directly heat the surface.[106] The influences of atmospheric particles, including black carbon, are most pronounced in the tropics and sub-tropics, particularly in Asia, while the effects of greenhouse gases are dominant in the extratropics and southern hemisphere.[107]
Solar activity
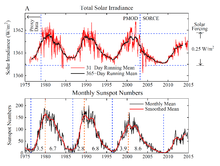
Since 1978, solar irradiance has been measured by satellites.[110]
Climate models have been used to examine the role of the Sun in recent climate change.[111] Models are unable to reproduce the rapid warming observed in recent decades when only taking into account variations in solar output and volcanic activity.
Another line of evidence for the Sun's non-attributability is the differing temperature changes at different levels in the Earth's atmosphere.[112] According to basic physical principles, the greenhouse effect produces warming of the lower atmosphere (the troposphere), but cooling of the upper atmosphere (the stratosphere).[113][114] If solar variations were responsible for the observed warming, warming of both the troposphere and the stratosphere would be expected.[115]
Variations in Earth's orbit
The tilt of the Earth’s axis and the shape of its orbit around the Sun vary slowly over tens of thousands of years. This changes climate by changing the seasonal and latitudinal distribution of incoming solar energy at Earth's surface.[116] During the last few thousand years, this phenomenon contributed to a slow cooling trend at high latitudes of the Northern Hemisphere during summer, a trend that was reversed by greenhouse-gas-induced warming during the 20th century.[117][118][119][120] Orbital cycles favorable for glaciation are not expected within the next 50,000 years.[121][122]
Climate change feedback
.jpg)
The climate system includes a range of feedbacks, which alter the response of the system to changes in external forcings. Positive feedbacks increase the response of the climate system to an initial forcing, while negative feedbacks reduce it.[124] Climate system feedbacks feature thresholds, constrained by planetary boundary conditions, which may trigger other processes on regional or global scale, and may act in a non-linear expression, until a system reaches a new stable state.[125]
There are a range of feedbacks in the climate system, including water vapour, changes in ice–albedo (snow and ice cover affect how much the Earth's surface absorbs or reflects incoming sunlight), clouds, and changes in the Earth's carbon cycle (e.g., the release of carbon from soil).[126] The main negative feedback is the energy the Earth's surface radiates into space as infrared radiation.[127] According to the Stefan-Boltzmann law, if the absolute temperature (as measured in kelvins) doubles,[lower-alpha 5] radiated energy increases by a factor of 16 (2 to the 4th power).[128]
Feedbacks are an important factor in determining the sensitivity of the climate system to increased atmospheric greenhouse gas concentrations. Other factors being equal, a higher climate sensitivity means that more warming will occur for a given increase in greenhouse gas forcing.[129] Uncertainty over the effect of feedbacks is a major reason why different climate models project different magnitudes of warming for a given forcing scenario. More research is needed to understand the role of clouds[124] and carbon cycle feedbacks in climate projections.[130]
The IPCC projections previously mentioned span the "likely" range (greater than 66% probability, based on expert judgement)[131] for the selected emissions scenarios. However, the IPCC's projections do not reflect the full range of uncertainty.[132] The lower end of the "likely" range appears to be better constrained than the upper end.[132]
An observation based study on future climate change, on the soil carbon feedback, conducted since 1991 in Harvard, suggests release of about 190 petagrams of soil carbon, the equivalent of the past two decades of greenhouse gas emissions from fossil fuel burning, until 2100 from the top 1-meter of Earth's soils, due to changes in microbial communities under elevated temperatures.[133][134] Climate models do not account for this possible feedback mechanism. Another study conducted by Harvard researchers suggests that increased water vapor injected into the stratosphere, due to rising temperatures, increases ozone depletion, subsequently raising the odds of skin cancer and damaging crops.[135]
A 2018 study tried to identify a planetary threshold for self-reinforcing feedbacks that progress even when man-made emissions are reduced, which could eventually lead to a new hothouse climate state. This would make parts of the world uninhabitable, raise sea levels by up to 60 metres (200 ft), and raise temperatures by 4–5 °C (7.2–9.0 °F) to levels that are higher than any interglacial period in the past 1.2 million years. The authors suggest, based on previous studies, that even a 2 °C (3.6 °F) increase in temperature over pre-industrial levels, which is the upper limit set in the Paris Agreement, may be enough to trigger such a hothouse Earth scenario. Co-author Johan Rockström notes that whether this would occur "is one of the most existential questions in science". Study author Katherine Richardson stresses, "We note that the Earth has never in its history had a quasi-stable state that is around 2 °C warmer than the preindustrial and suggest that there is substantial risk that the system, itself, will 'want' to continue warming because of all of these other processes – even if we stop emissions. This implies not only reducing emissions but much more."[27][136][137]
Arctic amplification
The 2007 IPCC report noted that Arctic temperatures have increased at almost twice the rate of the rest of the world.[138] This has been referred to as Arctic amplification. The observed Arctic amplification appears to arise both from an intensification of poleward heat transport and more directly from changes in the local net radiation balance.[139] Some examples of climate system feedbacks thought to contribute to recent polar amplification include the reduction of snow cover and sea ice, changes in atmospheric and ocean circulation, the presence of anthropogenic soot in the Arctic environment, increases in cloud cover, and water vapor. According to the 2013 IPCC report, models often tend to underestimate Arctic amplification.[140][141]
Studies have linked the rapidly warming Arctic to a vanishing cryosphere, and extreme weather in mid-latitudes.[142][143][144][145] Studies further link Arctic amplification to extreme weather, caused by changes in the jet stream.[146] Winds at the low-levels of the Earth's atmosphere, as well as in the troposphere, are weakening as a result of changing temperature gradients between the Arctic and the Equator.[147] This means that these planetary wind systems are increasingly unable to shift the weather.[147]
Extreme prolonged weather events tied to almost stationary jet stream waves in the Northern Hemisphere include the 2003 European heat wave, the 2010 Russian heat wave, the 2010 Pakistan floods, or the 2018 European heat wave.[148][149]
Climate models
A climate model is a representation of the physical, chemical and biological processes that affect the climate system.[152]
Although researchers attempt to include as many processes as possible, simplifications of the actual climate system are inevitable because of the constraints of available computer power and limitations in knowledge of the climate system. Results from models can also vary due to different greenhouse gas inputs and the model's climate sensitivity. For example, the uncertainty in IPCC's 2007 projections is caused by (1) the use of multiple models[132] with differing sensitivity to greenhouse gas concentrations,[153] (2) the use of differing estimates of humanity's future greenhouse gas emissions,[132] (3) any additional emissions from climate feedbacks that were not included in the models IPCC used to prepare its report, i.e., greenhouse gas releases from permafrost.[154]
The models do not assume the climate will warm due to increasing levels of greenhouse gases. Instead the models predict how greenhouse gases will interact with radiative transfer and other physical processes. Warming or cooling is thus a result, not an assumption, of the models.[155]
Clouds and their effects are especially difficult to predict. Improving the models' representation of clouds is therefore an important topic in current research.[156] Another prominent research topic is expanding and improving representations of the carbon cycle.[157][158][159]
Models are also used to help investigate the causes of recent climate change by comparing the observed changes to those that the models project from various natural and human causes. Although these models do not unambiguously attribute the warming that occurred from approximately 1910 to 1945 to either natural variation or human effects, they do indicate that the warming since 1970 is dominated by anthropogenic greenhouse gas emissions.[61]
The physical realism of models is tested by examining their ability to simulate contemporary or past climates.[160] Climate models produce a good match to observations of global temperature changes over the last century, but do not simulate all aspects of climate.[161] Not all effects of global warming are accurately predicted by the climate models used by the IPCC. Observed Arctic shrinkage has been faster than that predicted.[162] Precipitation increased proportionally to atmospheric humidity, and hence significantly faster than global climate models predict.[163][164] Since 1990, sea level has also risen considerably faster than models predicted it would.[165] The 2017 United States published National Climate Assessment, notes that "climate models may still be underestimating or missing relevant feedback processes".[166]
Effects
.png)
Biosphere
Overall, it is expected that climate change will result in the extinction of many species and reduced diversity of ecosystems.[169] Rising temperatures have been found to push bees to their physiological limits, and could cause the extinction of bee populations.[170] A 2012 study concluded that continued ocean uptake of CO2 affects the brains and central nervous system of certain fish species and this impacts their ability to hear, smell, and evade predators. The study authors note, "We've now established it isn't simply the acidification of the oceans that is causing disruption—as is the case with shellfish and plankton with chalky skeletons—but the actual dissolved CO2 itself is damaging the fishes' nervous systems."[171]
Environmental
The environmental effects of global warming are broad and far reaching. They include the following diverse effects:
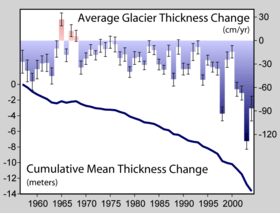
- Arctic sea ice decline, sea level rise, retreat of glaciers: Global warming has led to decades of shrinking and thinning in a warm climate that has put the Arctic sea ice in a precarious position, it is now vulnerable to atmospheric anomalies.[174] Projections of declines in Arctic sea ice vary.[175][176] Recent projections suggest that Arctic summers could be ice-free (defined as ice extent less than 1 million square km) as early as 2025–2030.[177] The sea level rise since 1993 has been estimated to have been on average 2.6 mm and 2.9 mm per year ± 0.4 mm. Additionally, sea level rise has accelerated from 1995 to 2015.[178] Over the 21st century, the IPCC projects for a high emissions scenario, that global mean sea level could rise by 52–98 cm.[179]
- Extreme weather, extreme events, tropical cyclones: Data analysis of extreme events from 1960 until 2010 suggests that droughts and heat waves appear simultaneously with increased frequency.[180] Extremely wet or dry events within the monsoon period have increased since 1980.[181] Projections suggest a probable increase in the frequency and severity of some extreme weather events, such as heat waves.[182]
- Ecosystem changes, changes in ocean properties: In terrestrial ecosystems, the earlier timing of spring events, as well as poleward and upward shifts in plant and animal ranges, have been linked with high confidence to recent warming.[183] It is expected that most ecosystems will be affected by higher atmospheric CO2 levels, combined with higher global temperatures.[184] Expansion of deserts in the subtropics is probably linked to global warming.[16] The physical effect of global warming on oceans include an increase in acidity, and a reduction of oxygen levels (ocean deoxygenation).[185][186] Increases in atmospheric CO2 concentrations have led to an increase in dissolved CO2 and thus ocean acidity, measured by lower pH values.[185] Ocean acidification threatens damage to coral reefs, fisheries, protected species, and other natural resources of value to society.[185][187] Without substantial actions to reduce the rate of global warming, land based ecosystems are at risk of major ecological shifts, transforming composition and structure.[188]
- Long-term effects of global warming, runaway climate change: On the timescale of centuries to millennia, the magnitude of global warming will be determined primarily by anthropogenic CO2 emissions.[189] This is due to carbon dioxide's very long lifetime in the atmosphere.[189] Long-term effects also include a response from the Earth's crust, due to ice melting and deglaciation, in a process called post-glacial rebound, when land masses are no longer depressed by the weight of ice. This could lead to landslides and increased seismic and volcanic activities. Tsunamis could be generated by submarine landslides caused by warmer ocean water thawing ocean-floor permafrost or releasing gas hydrates.[190]
- Abrupt climate change, cold blob (North Atlantic): Climate change could result in global, large-scale changes in natural and social systems.[191] Examples include ocean acidification caused by increased atmospheric concentrations of carbon dioxide, and the long-term melting of ice sheets, which contributes to sea level rise.[192] Some large-scale changes could occur abruptly, i.e., over a short time period, and might also be irreversible. Examples of abrupt climate change are the rapid release of methane and carbon dioxide from permafrost, which would lead to amplified global warming. Another example is the possibility for the Atlantic Meridional Overturning Circulation to slow- or shutdown (see also shutdown of thermohaline circulation).[193][194] This could trigger cooling in the North Atlantic, Europe, and North America.[195][196] It would particularly affect areas such as the British Isles, France and the Nordic countries, which are warmed by the North Atlantic drift.[197][198]
Social systems
The effects of climate change on human systems, mostly due to warming or shifts in precipitation patterns, or both, have been detected worldwide. The future social impacts of climate change will be uneven across the world.[199] Many risks are expected to increase with higher magnitudes of global warming.[200] All regions are at risk of experiencing negative impacts.[201] Low-latitude, less developed areas face the greatest risk.[202] A study from 2015 concluded that economic growth (gross domestic product) of poorer countries is much more impaired with projected future climate warming, than previously thought.[203] In small islands and mega deltas, inundation as a result of sea level rise is expected to threaten vital infrastructure and human settlements.[204][205] This could lead to issues of homelessness in countries with low-lying areas such as Bangladesh, as well as statelessness for populations in countries such as the Maldives and Tuvalu.[206]
Examples of impacts of global warming on humans include:
- A meta-analysis concluded in 2014 that each degree of temperature rise will increase violence by up to 20%, which includes fist fights, violent crimes, civil unrest, or wars.[207]
- Estimates in 2015 based on the IPCC A1B emission scenario from additional greenhouse gases released from permafrost, found associated impact damages to the economy to be US$43 trillion.[208]
- Crop production will probably be negatively affected in low latitude countries, while effects at northern latitudes may be positive or negative.[209] Global warming of around 4.6 °C relative to pre-industrial levels could pose a large risk to global and regional food security.[210] The impact of climate change on crop productivity for the four major crops was negative for wheat and maize and neutral for soy and rice in the years 1960-2013.[211] While crop production has increased in some mid-latitude regions such as the UK and Northeast China, economic losses due to extreme weather events have increased globally.[212] See also Climate change and agriculture.
- Generally impacts on public health will be more negative than positive.[213][214][215] Impacts include: the effects of extreme weather, leading to injury and loss of life;[216] and indirect effects, such as undernutrition brought on by crop failures.[214][215][217] There has been a shift from cold- to heat-related mortality in some regions as a result of warming.[212] A 2018 study of data from the U.S. Centers for Disease Control and Prevention connected temperature rise to increased numbers of suicides.[218] The study revealed that hotter days could increase suicide rates and could cause approximately 26,000 more suicides in the U.S. by 2050.[219]
- Livelihoods of indigenous peoples of the Arctic have been altered by climate change, and there is emerging evidence of climate change impacts on livelihoods of indigenous peoples in other regions. Regional impacts of climate change are now observable at more locations than before, on all continents and across ocean regions.[212]
Regional
The Arctic, Africa, small islands and Asian megadeltas are regions that are likely to be especially affected by future climate change.[220] Africa is one of the most vulnerable continents to climate variability and change because of multiple existing stresses and low adaptive capacity.[221] Existing stresses include poverty, political conflicts, and ecosystem degradation. By 2050, between 350 million and 600 million people are projected to experience increased water stress due to climate change (see Climate change in Africa).[221] Climate variability and change is projected to severely compromise agricultural production, including access to food, across Africa.[221] Research projects that regions even may become uninhabitable, due to a high wet-bulb temperature.[222]
Responses
Mitigation
.png)
Mitigation of climate change are actions to reduce greenhouse gas emissions, or enhance the capacity of carbon sinks to absorb greenhouse gases from the atmosphere.[224] There is a large potential for future reductions in emissions by a combination of activities, including energy conservation and increased energy efficiency; the use of low-carbon energy technologies, such as renewable energy, nuclear energy, and carbon capture and storage;[225][226] and enhancing carbon sinks through, for example, reforestation and preventing deforestation.[225][226] A 2015 report by Citibank concluded that transitioning to a low carbon economy would yield positive return on investments.[227]
Near- and long-term trends in the global energy system are inconsistent with limiting global warming at below 1.5 or 2 °C, relative to pre-industrial levels.[228][229] Pledges made as part of the Cancún agreements are broadly consistent with having a likely chance (66 to 100% probability) of limiting global warming (in the 21st century) at below 3 °C, relative to pre-industrial levels.[229]
In limiting warming at below 2 °C, more stringent emission reductions in the near-term would allow for less rapid reductions after 2030.[230] Many integrated models are unable to meet the 2 °C target if pessimistic assumptions are made about the availability of mitigation technologies.[231]
Adaptation
Climate change adaptation is another policy response. The adaptation may be planned, either in reaction to or anticipation of global warming, or spontaneous, i.e., without government intervention.[232] Planned adaptation is already occurring on a limited basis.[225] The barriers, limits, and costs of future adaptation are not fully understood.[225] Environmental organizations and public figures have emphasized changes in the climate and the risks they entail, while promoting adaptation to changes in infrastructural needs and emissions reductions.[233]
Adaptation is especially important in developing countries since those countries are predicted to bear the brunt of the effects of global warming.[234] That is, the capacity and potential for humans to adapt (called adaptive capacity) is unevenly distributed across different regions and populations, and developing countries generally have less capacity to adapt.[235]
Climate engineering
Climate engineering (sometimes called geoengineering or climate intervention) is the deliberate modification of the climate. It has been investigated as a possible response to global warming, e.g. by NASA[236] and the Royal Society.[237] Techniques under research fall generally into the categories solar radiation management and carbon dioxide removal, although various other schemes have been suggested. A study from 2014 investigated the most common climate engineering methods and concluded they are either ineffective or have potentially severe side effects and cannot be stopped without causing rapid climate change.[238]
Society and culture
Political discussion
_1.svg.png)
Most countries in the world are parties to the United Nations Framework Convention on Climate Change (UNFCCC).[241] The ultimate objective of the Convention is to prevent dangerous human interference of the climate system.[242] As stated in the Convention, this requires that greenhouse gas concentrations are stabilized in the atmosphere at a level where ecosystems can adapt naturally to climate change, food production is not threatened, and economic development can proceed in a sustainable fashion.[243] The Framework Convention was agreed on in 1992, but global emissions have risen since then.[244]
During negotiations, the G77 (a lobbying group in the United Nations representing 133 developing countries)[245]:4 pushed for a mandate requiring developed countries to "[take] the lead" in reducing their emissions.[246] This was justified on the basis that the developed countries' emissions had contributed most to the cumulation of greenhouse gases in the atmosphere, per-capita emissions (i.e., emissions per head of population) were still relatively low in developing countries, and the emissions of developing countries would grow to meet their development needs.[90]:290
This mandate was sustained in the Kyoto Protocol to the Framework Convention,[90]:290 which entered into legal effect in 2005.[247] In ratifying the Kyoto Protocol, most developed countries accepted legally binding commitments to limit their emissions. These first-round commitments expired in 2012.[247] United States President George W. Bush rejected the treaty on the basis that "it exempts 80% of the world, including major population centres such as China and India, from compliance, and would cause serious harm to the US economy".[245]:5
At the 15th UNFCCC Conference of the Parties, held in 2009 at Copenhagen, several UNFCCC Parties produced the Copenhagen Accord.[248][249] Parties associated with the Accord (140 countries, as of November 2010)[250]:9 aim to limit the future increase in global mean temperature to below 2 °C.[251] The 16th Conference of the Parties (COP16) was held at Cancún in 2010. It produced an agreement, not a binding treaty, that the Parties should take urgent action to reduce greenhouse gas emissions to meet a goal of limiting global warming to 2 °C above pre-industrial temperatures. It also recognized the need to consider strengthening the goal to a global average rise of 1.5 °C.[252]
Scientific discussion
The discussion continues in scientific articles that are peer-reviewed and assessed by scientists who work in the relevant fields and participate in the Intergovernmental Panel on Climate Change. The scientific consensus as of 2013 stated in the IPCC Fifth Assessment Report is that it "is extremely likely that human influence has been the dominant cause of the observed warming since the mid-20th century".[253] A 2008 report by the U.S. National Academy of Sciences stated that most scientists by then agreed that observed warming in recent decades was primarily caused by human activities increasing the amount of greenhouse gases in the atmosphere.[87] In 2005 the Royal Society stated that while the overwhelming majority of scientists were in agreement on the main points, some individuals and organizations opposed to the consensus on urgent action needed to reduce greenhouse gas emissions had tried to undermine the science and work of the IPCC.[254] National science academies have called on world leaders for policies to cut global emissions.[255]
In 2018, the IPCC published SR15, which warned that if current rate of greenhouse gas emissions are not mitigated, major crises could occur by 2040 as the planet warms by 2.7 degrees Fahrenheit (1.5 degrees Celsius). The report said that preventing such crises will require a swift transformation of the global economy that has "no documented historic precedent."[256]
In the scientific literature, there is a strong consensus that global surface temperatures have increased in recent decades and that the trend is caused mainly by human-induced emissions of greenhouse gases.[257] No scientific body of national or international standing disagrees with this view.[258][259] In November 2017, a second warning to humanity signed by 15,364 scientists from 184 countries stated that "the current trajectory of potentially catastrophic climate change due to rising greenhouse gases from burning fossil fuels, deforestation, and agricultural production – particularly from farming ruminants for meat consumption" is "especially troubling".[260] A July 2017 study published in Environmental Research Letters asserts that the most significant action individuals could make to mitigate their own carbon footprint is to have fewer children, followed by living vehicle free, forgoing air travel and adopting a plant-based diet.[261]
Public opinion and disputes
The global warming controversy refers to a variety of disputes, substantially more pronounced in the popular media than in the scientific literature,[262][263] regarding the nature, causes, and consequences of global warming. The disputed issues include the causes of increased global average air temperature, especially since the mid-20th century, whether this warming trend is unprecedented or within normal climatic variations, whether humankind has contributed significantly to it, and whether the increase is completely or partially an artefact of poor measurements. Additional disputes concern estimates of climate sensitivity, predictions of additional warming, and what the consequences of global warming will be.
In the United States from about 1990 onwards, American conservative think tanks had begun challenging the legitimacy of global warming as a social problem. They challenged the scientific evidence, argued that global warming would have benefits, and asserted that proposed solutions would do more harm than good.[264] Some people dispute aspects of climate change science.[254][265] Organizations such as the libertarian Competitive Enterprise Institute, conservative commentators, and some companies such as ExxonMobil have challenged IPCC climate change scenarios, funded scientists who disagree with the scientific consensus, and provided their own projections of the economic cost of stricter controls.[266][267][268][269] On the other hand, some fossil fuel companies have scaled back their efforts in recent years,[270] or even called for policies to reduce global warming.[271] Global oil companies have begun to acknowledge climate change exists and is caused by human activities and the burning of fossil fuels.[272]
The global warming problem came to international public attention in the late 1980s. Polling groups began to track opinions on the subject, at first mainly in the United States.[273] The longest consistent polling, by Gallup in the US, found relatively small deviations of 10% or so from 1998 to 2015 in opinion on the seriousness of global warming, but with increasing polarization between those concerned and those unconcerned.[274]
Due to confusing media coverage in the early 1990s, issues such as ozone depletion and climate change were often mixed up, affecting public understanding of these issues.[275] According to a 2010 survey of Americans, a majority thought that the ozone layer and spray cans contribute to global warming.[276] Although there are a few areas of linkage, the relationship between the two is not strong. Reduced stratospheric ozone has had a slight cooling influence on surface temperatures, while increased tropospheric ozone has had a somewhat larger warming effect.[277] However, the CFC's used in spray cans are powerful greenhouse gases, with some estimates attributing CFC emissions during the 70s to have caused almost half of the global warming for that decade.[278]
By 2010, with 111 countries surveyed, Gallup determined that there had been a substantial decrease since 2007–2008 in the number of Americans and Europeans who viewed global warming as a serious threat. In the US, just a little over half the population (53%) viewed it as a serious concern for either themselves or their families; this was 10 points below the 2008 poll (63%). Latin America had the biggest rise in concern: 73% said global warming was a serious threat to their families.[279] This global poll also found that people were more likely to attribute global warming to human activities than to natural causes, except in the US where nearly half (47%) of the population attributed global warming to natural causes.[280]
A March–May 2013 survey by Pew Research Center for the People & the Press polled 39 countries about global threats. According to 54% of those questioned, global warming featured top of the perceived global threats.[281]
History
The history of climate change science began in the early 19th century when ice ages and other natural changes in paleoclimate were first suspected and the natural greenhouse effect first identified.[63] In the late 19th century, scientists first argued that human emissions of greenhouse gases could change the climate. In the 1960s, the warming effect of carbon dioxide gas became increasingly convincing.[282] By the 1990s, as a result of improving fidelity of computer models and observational work confirming the Milankovitch theory of the ice ages, a consensus position formed: greenhouse gases were deeply involved in most climate changes and human caused emissions were bringing discernible global warming. Since the 1990s, scientific research on climate change has included multiple disciplines and has expanded.[283] Research during this period has been summarized in the Assessment Reports by the Intergovernmental Panel on Climate Change.
Terminology
In the 1950s, research suggested increasing temperatures, and a 1952 newspaper reported "climate change". This phrase next appeared in a November 1957 report in The Hammond Times which described Roger Revelle's research into the effects of increasing human-caused CO2 emissions on the greenhouse effect, "a large scale global warming, with radical climate changes may result". Both phrases were used only occasionally until 1975, when Wallace Smith Broecker published a scientific paper on the topic, "Climatic Change: Are We on the Brink of a Pronounced Global Warming?" The phrase began to come into common use, and in 1976 Mikhail Budyko's statement that "a global warming up has started" was widely reported.[282] Other studies, such as a 1971 MIT report, referred to the human impact as "inadvertent climate modification", but an influential 1979 National Academy of Sciences study headed by Jule Charney followed Broecker in using global warming for rising surface temperatures, while describing the wider effects of increased CO2 as climate change.[7]
In 1986 and November 1987, NASA climate scientist James Hansen gave testimony to Congress on global warming. There were increasing heatwaves and drought problems in the summer of 1988, and when Hansen testified in the Senate on 23 June he sparked worldwide interest.[283] He said, "global warming has reached a level such that we can ascribe with a high degree of confidence a cause and effect relationship between the greenhouse effect and the observed warming."[284] Public attention increased over the summer, and global warming became the dominant popular term, commonly used both by the press and in public discourse.[7]
In a 2008 NASA article on usage, Erik M. Conway defined global warming as "the increase in Earth's average surface temperature due to rising levels of greenhouse gases", while climate change was "a long-term change in the Earth's climate, or of a region on Earth". Because effects such as changing patterns of rainfall and rising sea levels would probably have more impact than temperatures alone, he considered global climate change a more scientifically accurate term, and like the Intergovernmental Panel on Climate Change, the NASA website emphasized this wider context.[7]
See also
- Anthropocene
- Climate change and agriculture
- Environmental impact of the coal industry
- Geologic temperature record
- Global cooling
- Glossary of climate change
- Greenhouse gas emissions accounting
- List of countries by carbon dioxide emissions
- Holocene extinction
- Index of climate change articles
- Scientific opinion on climate change
Notes
- ↑ The 2001 joint statement was signed by the national academies of science of Australia, Belgium, Brazil, Canada, the Caribbean, the People's Republic of China, France, Germany, India, Indonesia, Ireland, Italy, Malaysia, New Zealand, Sweden, and the UK.[11] The 2005 statement added Japan, Russia, and the US. The 2007 statement added Mexico and South Africa. The Network of African Science Academies and the Polish Academy of Sciences have issued separate statements. Professional scientific societies include American Astronomical Society, American Chemical Society, American Geophysical Union, American Institute of Physics, American Meteorological Society, American Physical Society, American Quaternary Association, Australian Meteorological and Oceanographic Society, Canadian Foundation for Climate and Atmospheric Sciences, Canadian Meteorological and Oceanographic Society, European Academy of Sciences and Arts, European Geosciences Union, European Science Foundation, Geological Society of America, Geological Society of Australia, Geological Society of London-Stratigraphy Commission, InterAcademy Council, International Union of Geodesy and Geophysics, International Union for Quaternary Research, National Association of Geoscience Teachers, National Research Council (US), Royal Meteorological Society, and World Meteorological Organization.
- ↑ Earth has already experienced almost 1/2 of the 2.0 °C (3.6 °F) described in the Cancún Agreement. In the last 100 years, Earth's average surface temperature increased by about 0.8 °C (1.4 °F) with about two thirds of the increase occurring over just the last three decades.[24]
- ↑ Scientific journals use "global warming" to describe an increasing global average temperature just at earth's surface, and most of these authorities further limit "global warming" to such increases caused by human activities or increasing greenhouse gases.
- ↑ The greenhouse effect produces an average worldwide temperature increase of about 33 °C (59 °F) compared to black body predictions without the greenhouse effect, not an average surface temperature of 33 °C (91 °F). The average worldwide surface temperature is about 14 °C (57 °F).
- ↑ A rise in temperature from 10 °C to 20 °C is not a doubling of absolute temperature; a rise from (273 + 10) K = 283 K to (273 + 20) K = 293 K is an increase of (293–283)/283 = 3.5 %.
Citations
- ↑ http://berkeleyearth.lbl.gov/auto/Global/Land_and_Ocean_summary.txt Berkeley Earth – Land and Ocean Summary
- ↑ Shaftel, Holly (January 2016). "What's in a name? Weather, global warming and climate change". NASA Climate Change: Vital Signs of the Planet. Retrieved 12 October 2018.
- ↑ Hartmann, Dennis L.; Klein Tank, Albert M. G.; Rusticucci, Matilde (2013). "2: Observations: Atmosphere and Surface" (PDF). IPCC WGI AR5 (Report). p. 198.
Evidence for a warming world comes from multiple independent climate indicators, from high up in the atmosphere to the depths of the oceans. They include changes in surface, atmospheric and oceanic temperatures; glaciers; snow cover; sea ice; sea level and atmospheric water vapour. Scientists from all over the world have independently verified this evidence many times.
- ↑ "Myths vs. Facts: Denial of Petitions for Reconsideration of the Endangerment and Cause or Contribute Findings for Greenhouse Gases under Section 202(a) of the Clean Air Act". U.S. Environmental Protection Agency. Retrieved 7 August 2017.
The U.S. Global Change Research Program, the National Academy of Sciences, and the Intergovernmental Panel on Climate Change (IPCC) have each independently concluded that warming of the climate system in recent decades is "unequivocal". This conclusion is not drawn from any one source of data but is based on multiple lines of evidence, including three worldwide temperature datasets showing nearly identical warming trends as well as numerous other independent indicators of global warming (e.g., rising sea levels, shrinking Arctic sea ice).
- ↑ "Climate change evidence: How do we know?". Climate Change: Vital Signs of the Planet. Retrieved 7 August 2017.
- ↑ "IPCC, Climate Change 2013: The Physical Science Basis – Summary for Policymakers (AR5 WG1)" (PDF). Intergovernmental Panel on Climate Change. p. 4.
Warming of the climate system is unequivocal, and since the 1950s, many of the observed changes are unprecedented over decades to millennia.
- 1 2 3 4 Erik Conway. "What's in a Name? Global Warming vs. Climate Change", NASA, 5 December 2008
- ↑ "IPCC, Climate Change 2013: The Physical Science Basis – Summary for Policymakers (AR5 WG1)" (PDF). Intergovernmental Panel on Climate Change. p. 17.
It is extremely likely that human influence has been the dominant cause of the observed warming since the mid-20th century.
- ↑ "IPCC, Climate Change 2013: The Physical Science Basis -Technical Summary" (PDF). Intergovernmental Panel on Climate Change. pp. 89–90.
- ↑ "Joint Science Academies' Statement" (PDF). Retrieved 6 January 2014.
- ↑ Kirby, Alex (17 May 2001). "Science academies back Kyoto". BBC News. Retrieved 27 July 2011.
- ↑ "Scientific consensus: Earth's climate is warming". Climate Change: Vital Signs of the Planet. NASA. Archived from the original on 28 June 2018. Retrieved 7 August 2017.
- ↑ "List of Organizations". The Governor's Office of Planning & Research, State of California. Archived from the original on 7 August 2017. Retrieved 7 August 2017.
- ↑ Field, Christopher B.; Barros, Vicente R.; Mach, Katharine J.; Mastrandrea, Michael D.; et al. "IPCC, Climate Change 2014: Impacts, Adaptation, and Vulnerability – Technical Summary" (PDF). Intergovernmental Panel on Climate Change. pp. 44–46.
- ↑ Solomon et al., Technical Summary, Section TS.5.3: Regional-Scale Projections, in IPCC AR4 WG1 2007.
- 1 2 Zeng, Ning; Yoon, Jinho (1 September 2009). "Expansion of the world's deserts due to vegetation-albedo feedback under global warming". Geophysical Research Letters. 36 (17): L17401. Bibcode:2009GeoRL..3617401Z. doi:10.1029/2009GL039699. ISSN 1944-8007.
- ↑ On snowfall:
- Christopher Joyce (15 February 2010). "Get This: Warming Planet Can Mean More Snow". NPR.
- "Global warming means more snowstorms: scientists". 1 March 2011.
- "Does record snowfall disprove global warming?". 9 July 2010. Retrieved 14 December 2014.
- ↑ Battisti, David S.; Naylor, Rosamond L. (9 January 2009). "Historical Warnings of Future Food Insecurity with Unprecedented Seasonal Heat". Science. 323 (5911): 240–44. doi:10.1126/science.1164363. ISSN 0036-8075. PMID 19131626.
- ↑ US NRC 2012, p. 26
- ↑ Clark, Peter U. (8 February 2016). "Consequences of twenty-first-century policy for multi-millennial climate and sea-level change". Nature Climate Change. 6 (4): 360–69. Bibcode:2016NatCC...6..360C. doi:10.1038/NCLIMATE2923.
- ↑ "Status of Ratification of the Convention". UNFCCC Secretariat: Bonn, Germany: United Nations Framework Convention on Climate Change. 2011. . Most countries in the world are Parties to the United Nations Framework Convention on Climate Change (UNFCCC), which has adopted the 2 °C limit. As of 25 November 2011, there are 195 parties (194 states and 1 regional economic integration organization (the European Union)) to the UNFCCC.
- ↑ "First steps to a safer future: Introducing The United Nations Framework Convention on Climate Change". United Nations Framework Convention on Climate Change. Archived from the original on 8 January 2014. Retrieved 7 August 2017.
Preventing "dangerous" human interference with the climate system is the ultimate aim of the UNFCCC.
- ↑ "Conference of the Parties – Sixteenth Session: Decision 1/CP.16: The Cancun Agreements: Outcome of the work of the Ad Hoc Working Group on Long-term Cooperative Action under the Convention (English): Paragraph 4" (PDF). UNFCCC Secretariat: Bonn, Germany: United Nations Framework Convention on Climate Change. 2011: 3. "(...) deep cuts in global greenhouse gas emissions are required according to science, and as documented in the Fourth Assessment Report of the Intergovernmental Panel on Climate Change, with a view to reducing global greenhouse gas emissions so as to hold the increase in global average temperature below 2 °C above preindustrial levels"
- ↑
America's Climate Choices. Washington, DC: The National Academies Press. 2011. p. 15. ISBN 978-0-309-14585-5.
The average temperature of the Earth's surface increased by about 1.4 °F (0.8 °C) over the past 100 years, with about 1.0 °F (0.6 °C) of this warming occurring over just the past three decades.
- ↑
- Sutter, John D.; Berlinger, Joshua (12 December 2015). "Final draft of climate deal formally accepted in Paris". CNN. Retrieved 12 December 2015.
- Vaughan, A. (12 December 2015). "Paris climate deal: key points at a glance". The Guardian. London and Manchester. Archived from the original on 13 December 2015. Retrieved 12 December 2015. . Archived .
- ↑ James Hansen; Makiko Sato; Gary Russell; Pushker Kharecha (September 2013). "Climate sensitivity, sea level and atmospheric carbon dioxide". Royal Society Publishing. 371 (2001): 20120294. arXiv:1211.4846. Bibcode:2013RSPTA.37120294H. doi:10.1098/rsta.2012.0294. PMC 3785813.
- 1 2 Steffen et al. (2018). "Trajectories of the Earth System in the Anthropocene". PNAS. doi:10.1073/pnas.1810141115.
- ↑ Stokes, Bruce; Wike, Richard; Carle, Jill (5 November 2015). "Global Concern about Climate Change, Broad Support for Limiting Emissions". Pew Research Center's Global Attitudes Project. Retrieved 7 August 2017.
- ↑ "Climate Change 2013: The Physical Science Basis, IPCC Fifth Assessment Report (WGI AR5)" (PDF). WGI AR5. IPCC AR5. 2013. p. 5.
- ↑ "Climate Change 2007: Working Group I: The Physical Science Basis". IPCC AR4. 2007.
- ↑ Rhein, M.; Rintoul, S.R. (2013). "3: Observations: Ocean" (PDF). IPCC WGI AR5 (Report). p. 257.
Ocean warming dominates the global energy change inventory. Warming of the ocean accounts for about 93% of the increase in the Earth's energy inventory between 1971 and 2010 (high confidence), with warming of the upper (0 to 700 m) ocean accounting for about 64% of the total. Melting ice (including Arctic sea ice, ice sheets and glaciers) and warming of the continents and atmosphere account for the remainder of the change in energy.
- ↑ "UAH v6.0 TLT data" (trend data at bottom of file). National Space Science and Technology Center. Retrieved 3 February 2017.
- ↑ "Upper Air Temperature: Decadal Trends". Remote Sensing Systems. Retrieved 3 February 2017.
- ↑ Jansen et al., Ch. 6, Palaeoclimate, Section 6.6.1.1: What Do Reconstructions Based on Palaeoclimatic Proxies Show?, pp. 466–78 Archived 24 May 2010 at the Wayback Machine., in IPCC AR4 WG1 2007.
- 1 2 3 4 Kennedy, J.J.; et al. (2010). "How do we know the world has warmed? in: 2. Global Climate, in: State of the Climate in 2009". Bull. Amer. Meteor. Soc. 91 (7): 26.
- ↑ Kennedy, C. (10 July 2012). "ClimateWatch Magazine >> State of the Climate: 2011 Global Sea Level". NOAA Climate Services Portal.
- ↑ "Summary for Policymakers". Direct Observations of Recent Climate Change. , in IPCC AR4 WG1 2007
- ↑ "Summary for Policymakers". B. Current knowledge about observed impacts of climate change on the natural and human environment. , in IPCC AR4 WG2 2007
- ↑ Rosenzweig, C.; et al. "Ch 1: Assessment of Observed Changes and Responses in Natural and Managed Systems". Sec 1.3.5.1 Changes in phenology. , in IPCC AR4 WG2 2007, p. 99
- ↑ Leavenworth, Stuart (15 February 2018). "Snow-covered beaches? Chilly iguanas? They are part of a mysterious 'hole' in global warming". McClatchy Washington Bureau.
- ↑ Trenberth et al., Chap 3, Observations: Atmospheric Surface and Climate Change, Executive Summary, p. 237, in IPCC AR4 WG1 2007.
- ↑ Sutton, Rowan T.; Dong, Buwen; Gregory, Jonathan M. (16 January 2007). "Land/sea warming ratio in response to climate change: IPCC AR4 model results and comparison with observations". Geophysical Research Letters. 34 (2): L02701. Bibcode:2007GeoRL..3402701S. doi:10.1029/2006GL028164. Retrieved 19 September 2007.
- ↑ Feulner, Georg; Rahmstorf, Stefan; Levermann, Anders; Volkwardt, Silvia (March 2013). "On the Origin of the Surface Air Temperature Difference Between the Hemispheres in Earth's Present-Day Climate". Journal of Climate. 26: 130325101629005. Bibcode:2013JCli...26.7136F. doi:10.1175/JCLI-D-12-00636.1. Retrieved 25 April 2013.
- ↑ TS.3.1.2 Spatial Distribution of Changes in Temperature, Circulation and Related Variables – AR4 WGI Technical Summary
- ↑ Ehhalt et al., Chapter 4: Atmospheric Chemistry and Greenhouse Gases, Archived 23 January 2012 at the Wayback Machine. Section 4.2.3.1: Carbon monoxide (CO) and hydrogen (H2), Archived 9 April 2012 at the Wayback Machine. p. 256, Archived 17 January 2012 at the Wayback Machine. in IPCC TAR WG1 2001.
- ↑ Meehl, Gerald A.; Washington, Warren M.; Collins, William D.; Arblaster, Julie M.; Hu, Aixue; Buja, Lawrence E.; Strand, Warren G.; Teng, Haiyan (18 March 2005). "How Much More Global Warming and Sea Level Rise" (PDF). Science. 307 (5716): 1769–72. Bibcode:2005Sci...307.1769M. doi:10.1126/science.1106663. PMID 15774757. Retrieved 11 February 2007.
- ↑ Wigley, T. M. L.; et al. (2005). "The Climate Change Commitment" (PDF). School of Ocean and Earth Science and Technology, University of Hawaii at Manoa. Bibcode:2005Sci...307.1766W. doi:10.1126/science.1103934.
Even if atmospheric composition were fixed today, global mean temperature and sea level rise would continue due to oceanic thermal inertia. These constant-composition (CC) commitments and their uncertainties are quantified. Constant-emissions (CE) commitments are also considered. The CC warming commitment could exceed 1C. The CE warming commitment is 2 to 6C by the year 2400." (...) "A breakdown of the natural and anthropogenic components of the CC commitment, together with uncertainties arising from ocean mixing (Kz) uncertainties, is given in table S1. Past natural forcing (inclusion of which is the default case here) has a marked effect. The natural forcing component is surprisingly large, 64% of the total commitment in 2050, reducing to 52% by 2400.
- ↑ Florian Sévellec & Sybren S. Drijfhout (2018). "A novel probabilistic forecast system predicting anomalously warm 2018-2022 reinforcing the long-term global warming trend". Nature Communications. doi:10.1038/s41467-018-05442-8.
- ↑ "The next five years will be 'anomalously warm,' scientists predict". The Washington Post. 2018.
- ↑ England, Matthew H.; McGregor, Shayne; Spence, Paul; Meehl, Gerald A.; Timmermann, Axel; Cai, Wenju; Sen Gupta, Alex; McPhaden, Michael J.; Purich, Ariaan; Santoso, Agus (9 February 2014). "Recent intensification of wind-driven circulation in the Pacific and the ongoing warming hiatus". Nature Climate Change. 4: 222–27. Bibcode:2014NatCC...4..222E. doi:10.1038/nclimate2106.
- ↑ Knight, J.; Kenney, J.J.; Folland, C.; Harris, G.; Jones, G.S.; Palmer, M.; Parker, D.; Scaife, A.; Stott, P. (August 2009). "Do Global Temperature Trends Over the Last Decade Falsify Climate Predictions? [in "State of the Climate in 2008"]" (PDF). Bull. Amer. Meteor. Soc. 90 (8): S75–79. Retrieved 13 August 2011.
- ↑ Global temperature slowdown – not an end to climate change. UK Met Office. Archived from the original on 9 December 2010. Retrieved 20 March 2011.
- ↑ Schmidt, Gavin (4 June 2015). "NOAA temperature record updates and the 'hiatus'". RealClimate.
- ↑ "Science publishes new NOAA analysis: Data show no recent slowdown in global warming". NOAA. 4 June 2015. Archived from the original on 27 March 2018.
- ↑ Mooney, Chris (18 January 2017). "U.S. scientists officially declare 2016 the hottest year on record. That makes three in a row". The Washington Post.
- ↑ Schmidt, Gavin (22 January 2015). "Thoughts on 2014 and ongoing temperature trends". RealClimate. Retrieved 4 September 2015.
- ↑ Group (28 November 2004). "Forcings (filed under: Glossary)". RealClimate.
- ↑ "Science Brief 1: The Causes of Global Climate Change" (PDF). Arlington, Virginia: Pew Center on Global Climate Change / Center for Climate and Energy Solutions. September 2006: 2. Archived from the original (PDF) on 25 October 2012.
- ↑ Brown, Patrick T.; Li, Wenhong; Jiang, Jonathan H.; Su, Hui (7 December 2015). "Unforced Surface Air Temperature Variability and Its Contrasting Relationship with the Anomalous TOA Energy Flux at Local and Global Spatial Scales". Journal of Climate. 29 (3): 925–40. Bibcode:2016JCli...29..925B. doi:10.1175/JCLI-D-15-0384.1. ISSN 0894-8755.
- ↑ US NRC 2012, p. 9
- 1 2 Hegerl et al., Chapter 9: Understanding and Attributing Climate Change, Section 9.4.1.5: The Influence of Other Anthropogenic and Natural Forcings, in IPCC AR4 WG1 2007, pp. 690–691. "Recent estimates indicate a relatively small combined effect of natural forcings on the global mean temperature evolution of the second half of the 20th century, with a small net cooling from the combined effects of solar and volcanic forcings." p. 690
- ↑ Tyndall, John (1 January 1861). "On the Absorption and Radiation of Heat by Gases and Vapours, and on the Physical Connection of Radiation, Absorption, and Conduction". Philosophical Magazine. 4. 22: 169–94, 273–85. Retrieved 8 May 2013.
- 1 2 Weart, Spencer (2008). "The Carbon Dioxide Greenhouse Effect". The Discovery of Global Warming. American Institute of Physics. Retrieved 21 April 2009.
- ↑ Molina, Francis (March 1912). "Remarkable Weather of 1911:The Effect of Combustion of Coal on Climate -- What Scientists Predict for the Future". Popular Mechanics. pp. 339–342. Retrieved 13 Oct 2018.
- ↑ "Coal Consumption Affecting Climate". The Braidwood Dispatch and Mining Journal (New South Wales). 17 July 1912. p. 4. Retrieved 13 Oct 2018.
- ↑ Callendar, G. S. (April 1938). "The artificial production of carbon dioxide and its influence on temperature". Quarterly Journal of the Royal Meteorological Society. 64 (275): 223–40. Bibcode:1938QJRMS..64..223C. doi:10.1002/qj.49706427503.
- ↑ The Callendar Effect: the life and work of Guy Stewart Callendar (1898–1964) Amer Meteor Soc., Boston. ISBN 978-1-878220-76-9
- ↑ Le Treut; et al. "Chapter 1: Historical Overview of Climate Change Science". FAQ 1.1. , p. 97, in IPCC AR4 WG1 2007: "To emit 240 W m–2, a surface would have to have a temperature of around −19 °C. This is much colder than the conditions that actually exist at the Earth's surface (the global mean surface temperature is about 14 °C). Instead, the necessary −19 °C is found at an altitude about 5 km above the surface."
- ↑ Blue, Jessica. "What is the Natural Greenhouse Effect?". National Geographic. Archived from the original on 15 April 2016. Retrieved 1 January 2015.
- ↑ Kiehl, J.T.; Trenberth, Kevin E. (1997). "Earth's Annual Global Mean Energy Budget" (PDF). Bulletin of the American Meteorological Society. 78 (2): 197–208. Bibcode:1997BAMS...78..197K. doi:10.1175/1520-0477(1997)078<0197:EAGMEB>2.0.CO;2. ISSN 1520-0477. Archived from the original (PDF) on 24 June 2008. Retrieved 21 April 2009.
- ↑ Schmidt, Gavin (6 April 2005). "Water vapour: feedback or forcing?". RealClimate. Retrieved 21 April 2009.
- ↑ Russell, Randy (16 May 2007). "The Greenhouse Effect & Greenhouse Gases". University Corporation for Atmospheric Research Windows to the Universe. Retrieved 27 December 2009.
- ↑ EPA (2007). "Recent Climate Change: Atmosphere Changes". United States Environmental Protection Agency Climate Change Science Program. Archived from the original on 10 May 2009. Retrieved 21 April 2009.
- ↑ Spahni, Renato; Jérôme Chappellaz; Thomas F. Stocker; Laetitia Loulergue; Gregor Hausammann; Kenji Kawamura; Jacqueline Flückiger; Jakob Schwander; Dominique Raynaud; Valérie Masson-Delmotte; Jean Jouzel (November 2005). "Atmospheric Methane and Nitrous Oxide of the Late Pleistocene from Antarctic Ice Cores". Science. 310 (5752): 1317–21. Bibcode:2005Sci...310.1317S. doi:10.1126/science.1120132. PMID 16311333.
- ↑ Siegenthaler, Urs; et al. (November 2005). "Stable Carbon Cycle–Climate Relationship During the Late Pleistocene" (PDF). Science. 310 (5752): 1313–17. Bibcode:2005Sci...310.1313S. doi:10.1126/science.1120130. PMID 16311332. Retrieved 25 August 2010.
- ↑ Petit, J. R.; et al. (3 June 1999). "Climate and atmospheric history of the past 420,000 years from the Vostok ice core, Antarctica" (PDF). Nature. 399 (6735): 429–36. Bibcode:1999Natur.399..429P. doi:10.1038/20859. Archived (PDF) from the original on 17 November 2017. Retrieved 27 December 2009.
- ↑ Lüthi, Dieter; Le Floch, Martine; Bereiter, Bernhard; Blunier, Thomas; Barnola, Jean-Marc; Siegenthaler, Urs; Raynaud, Dominique; Jouzel, Jean; Fischer, Hubertus; Kawamura, Kenji; Stocker, Thomas F. (15 May 2008). "High-resolution carbon dioxide concentration record 650,000–800,000 years before present". Nature. 453 (7193): 379–382. Bibcode:2008Natur.453..379L. doi:10.1038/nature06949. PMID 18480821.
- ↑ Pearson, Paul Nicholas; Palmer, Martin R. (17 August 2000). "Atmospheric carbon dioxide concentrations over the past 60 million years". Nature. 406 (6797): 695–99. doi:10.1038/35021000. PMID 10963587.
- ↑ IPCC, Summary for Policymakers Archived 7 March 2016 at the Wayback Machine., Concentrations of atmospheric greenhouse gases ... Archived 18 January 2004 at the Wayback Machine., p. 7, in IPCC TAR WG1 2001.
- ↑ IPCC (2007) AR4. Climate Change 2007: Working Group III: Mitigation of Climate Change, section 7.4.5.1. https://www.ipcc.ch/publications_and_data/ar4/wg3/en/ch7s7-4-5.html
- ↑ Le Quéré, C.; Andres, R.J.; Boden, T.; Conway, T.; Houghton, R. A.; House, J. I.; Marland, G.; Peters, G. P.; van der Werf, G.; Ahlström, A.; Andrew, R. M.; Bopp, L.; Canadell, J. G.; Ciais, P.; Doney, S. C.; Enright, C.; Friedlingstein, P.; Huntingford, C.; Jain, A. K.; Jourdain, C.; Kato, E.; Keeling, R.F.; Klein Goldewijk, K.; Levis, S.; Levy, P.; Lomas, M.; Poulter, B.; Raupach, M.R.; Schwinger, J.; Sitch, S.; Stocker, B. D.; Viovy, N.; Zaehle, S.; Zeng, N. (2 December 2012). "The global carbon budget 1959–2011". Earth System Science Data Discussions. 5 (2): 1107–1157. Bibcode:2012ESSDD...5.1107L. doi:10.5194/essdd-5-1107-2012.
- ↑ Amos, Jonathan (10 May 2013). "Carbon dioxide passes symbolic mark". BBC. Retrieved 27 May 2013.
- ↑ Clark, Pilita (10 May 2013). "CO2 at highest level for millions of years". Financial Times. Retrieved 27 May 2013. (Subscription required (help)).
- ↑ Schiermeier, Quirin (7 July 2015). "Climate scientists discuss future of their field". Nature.
- ↑ Buis, Alan; Ramsayer, Kate; Rasmussen, Carol (12 November 2015). "A Breathing Planet, Off Balance". NASA. Retrieved 13 November 2015.
- ↑ Rogner, H.-H., et al., Chap. 1, Introduction, Section 1.3.1.2: Intensities, in IPCC AR4 WG3 2007.
- 1 2 NRC (2008). "Understanding and Responding to Climate Change" (PDF). Board on Atmospheric Sciences and Climate, US National Academy of Sciences. p. 2. Archived (PDF) from the original on 11 October 2017. Retrieved 9 November 2010.
- ↑ World Development Report 2010: Development and Climate Change. The International Bank for Reconstruction and Development / The World Bank, 1818 H Street NW, Washington, DC. 2010. doi:10.1596/978-0-8213-7987-5. ISBN 978-0-8213-7987-5. Archived from the original on 5 March 2010. Retrieved 6 April 2010.
- ↑ Banuri et al., Chapter 3: Equity and Social Considerations, Section 3.3.3: Patterns of greenhouse gas emissions, and Box 3.1, pp. 92–93 in IPCC SAR WG3 1996.
- 1 2 3 Liverman, Diana M. (April 2009). "Conventions of climate change: constructions of danger and the dispossession of the atmosphere" (PDF). Journal of Historical Geography. 35 (2): 279–96. doi:10.1016/j.jhg.2008.08.008. Retrieved 10 May 2011.
- ↑ Fisher et al., Chapter 3: Issues related to mitigation in the long-term context, Section 3.1: Emissions scenarios: Issues related to mitigation in the long term context in IPCC AR4 WG3 2007.
- ↑ Morita, Chapter 2: Greenhouse Gas Emission Mitigation Scenarios and Implications, Section 2.5.1.4: Emissions and Other Results of the SRES Scenarios, in IPCC TAR WG3 2001.
- ↑ Rogner et al., Ch. 1: Introduction, Figure 1.7, in IPCC AR4 WG3 2007.
- ↑ IPCC, Summary for Policymakers, Introduction, paragraph 6, in IPCC TAR WG3 2001.
- ↑ Prentence et al., Chapter 3: The Carbon Cycle and Atmospheric Carbon Dioxide Executive Summary Archived 7 December 2009 at the Wayback Machine., in IPCC TAR WG1 2001.
- ↑ Solomon, S.; D. Qin; M. Manning; Z. Chen; M. Marquis; K.B. Averyt; M. Tignor; H.L. Miller, eds. (2007). "3.4.4.2 Surface Radiation". Climate Change 2007: Working Group I: The Physical Science Basis. ISBN 978-0-521-88009-1.
- ↑ Hansen, James; Sato, Makiko; Ruedy, Reto; Lacis, Andrew; Oinas, Valdar (29 August 2000). "Global warming in the twenty-first century: An alternative scenario". Proc. Natl. Acad. Sci. USA. 97 (18): 9875–80. Bibcode:2000PNAS...97.9875H. doi:10.1073/pnas.170278997. PMC 27611. PMID 10944197.
- ↑ Ramanathan, V.; Carmichael, G. (2008). "Global and Regional Climate Changes due to Black Carbon". Nature Geoscience. 1 (4): 221–27. Bibcode:2008NatGe...1..221R. doi:10.1038/ngeo156.
- ↑ Statement made by Mark Jacobson of the Atmosphere / Energy Program at Stanford University in the documentary "Sea Blind"
- ↑ Sea Blind
- ↑ V. Ramanathan and G. Carmichael, supra note 1, at 221 (". . . emissions of black carbon are the second strongest contribution to current global warming, after carbon dioxide emissions.") Numerous scientists also calculate that black carbon may be second only to CO2 in its contribution to climate change, including Tami C. Bond & Haolin Sun, Can Reducing Black Carbon Emissions Counteract Global Warming, Environmental Science & Technology (2005), at 5921 ("BC is the second or third largest individual warming agent, following carbon dioxide and methane."); and J. Hansen, A Brighter Future, 53 Climate Change 435 (2002), available at http://pubs.giss.nasa.gov/docs/2002/2002_Hansen_1.pdf (calculating the climate forcing of BC at 1.0±0.5 W/m2).
- ↑ Twomey, S. (1 July 1977). "The Influence of Pollution on the Shortwave Albedo of Clouds". J. Atmos. Sci. 34 (7): 1149–52. Bibcode:1977JAtS...34.1149T. doi:10.1175/1520-0469(1977)034<1149:TIOPOT>2.0.CO;2. ISSN 1520-0469.
- ↑ Albrecht, Bruce A. (15 September 1989). "Aerosols, Cloud Microphysics, and Fractional Cloudiness". Science. 245 (4923): 1227–39. Bibcode:1989Sci...245.1227A. doi:10.1126/science.245.4923.1227. PMID 17747885.
- ↑ IPCC, "Aerosols, their Direct and Indirect Effects", pp. 291–92 in IPCC TAR WG1 2001.
- ↑ Ramanathan, V.; Chung, C.; Kim, D.; Bettge, T.; Buja, L.; Kiehl, J. T.; Washington, W. M.; Fu, Q.; Sikka, D. R.; Wild, M. (2005). "Atmospheric brown clouds: Impacts on South Asian climate and hydrological cycle" (Full free text). Proceedings of the National Academy of Sciences. 102 (15): 5326–33. Bibcode:2005PNAS..102.5326R. doi:10.1073/pnas.0500656102. PMC 552786. PMID 15749818.
- ↑ Ramanathan, V.; et al. (2008). "Report Summary" (PDF). Atmospheric Brown Clouds: Regional Assessment Report with Focus on Asia. United Nations Environment Programme. Archived from the original (PDF) on 18 July 2011.
- ↑ Ramanathan, V.; et al. (2008). "Part III: Global and Future Implications" (PDF). Atmospheric Brown Clouds: Regional Assessment Report with Focus on Asia. United Nations Environment Programme. Archived from the original (PDF) on 18 July 2011.
- 1 2 IPCC, Summary for Policymakers, Human and Natural Drivers of Climate Change, Figure SPM.2, in IPCC AR4 WG1 2007.
- ↑ "3.2.2 Solar Irradiance". Volume 3: Attribution of Observed Climate Change. Endangerment and Cause or Contribute Findings for Greenhouse Gases under Section 202(a) of the Clean Air Act. EPA's Response to Public Comments. US Environmental Protection Agency. 2009. Archived from the original on 16 June 2011. Retrieved 23 June 2011.
- ↑ US NRC 2008, p. 6
- ↑ Hegerl, et al., Chapter 9: Understanding and Attributing Climate Change, Frequently Asked Question 9.2: Can the Warming of the 20th century be Explained by Natural Variability?, in IPCC AR4 WG1 2007.
- ↑ Simmon, R.; D. Herring (November 2009). "Notes for slide number 7, titled "Satellite evidence also suggests greenhouse gas warming", in presentation, "Human contributions to global climate change"". U.S. National Oceanic and Atmospheric Administration's Climate Services. Archived from the original on 3 July 2011. Retrieved 23 June 2011.
- ↑ Hegerl et al., Chapter 9: Understanding and Attributing Climate Change, Frequently Asked Question 9.2: Can the Warming of the 20th century be Explained by Natural Variability?, in IPCC AR4 WG1 2007.
- ↑ Randel, William J.; Shine, Keith P.; Austin, John; et al. (2009). "An update of observed stratospheric temperature trends". Journal of Geophysical Research. 114 (D2): D02107. Bibcode:2009JGRD..11402107R. doi:10.1029/2008JD010421.
- ↑ USGCRP 2009, p. 20
- ↑ R.S. Bradley; K.R. Briffa; J. Cole; M.K. Hughes; T.J. Osborn (2003). "The climate of the last millennium". In K.D. Alverson; R.S. Bradley; T.F. Pederson. Paleoclimate, global change and the future. Springer. pp. 105–41. ISBN 3-540-42402-4.
- ↑ Kaufman, D. S.; Schneider, D. P.; McKay, N. P.; Ammann, C. M.; Bradley, R. S.; Briffa, K. R.; Miller, G. H.; Otto-Bliesner, B. L.; Overpeck, J. T.; Vinther, B. M.; Abbott, M.; Axford, M.; Bird, Y.; Birks, B.; Bjune, H. J. B.; Briner, A. E.; Cook, J.; Chipman, T.; Francus, M.; Gajewski, P.; Geirsdottir, K.; Hu, A.; Kutchko, F. S.; Lamoureux, B.; Loso, S.; MacDonald, M.; Peros, G.; Porinchu, M.; Schiff, D.; Seppa, C.; Seppa, H.; Arctic Lakes 2k Project Members (2009). "Recent Warming Reverses Long-Term Arctic Cooling". Science. 325 (5945): 1236–39. Bibcode:2009Sci...325.1236K. doi:10.1126/science.1173983. PMID 19729653.
- ↑ "Arctic Warming Overtakes 2,000 Years of Natural Cooling". UCAR. 3 September 2009. Archived from the original on 27 April 2011. Retrieved 8 June 2011.
- ↑ Bello, David (4 September 2009). "Global Warming Reverses Long-Term Arctic Cooling". Scientific American. Retrieved 8 June 2011.
- ↑ Mann, Michael E.; Zhang, Zhihua; Hughes, Malcolm K.; Bradley, Raymond S.; Miller, Sonya K.; Rutherford, Scott; Ni, Fenbiao (9 September 2008). "Proxy-based reconstructions of hemispheric and global surface temperature variations over the past two millennia". Proceedings of the National Academy of Sciences. 105 (36): 13252–57. Bibcode:2008PNAS..10513252M. doi:10.1073/pnas.0805721105. PMC 2527990. PMID 18765811.
- ↑ Berger, André; Loutre, Marie-France (23 August 2002). "CLIMATE: An Exceptionally Long Interglacial Ahead?". Science. 297 (5585): 1287–88. doi:10.1126/science.1076120. PMID 12193773.
- ↑ Masson-Delmotte V. M.; et al. (2013). "Information from paleoclimate archives". In Stocker, T.F.; et al. Climate Change 2013: The Physical Science Basis. Contribution of Working Group I to the Fifth Assessment Report of the Intergovernmental Panel on Climate Change. Cambridge University Press. pp. 383–464. ISBN 978-1-107-66182-0.
- ↑ "Thermodynamics: Albedo". NSIDC.
- 1 2 Jackson, R.; A. Jenkins (17 November 2012). "Vital signs of the planet: global climate change and global warming: uncertainties". Earth Science Communications Team at NASA's Jet Propulsion Laboratory / California Institute of Technology.
- ↑ Rockström et al. (2009). "Planetary Boundaries: Exploring the Safe Operating Space for Humanity".
- ↑ Riebeek, H. (16 June 2011). "The Carbon Cycle: Feature Articles: Effects of Changing the Carbon Cycle". Earth Observatory, part of the EOS Project Science Office located at NASA Goddard Space Flight Center.
- ↑ US National Research Council (2003). "Ch. 1 Introduction". Understanding Climate Change Feedbacks. Washington, DC: National Academies Press. p. 19.
- ↑ Lindsey, R. (14 January 2009). "Earth's Energy Budget, in: Climate and Earth's Energy Budget: Feature Articles". Earth Observatory, part of the EOS Project Science Office, located at NASA Goddard Space Flight Center: 4.
- ↑ US National Research Council (2006). "Ch. 1 Introduction to Technical Chapters". Surface Temperature Reconstructions for the Last 2,000 Years. Washington, DC: National Academies Press. pp. 26–27.
- ↑ AMS Council (20 August 2012). "2012 American Meteorological Society (AMS) Information Statement on Climate Change". Boston, Massachusetts.
- ↑ "Climate Change 2014: Synthesis Report. Summary for Policymakers" (PDF). Intergovernmental Panel on Climate Change. Retrieved 1 November 2015.
The following terms have been used to indicate the assessed likelihood of an outcome or a result: virtually certain 99–100% probability, very likely 90–100%, likely 66–100%, about as likely as not 33–66%, unlikely 0–33%, very unlikely 0–10%, exceptionally unlikely 0–1%. Additional terms (extremely likely: 95–100%, more likely than not >50–100%, more unlikely than likely 0–<50% and extremely unlikely 0–5%) may also be used when appropriate.
- 1 2 3 4 Meehl, G. A.; et al. "Ch 10: Global Climate Projections". Sec 10.5.4.6 Synthesis of Projected Global Temperature at Year 2100]. , in IPCC AR4 WG1 2007
- ↑ Mooney, Chris (5 October 2017). "One of the oldest climate change experiments has led to a troubling conclusion". The Washington Post.
- ↑ Melillo, J.M.; Frey, S.D.; DeAngelis, K.M.; Werner, W.J.; Bernard, M.J.; Bowles, F.P.; Pold, G.; Knorr, M.A.; Grandy, A.S. (6 October 2017). "Long-term pattern and magnitude of soil carbon feedback to the climate system in a warming world". Science. Bibcode:2017Sci...358..101M. doi:10.1126/science.aan2874.
- ↑ "Concerns about climate change, health". Harvard University. 2012.
- ↑ Watts, Jonathan (2018-08-07). "Domino-effect of climate events could push Earth into a 'hothouse' state". The Guardian. Retrieved 2018-08-08.
- ↑ Sheridan, Kerry (2018-08-06). "Earth risks tipping into 'hothouse' state: study". Phys.org. Retrieved 2018-08-08.
- ↑ TS.3.1.2 Spatial Distribution of Changes in Temperature, Circulation and Related Variables – AR4 WGI Technical Summary
- ↑ Alexeev V. A., Langen P. L., Bates J. R. (2005). "Polar amplification of surface warming on an aquaplanet in "ghost forcing" experiments without sea ice feedbacks". Climate Dynamics. 24 (7–8): 655–666. Bibcode:2005ClDy...24..655A. doi:10.1007/s00382-005-0018-3.
- ↑ "IPCC AR5 – Near-term Climate Change: Projections and Predictability (Chapter 11 / page 983 )" (PDF). 2013.
- ↑ "Arctic amplification". NASA. 2013.
- ↑ Francis Jennifer A (2012). "Evidence linking Arctic amplification to extreme weather in mid-latitudes". Geophysical Research Letters. 39. Bibcode:2012GeoRL..39.6801F. doi:10.1029/2012GL051000.
- ↑ Vladimir Petoukhov & Vladimir A. Semenov (November 2010). "A link between reduced Barents-Kara sea ice and cold winter extremes over northern continents". Journal of Geophysical Research: Atmospheres. 115 (21). Bibcode:2010JGRD..11521111P. doi:10.1029/2009JD013568.
- ↑ J A Screen (November 2013). "Influence of Arctic sea ice on European summer precipitation". Environmental Research Letters. 8 (4): 044015. Bibcode:2013ERL.....8d4015S. doi:10.1088/1748-9326/8/4/044015.
- ↑ Qiuhong Tang, Xuejun Zhang and Jennifer A. Francis (December 2013). "Extreme summer weather in northern mid-latitudes linked to a vanishing cryosphere". Nature Climate Change. 4: 45–50. Bibcode:2014NatCC...4...45T. doi:10.1038/nclimate2065.
- ↑ Francis, J. A.; Vavrus, S. J. (2012). "Evidence linking Arctic amplification to extreme weather in mid-latitudes". Geophysical Research Letters. 39 (6). Bibcode:2012GeoRL..39.6801F. doi:10.1029/2012GL051000.
- 1 2 Watts, Jonathan (2018-08-20). "Summer weather is getting 'stuck' due to Arctic warming". The Guardian. Retrieved 2018-08-20.
- ↑ Mann, Michael E.; Rahmstorf, Stefan (27 March 2017). "Influence of Anthropogenic Climate Change on Planetary Wave Resonance and Extreme Weather Events". Scientific Reports. Springer Nature. 7. Bibcode:2017NatSR...745242M. doi:10.1038/srep45242. Retrieved 9 April 2017.
- ↑ "Extreme global weather is 'the face of climate change' says leading scientist". The Guardian. 2018.
- ↑ "Patterns of greenhouse warming" (PDF). GFDL Climate Modeling Research Highlights. Princeton, New Jersey: The National Oceanic and Atmospheric Administration (NOAA) Geophysical Fluid Dynamics Laboratory (GFDL). 1 (6). January 2007. , revision 2 February 2007, 8:50.08 AM.
- ↑ "NOAA GFDL Climate Research Highlights Image Gallery: Patterns of Greenhouse Warming". NOAA Geophysical Fluid Dynamics Laboratory (GFDL). 9 October 2012.
- ↑ IPCC, Glossary A–D: "Climate Model", in IPCC AR4 SYR 2007.
- ↑ Karl, TR; et al., eds. (2009). "Global Climate Change". Global Climate Change Impacts in the United States. Cambridge University Press. ISBN 978-0-521-14407-0. Archived from the original on 15 September 2012.
- ↑ Schaefer, Kevin; Zhang, Tingjun; Bruhwiler, Lori; Barrett, Andrew P. (24 January 2011). "Amount and timing of permafrost carbon release in response to climate warming". Tellus Series B. 63 (2): 165–80. Bibcode:2011TellB..63..165S. doi:10.1111/j.1600-0889.2011.00527.x.
- ↑ Hansen, James (2000). "Climatic Change: Understanding Global Warming". In Lanza, Robert. One World: The Health & Survival of the Human Species in the 21st century. Health Press (New Mexico). pp. 173–90. ISBN 0-929173-33-3. Retrieved 18 August 2007.
- ↑ Stocker et al., Chapter 7: Physical Climate Processes and Feedbacks, Section 7.2.2: Cloud Processes and Feedbacks, in IPCC TAR WG1 2001.
- ↑ Torn, Margaret; Harte, John (26 May 2006). "Missing feedbacks, asymmetric uncertainties, and the underestimation of future warming" (PDF). Geophysical Research Letters. 33 (10): L10703. Bibcode:2006GeoRL..3310703T. doi:10.1029/2005GL025540. Retrieved 4 March 2007.
- ↑ Harte, John; Saleska, Scott; Shih, Tiffany (30 October 2006). "Shifts in plant dominance control carbon-cycle responses to experimental warming and widespread drought". Environmental Research Letters. 1 (1): 014001. Bibcode:2006ERL.....1a4001H. doi:10.1088/1748-9326/1/1/014001. Retrieved 2 May 2007.
- ↑ Scheffer, Marten; Brovkin, Victor; Cox, Peter (26 May 2006). "Positive feedback between global warming and atmospheric CO2 concentration inferred from past climate change" (PDF). Geophysical Research Letters. 33 (10): L10702. Bibcode:2006GeoRL..3310702S. doi:10.1029/2005gl025044. Retrieved 4 May 2007.
- ↑ Randall et al., Chapter 8, Climate Models and Their Evaluation, Sec. FAQ 8.1 in IPCC AR4 WG1 2007.
- ↑ IPCC, Technical Summary, p. 54, in IPCC TAR WG1 2001.
- ↑ Stroeve, J.; et al. (2007). "Arctic sea ice decline: Faster than forecast". Geophysical Research Letters. 34 (9): L09501. Bibcode:2007GeoRL..3409501S. doi:10.1029/2007GL029703.
- ↑ Wentz, F. J.; et al. (2007). "How Much More Rain Will Global Warming Bring?". Science. 317 (5835): 233–35. Bibcode:2007Sci...317..233W. doi:10.1126/science.1140746. PMID 17540863.
- ↑ Liepert, Beate G.; Previdi, Michael (2009). "Do Models and Observations Disagree on the Rainfall Response to Global Warming?". Journal of Climate. 22 (11): 3156–66. Bibcode:2009JCli...22.3156L. doi:10.1175/2008JCLI2472.1.
Recently analyzed satellite-derived global precipitation datasets from 1987 to 2006 indicate an increase in global-mean precipitation of 1.1%–1.4% decade−1. This trend corresponds to a hydrological sensitivity (HS) of 7% K−1 of global warming, which is close to the Clausius–Clapeyron (CC) rate expected from the increase in saturation water vapor pressure with temperature. Analysis of two available global ocean evaporation datasets confirms this observed intensification of the atmospheric water cycle. The observed hydrological sensitivity over the past 20-yr period is higher by a factor of 5 than the average HS of 1.4% K−1 simulated in state-of-the-art coupled atmosphere–ocean climate models for the twentieth and twenty-first centuries.
- ↑ Rahmstorf, Stefan; Cazenave, Anny; Church, John A.; Hansen, James E.; Keeling, Ralph F.; Parker, David E.; Somerville, Richard C. J. (4 May 2007). "Recent Climate Observations Compared to Projections". Science. 316 (5825): 709. Bibcode:2007Sci...316..709R. doi:10.1126/science.1136843. PMID 17272686.
- ↑ "Chapter 15: Potential Surprises: Compound Extremes and Tipping Elements". US National Climate Assessment. 2017.
- ↑ 4. Global Mean Sea Level Rise Scenarios, in: Main Report, in Parris & others 2012, p. 12
- ↑ Executive Summary, in Parris & others 2012, p. 1
- ↑ Schneider et al., Chapter 19: Assessing Key Vulnerabilities and the Risk from Climate Change, Section 19.3.4: Ecosystems and biodiversity, in IPCC AR4 WG2 2007.
- ↑ "Climate change linked to potential population decline in bees". ScienceDaily. 2018.
- ↑ "Carbon dioxide is 'driving fish crazy'". ScienceDaily. 2012.
- ↑ "Global Warming and Polar Bears - National Wildlife Federation". Retrieved 16 October 2017.
As climate change melts sea ice, the U.S. Geological Survey projects that two thirds of polar bears will disappear by 2050.
- ↑ Amstrup, S. C.; Marcot, B. G.; Douglas, D. C. (2013). "A Bayesian Network Modeling Approach to Forecasting the 21st Century Worldwide Status of Polar Bears" (PDF). Arctic Sea Ice Decline: Observations, Projections, Mechanisms, and Implications. Geophysical Monograph Series 180. pp. 213–268). doi:10.1029/180GM14.
- ↑ Zhang, Jinlun (11 June 2008). "What drove the dramatic arctic sea ice retreat during summer 2007?". Geophysical Research Letters. 35: 1–5. Bibcode:2008GeoRL..3511505Z. doi:10.1029/2008gl034005.
- ↑ Meehl, G.A.; et al. "Ch 10: Global Climate Projections". Sec 10.3.3.1 Changes in Sea Ice Cover. , in IPCC AR4 WG1 2007, p. 770
- ↑ Wang, M.; Overland, J. E. (2009). "A sea ice free summer Arctic within 30 years?". Geophys. Res. Lett. 36 (7). Bibcode:2009GeoRL..36.7502W. doi:10.1029/2009GL037820. Retrieved 2 May 2011.
- ↑ "Arctic sea ice 2012". Exeter, UK: Met Office.
- ↑ Watson, Christopher S.; White, Neil J.; Church, John A.; King, Matt A.; Burgette, Reed J.; Legresy, Benoit (11 May 2015). "Unabated global mean sea-level rise over the satellite altimeter era". Nature Climate Change. 5: 565–68. Bibcode:2015NatCC...5..565W. doi:10.1038/nclimate2635.
- ↑ Churchs, John; Clark, Peter. "Chapter 13: Sea Level Change – Final Draft Underlying Scientific-Technical Assessment" (PDF). IPCC Working Group I. Retrieved 21 January 2015.
- ↑ Bell, Brian (31 August 2015). "UCI study finds dramatic increase in concurrent droughts, heat waves". University of California, Irvine.
- ↑ Ogburn, Stephanie Paige (29 April 2014). "Indian Monsoons Are Becoming More Extreme". Scientific American.
- ↑ "D. Future Climate Extremes, Impacts, and Disaster Losses, in: Summary for policymakers". Managing the Risks of Extreme Events and Disasters to Advance Climate Change Adaptation. , in IPCC SREX 2012, pp. 9–13
- ↑ IPCC, Synthesis Report Summary for Policymakers, Section 1: Observed changes in climate and their effects, in IPCC AR4 SYR 2007.
- ↑ Fischlin, et al., Chapter 4: Ecosystems, their Properties, Goods and Services, Executive Summary, p. 213, in IPCC AR4 WG2 2007. Executive summary not present in on-line text; see pdf.
- 1 2 3 Ocean Acidification, in: Ch. 2. Our Changing Climate, in NCADAC 2013, pp. 69–70
- ↑ Deutsch; et al. (2011). "Climate-Forced Variability of Ocean Hypoxia". Science. 333: 336–39. Bibcode:2011Sci...333..336D. doi:10.1126/science.1202422. PMID 21659566.
- ↑
- UNEP 2010
- 5. Ocean acidification, in Good & others 2010, pp. 73–81
- IAP 2009
- ↑ Sarah Kaplan (2018). "Climate change could render many of Earth's ecosystems unrecognizable". The Washington Post.
- 1 2
- Summary, pp. 14–19, in National Research Council 2011
- FAQ 12.3, in: Chapter 12: Long-term Climate Change: Projections, Commitments and Irreversibility, in IPCC AR5 WG1 2013, pp. 88–89 (pp. 90–91 of PDF chapter)
- ↑ Bill McGuire (2010). "Climate forcing of geological and geomorphological hazards". Philosophical Transactions of the Royal Society A. Royal Society. 368: 2311–15. Bibcode:2010RSPTA.368.2311M. doi:10.1098/rsta.2010.0077.
- ↑ Smith, J. B.; et al. "Ch. 19. Vulnerability to Climate Change and Reasons for Concern: A Synthesis". Sec 19.6. Extreme and Irreversible Effects. , in IPCC TAR WG2 2001
- ↑ Smith, Joel B.; Schneider, Stephen H.; Oppenheimer, Michael; Yohe, Gary W.; Hare, William; Mastrandrea, Michael D.; Patwardhan, Anand; Burton, Ian; Corfee-Morlot, Jan; Magadza, Chris H. D.; Füssel, Hans-Martin; Pittock, A. Barrie; Rahman, Atiq; Suarez, Avelino; van Ypersele, Jean-Pascal (17 March 2009). "Assessing dangerous climate change through an update of the Intergovernmental Panel on Climate Change (IPCC) 'reasons for concern'". Proceedings of the National Academy of Sciences. 106 (11): 4133–37. Bibcode:2009PNAS..106.4133S. doi:10.1073/pnas.0812355106. PMC 2648893. PMID 19251662.
- ↑ Clark, P. U.; et al. (December 2008). "Executive Summary". Abrupt Climate Change. A Report by the U.S. Climate Change Science Program and the Subcommittee on Global Change Research. Reston, Virginia: U.S. Geological Survey. , pp. 1–7. Report website Archived 4 May 2013 at the Wayback Machine.
- ↑ "Siberian permafrost thaw warning sparked by cave data". BBC. 22 February 2013. Retrieved 24 February 2013.
- ↑ "Shutdown Of Circulation Pattern Could Be Disastrous, Researchers Say". ScienceDaily. 20 December 2004. Archived from the original on 2005-01-13.
- ↑ Link, Peter Michael; Tol, Richard S.J. (September 2004). "Possible Economic Impacts of a Shutdown of the Thermohaline Circulation: an Application of FUND" (PDF). Portuguese Economic Journal (PDF). 3 (2): 99–114. doi:10.1007/s10258-004-0033-z.
- ↑ "Weather Facts: North Atlantic Drift (Gulf Stream)". Weather Online UK.
- ↑ Bischof, Barbie; Mariano, Arthur J.; Ryan, Edward H. (2003). "Ocean Surface Currents: The North Atlantic Drift Current". Rosenstiel School of Marine and Atmospheric Science, University of Miami.
- ↑ FAQ 7 and 8, in: Volume-wide Frequently Asked Questions (FAQs) (archived 8 July 2014), pp. 2–3, in IPCC AR5 WG2 A 2014
- ↑ Oppenheimer, M., et al., Section 19.6.3: Updating Reasons for Concern, in: Chapter 19: Emergent risks and key vulnerabilities (archived 8 July 2014), pp. 39–46, in IPCC AR5 WG2 A 2014
- ↑ Field, C., et al., B-3: Regional Risks and Potential for Adaptation, in: Technical Summary (archived 8 July 2014), pp. 27–30, in IPCC AR5 WG2 A 2014
- ↑ Oppenheimer, M., et al., Section 19.6.3: Updating Reasons for Concern, in: Chapter 19: Emergent risks and key vulnerabilities (archived 8 July 2014), pp. 42–43, in IPCC AR5 WG2 A 2014
- ↑ Nuccitelli, Dana (26 January 2015). "Climate change could impact the poor much more than previously thought". The Guardian.
- ↑ IPCC AR4 SYR 2007. 3.3.3 Especially affected systems, sectors and regions. Synthesis report.
- ↑ Mimura, N.; et al. (2007). "Executive summary". In Parry, M.L.; et al. Chapter 16: Small Islands. Climate change 2007: impacts, adaptation and vulnerability: contribution of Working Group II to the fourth assessment report of the Intergovernmental Panel on Climate Change (IPCC). Cambridge University Press (CUP): Cambridge: Print version: CUP. This version: IPCC website. ISBN 0521880106. Retrieved 15 September 2011.
- ↑ Park, Susin (May 2011). "Climate Change and the Risk of Statelessness: The Situation of Low-lying Island States" (PDF). United Nations High Commissioner for Refugees. Archived from the original (PDF) on 2013-05-02. Retrieved 13 April 2012.
- ↑ Mooney, Chris (22 October 2014). "There's a surprisingly strong link between climate change and violence". The Washington Post.
- ↑ Hope, Chris; Schaefer, Kevin (21 September 2015). "Economic impacts of carbon dioxide and methane released from thawing permafrost". Nature. 6: 56–59. Bibcode:2016NatCC...6...56H. doi:10.1038/nclimate2807.
- ↑ Porter, J.R., et al., Executive summary, in: Chapter 7: Food security and food production systems (archived 8 July 2014), p. 3, in IPCC AR5 WG2 A 2014
- ↑ Reference temperature period converted from late-20th century to pre-industrial times (approximated in the source as 1850–1900).* Assessment Box SPM-1 (p. 14) and B-2. Sectoral Risks and Potential for Adaptation: Food security and food production systems (p. 18), in: Summary for Policymakers (archived 8 July 2014), in IPCC AR5 WG2 A 2014
- ↑ R. Porter, John; Xie, Liyong (2014). Fifth Assessment Report (AR5), WGII, Climate Change 2014: Impacts, Adaptation, and Vulnerability, Chapter 7: Food Security and Food Production Systems (PDF). Intergovermental Pannel on Climate Change. pp. 491–492. Retrieved 29 July 2018.
- 1 2 3 Cramer, Wolfgang, et al., Executive summary, in: Chapter 18: Detection and attribution of observed impacts (archived 8 July 2014), pp. 3–4, in IPCC AR5 WG2 A 2014
- ↑ Smith, K.R., et al., FAQ 11.2, in: Chapter 11: Human health: impacts, adaptation, and co-benefits (archived 8 July 2014), p. 37, in IPCC AR5 WG2 A 2014
- 1 2 Costello, Anthony; Abbas, Mustafa; Allen, Adriana; Ball, Sarah; Bell, Sarah; Bellamy, Richard; Friel, Sharon; Groce, Nora; Johnson, Anne; Kett, Maria; Lee, Maria; Levy, Caren; Maslin, Mark; McCoy, David; McGuire, Bill; Montgomery, Hugh; Napier, David; Pagel, Christina; Patel, Jinesh; de Oliveira, Jose Antonio Puppim; Redclift, Nanneke; Rees, Hannah; Rogger, Daniel; Scott, Joanne; Stephenson, Judith; Twigg, John; Wolff, Jonathan; Patterson, Craig (May 2009). "Managing the health effects of climate change". The Lancet. 373 (9676): 1693–733. doi:10.1016/S0140-6736(09)60935-1.
- 1 2 Watts, Nick; Adger, W Neil; Agnolucci, Paolo; Blackstock, Jason; Byass, Peter; Cai, Wenjia; Chaytor, Sarah; Colbourn, Tim; Collins, Mat; Cooper, Adam; Cox, Peter M; Depledge, Joanna; Drummond, Paul; Ekins, Paul; Galaz, Victor; Grace, Delia; Graham, Hilary; Grubb, Michael; Haines, Andy; Hamilton, Ian; Hunter, Alasdair; Jiang, Xujia; Li, Moxuan; Kelman, Ilan; Liang, Lu; Lott, Melissa; Lowe, Robert; Luo, Yong; Mace, Georgina; Maslin, Mark; Nilsson, Maria; Oreszczyn, Tadj; Pye, Steve; Quinn, Tara; Svensdotter, My; Venevsky, Sergey; Warner, Koko; Xu, Bing; Yang, Jun; Yin, Yongyuan; Yu, Chaoqing; Zhang, Qiang; Gong, Peng; Montgomery, Hugh; Costello, Anthony (November 2015). "Health and climate change: policy responses to protect public health". The Lancet. 386 (10006): 1861–914. doi:10.1016/S0140-6736(15)60854-6. PMID 26111439. Retrieved 4 January 2016.
- ↑ Smith, K.R., et al., Section 11.4: Direct Impacts of Climate and Weather on Health, in: Chapter 11: Human health: impacts, adaptation, and co-benefits (archived 8 July 2014), pp. 10–13, in IPCC AR5 WG2 A 2014
- ↑ Smith, K.R., et al., Section 11.6.1. Nutrition, in: Chapter 11: Human health: impacts, adaptation, and co-benefits (archived 8 July 2014), pp. 10–13, in IPCC AR5 WG2 A 2014
- ↑ "Global warming risk: Rising temperatures from climate change linked to rise in suicides". USA Today. 2018.
- ↑ "Climate Change May Cause 26,000 More U.S. Suicides by 2050". The Atlantic.
- ↑ Core Writing Team; et al., eds. (2007d). "3.3.3 Especially affected systems, sectors and regions". Synthesis report. Climate Change 2007: Synthesis Report. A Contribution of Working Groups I, II, and III to the Fourth Assessment Report of the Integovernmental Panel on Climate Change (IPCC). Geneva, Switzerland: Intergovernmental Panel on Climate Change. Retrieved 15 September 2011.
- 1 2 3

- ↑ Steven C. Sherwood and Matthew Huber (2010), "An adaptability limit to climate change due to heat stress", PNAS, doi:10.1073/pnas.0913352107
- ↑ PBL Netherlands Environment Agency (15 June 2012). "Figure 6.14, in: Chapter 6: The energy and climate challenge". In van Vuuren, D.; M. Kok. Roads from Rio+20 (PDF). ISBN 978-90-78645-98-6. , p. 177, Report no: 500062001. Report website.
- ↑ Mitigation, in USGCRP 2015
- 1 2 3 4 IPCC, Synthesis Report Summary for Policymakers, Section 4: Adaptation and mitigation options, in IPCC AR4 SYR 2007.
- 1 2 Edenhofer, O., et al., Table TS.3, in: Technical summary (archived 30 December 2014), in: IPCC AR5 WG3 2014, p. 68
- ↑ Nuccitelli, Dana (31 August 2015). "Citi report: slowing global warming would save tens of trillions of dollars". The Guardian.
- ↑ Clarke, Leon, et al., Executive summary, in: Chapter 6: Assessing Transformation Pathways (archived 30 December 2014), in: IPCC AR5 WG3 2014, p. 418
- 1 2 SPM4.1: Long-term mitigation pathways, in: Summary for Policymakers (archived 27 December 2014), in: IPCC AR5 WG3 2014, pp. 10–13
- ↑ Edenhofer, O., et al., TS.3.1.2: Short- and long-term requirements of mitigation pathways, in: Technical summary (archived 30 December 2014), in: IPCC AR5 WG3 2014, pp. 55–56
- ↑ Edenhofer, O., et al., TS.3.1.3: Costs, investments and burden sharing, in: Technical summary (archived 30 December 2014), in: IPCC AR5 WG3 2014, p. 58
- ↑ Smit et al., Chapter 18: Adaptation to Climate Change in the Context of Sustainable Development and Equity, Section 18.2.3: Adaptation Types and Forms, in IPCC TAR WG2 2001.
- ↑ "New Report Provides Authoritative Assessment of National, Regional Impacts of Global Climate Change" (Press release). U.S. Global Change Research Program. 16 June 2009. Retrieved 14 January 2016.
- ↑ Cole, Daniel A. "Climate Change, Adaptation, and Development", 26 UCLA J. ENVTL. L. & POL'Y 1, 3 (2008)
- ↑ Schneider, S.H.; Semenov, S.; Patwardhan, A.; Burton, I.; Magadza, C.H.D.; Oppenheimer, M.; Pittock, A.B.; Rahman, A.; Smith, J.B.; Suarez, A.; Yamin, F. (2007). Parry, M.L.; Canziani, O.F.; Palutikof, J.P.; van der Linden, P.J.; Hanson, C.E., eds. Executive summary. In (book chapter): Chapter 19: Assessing Key Vulnerabilities and the Risk from Climate Change. In: Climate Change 2007: Impacts, Adaptation and Vulnerability. Contribution of Working Group II to the Fourth Assessment Report of the Intergovernmental Panel on Climate Change. Print version: Cambridge University Press, Cambridge, UK. This version: IPCC website. ISBN 978-0-521-88010-7. Archived from the original on 2 May 2010. Retrieved 2010-04-06.
- ↑ Lane, Lee; Caldeira, Ken; Chatfield, Robert; Langhoff, Stephanie (April 2007). "Workshop on managing solar radiation" (PDF). NASA. Archived from the original (PDF) on 31 May 2009. Retrieved 23 May 2009.
- ↑ "Stop emitting CO2 or geoengineering could be our only hope" (Press release). The Royal Society. 28 August 2009. Archived from the original on 24 June 2011. Retrieved 14 June 2011.
- ↑ Keller, David P.; Feng, Ellias Y.; Oschlies, Andreas (January 2014). "Potential climate engineering effectiveness and side effects during a high carbon dioxide-emission scenario". Nature Communications. 5: 3304. Bibcode:2014NatCo...5E3304K. doi:10.1038/ncomms4304. PMC 3948393. PMID 24569320. Retrieved 31 March 2014.
We find that even when applied continuously and at scales as large as currently deemed possible, all methods are, individually, either relatively ineffective with limited (<8%) warming reductions, or they have potentially severe side effects and cannot be stopped without causing rapid climate change.
- ↑ Quoted in IPCC SAR SYR 1996, "Synthesis of Scientific-Technical Information Relevant to Interpreting Article 2 of the UN Framework Convention on Climate Change", paragraph 4.1, p. 8 (pdf p. 18.)
- ↑ Morgan, M. Granger; Dowlatabadi, Hadi; Henrion, Max; Keith, David; Lempert, Robert; McBride, Sandra; Small, Mitchell; Wilbanks, Thomas (2009). "Non-Technical Summary: BOX NT.1 Summary of Climate Change Basics". Synthesis and Assessment Product 5.2: Best practice approaches for characterizing, communicating, and incorporating scientific uncertainty in decisionmaking. A Report by the U.S. Climate Change Science Program and the Subcommittee on Global Change Research (PDF). Washington, D.C.: National Oceanic and Atmospheric Administration. p. 11. Retrieved 1 June 2011.
- ↑ "Essential Background". United Nations Framework Convention on Climate Change. n.d. Retrieved 18 May 2010.
- ↑ "Full text of the Convention, Article 2". United Nations Framework Convention on Climate Change. n.d. Archived from the original on 28 October 2005. Retrieved 18 May 2010.
- ↑ Rogner et al., Chapter 1: Introduction, Executive summary, in IPCC AR4 WG3 2007.
- ↑ Raupach, Michael R.; Marland, Gregg; Ciais, Philippe; Le Quéré, Corinne; Canadell, Josep G.; Klepper, Gernot; Field, Christopher B. (12 June 2007). "Global and regional drivers of accelerating CO2 emissions" (Free full text). Proceedings of the National Academy of Sciences. 104 (24): 10288–93. Bibcode:2007PNAS..10410288R. doi:10.1073/pnas.0700609104. ISSN 0027-8424. PMC 1876160. PMID 17519334.
- 1 2 Dessai, Suraje (December 2001). "The climate regime from The Hague to Marrakech: Saving or sinking the Kyoto Protocol?" (PDF). Tyndall Centre Working Paper 12. Tyndall Centre. Archived from the original (PDF) on 10 June 2012. Retrieved 5 May 2010.
- ↑ Grubb, M. (July–September 2003). "The Economics of the Kyoto Protocol" (PDF). World Economics. 4 (3): 144–45. Retrieved 25 March 2010.
- 1 2 "Kyoto Protocol". United Nations Framework Convention on Climate Change. n.d. Retrieved 21 May 2011.
- ↑ Müller, Benito (February 2010). Copenhagen 2009: Failure or final wake-up call for our leaders? EV 49 (PDF). Oxford Institute for Energy Studies. p. i. ISBN 978-1-907555-04-6. Archived (PDF) from the original on 10 July 2017. Retrieved 18 May 2010.
- ↑ Rudd, Kevin (25 May 2015). "Paris Can't Be Another Copenhagen". The New York Times. Archived from the original on 3 February 2018. Retrieved 26 May 2015.
- ↑ "Technical summary". The Emissions Gap Report: Are the Copenhagen Accord pledges sufficient to limit global warming to 2 °C or 1.5 °C? A preliminary assessment (advance copy) (PDF). United Nations Environment Programme. November 2010. Archived from the original (PDF) on 27 February 2017. Retrieved 11 May 2011. This publication is also available in e-book format Archived 25 November 2010 at the Library of Congress Web Archives
- ↑ "Decision 2/CP. 15 Copenhagen Accord. In: Report of the Conference of the Parties on its fifteenth session, held in Copenhagen from 7 to 19 December 2009. Addendum. Part Two: Action taken by the Conference of the Parties at its fifteenth session" (PDF). United Nations Framework Convention on Climate Change. 30 March 2010. p. 5. Retrieved 17 May 2010.
- ↑ "Outcome of the work of the Ad Hoc Working Group on long-term Cooperative Action under the Convention" (PDF). Presidencia De La República, México. 11 December 2010. p. 2. Retrieved 12 January 2011.
- ↑ "Summary for Policymakers". Detection and Attribution of Climate Change. IPCC.
«It is extremely likely that human influence has been the dominant cause of the observed warming since the mid-20th century» (page 15) and «In this Summary for Policymakers, the following terms have been used to indicate the assessed likelihood of an outcome or a result: (...) extremely likely: 95–100%» (page 2).
, in IPCC AR5 WG1 2013. - 1 2 Royal Society (13 April 2005). "Letter from The Royal Society: A Guide to Facts and Fictions About Climate Change: Misleading arguments: Many scientists do not think that climate change is a problem. Some scientists have signed petitions stating that climate change is not a problem. ... There are some individuals and organisations, some of which are funded by the US oil industry, that seek to undermine the science of climate change and the work of the IPCC. They appear motivated in their arguments by opposition to the United Nations Framework Convention on Climate Change and the Kyoto Protocol, which seek urgent action to tackle climate change through a reduction in greenhouse gas emissions.". Economic Affairs – Written Evidence. The Economics of Climate Change, the Second Report of the 2005–2006 session, produced by the UK Parliament House of Lords Economics Affairs Select Committee. UK Parliament. Retrieved 9 July 2011. This document is also available in PDF format
- ↑ Academia Brasileira de Ciéncias (Brazil); Royal Society of Canada; Chinese Academy of Sciences; Académie des Sciences (France); Deutsche Akademie der Naturforscher Leopoldina (Germany); Indian National Science Academy; Accademia Nazionale dei Lincei (Italy); Science Council of Japan, Academia Mexicana de Ciencias; Russian Academy of Sciences; Academy of Science of South Africa; Royal Society (United Kingdom); National Academy of Sciences (United States of America) (May 2009). "G8+5 Academies' joint statement: Climate change and the transformation of energy technologies for a low carbon future" (PDF). The National Academies of Sciences, Engineering, and Medicine. Retrieved 5 May 2010.
- ↑ Davenport, Carol (October 7, 2018). "Major Climate Report Describes a Strong Risk of Crisis as Early as 2040". The New York Times. Retrieved October 10, 2018.
- ↑ Cook, John; et al. (13 April 2016). "Consensus on consensus: a synthesis of consensus estimates on human-caused global warming". Environmental Research Letters. 11 (4): 048002. Bibcode:2016ERL....11d8002C. doi:10.1088/1748-9326/11/4/048002. Retrieved 21 July 2016.
- ↑ DiMento, Joseph F. C.; Doughman, Pamela M. (2007). Climate Change: What It Means for Us, Our Children, and Our Grandchildren. The MIT Press. p. 68. ISBN 978-0-262-54193-0.
- ↑ Brigham-Grette, Julie; et al. (September 2006). "Petroleum Geologists' Award to Novelist Crichton Is Inappropriate" (PDF). Eos. 87 (36): 364. Bibcode:2006EOSTr..87..364B. doi:10.1029/2006EO360008. Retrieved 23 January 2007.
The AAPG stands alone among scientific societies in its denial of human-induced effects on global warming.
- ↑ Ripple, William J.; Wolf, Christopher; Newsome, Thomas M.; Galetti, Mauro; Alamgir, Mohammed; Crist, Eileen; Mahmoud, Mahmoud I.; Laurance, William F. (13 November 2017). "World Scientists' Warning to Humanity: A Second Notice". BioScience. doi:10.1093/biosci/bix125.
- ↑ Perkins, Sid (11 July 2017). "The best way to reduce your carbon footprint is one the government isn't telling you about". Science. Retrieved 29 November 2017.
- ↑ Boykoff, Maxwell T.; Boykoff, Jules M. (July 2004). "Balance as bias: global warming and the US prestige press". Global Environmental Change Part A. 14 (2): 125–36. doi:10.1016/j.gloenvcha.2003.10.001.
- ↑ Oreskes, Naomi; Conway, Erik. Merchants of Doubt: How a Handful of Scientists Obscured the Truth on Issues from Tobacco Smoke to Global Warming (first ed.). Bloomsbury Press. ISBN 978-1-59691-610-4.
- ↑ McCright, Aaron M.; Dunlap, Riley E., "Challenging Global Warming as a Social Problem: An Analysis of the Conservative Movement's Counter-Claims", Social Problems, November 2000, Vol. 47 Issue 4, pp 499–522 in JSTOR
- ↑ Weart, S. (July 2009). "The Public and Climate Change (cont. – since 1980). Section: After 1988". American Institute of Physics. Retrieved 5 May 2010.
- SEPP (n.d.). "Frequently Asked Questions About Climate Change". Science & Environmental Policy Project (SEPP). Archived from the original on 11 May 2008. Retrieved 5 May 2010.
- ↑ Begley, Sharon (13 August 2007). "The Truth About Denial". Newsweek. Retrieved 13 August 2007.
- ↑ Adams, David (20 September 2006). "Royal Society tells Exxon: stop funding climate change denial". The Guardian. London. Retrieved 9 August 2007.
- ↑ "Exxon cuts ties to global warming skeptics". MSNBC. 12 January 2007. Archived from the original on 18 June 2007. Retrieved 2 May 2007.
- ↑ Sandell, Clayton (3 January 2007). "Report: Big Money Confusing Public on Global Warming". ABC. Retrieved 27 April 2007.
- ↑ "Greenpeace: Exxon still funding climate skeptics". USA Today. Reuters. 18 May 2007. Retrieved 21 January 2010.
- ↑ "Global Warming Resolutions at U.S. Oil Companies Bring Policy Commitments from Leaders, and Record High Votes at Laggards" (Press release). Ceres. 13 May 2004. Retrieved 4 March 2010.
- ↑ "Oil Company Positions on the Reality and Risk of Climate Change". Environmental Studies, University of Oshkosh – Wisconsin. Retrieved 27 March 2016.
- ↑ Weart, S. (February 2015). "The Public and Climate Change (cont. – since 1980). Section: after 1988". American Institute of Physics. Retrieved 18 August 2015.
- ↑ "Environment". Gallup. 2015. Retrieved 18 August 2015.
- ↑ Peter Newell (December 14, 2006). Climate for Change: Non-State Actors and the Global Politics of the Greenhouse. Cambridge University Press. p. 80. ISBN 978-0-521-02123-4. Retrieved July 30, 2018.
- ↑ "Yale Researcher Anthony Leiserowitz On Studying, Communicating with American Public". Yale Climate Connections. 2010.
- ↑ Shindell, Drew; Faluvegi, Greg; Lacis, Andrew; Hansen, James; Ruedy, Reto; Aguilar, Elliot (28 April 2006). "Role of tropospheric ozone increases in 20th-century climate change" (PDF). Journal of Geophysical Research. 111 (D8): D08302. Bibcode:2006JGRD..11108302S. doi:10.1029/2005JD006348.
- ↑ "Losing Earth: The Decade We Almost Stopped Climate Change, chapter 2 You Scientists Win 1985". The New York Times. 1 August 2018.
- ↑ Pugliese, Anita (20 April 2011). "Fewer Americans, Europeans View Global Warming as a Threat". Gallup. Retrieved 22 April 2011.
- ↑
Ray, Julie; Anita Pugliese (22 April 2011). "Worldwide, Blame for Climate Change Falls on Humans". Gallup.Com. Retrieved 3 May 2011.
People nearly everywhere, including majorities in developed Asia and Latin America, are more likely to attribute global warming to human activities rather than natural causes. The U.S. is the exception, with nearly half (47%) – and the largest percentage in the world – attributing global warming to natural causes.
- ↑ "Climate Change and Financial Instability Seen as Top Global Threats". Pew Research Center for the People & the Press. 24 June 2013.
- 1 2 Weart, Spencer R. (February 2014). "The Discovery of Global Warming; The Public and Climate Change: Suspicions of a Human-Caused Greenhouse (1956–1969)". American Institute of Physics. Retrieved 12 May 2015. , and footnote 27
- 1 2 Weart, Spencer R. (February 2014). "The Discovery of Global Warming; The Public and Climate Change: The Summer of 1988". American Institute of Physics. Retrieved 12 May 2015.
- ↑ U.S. Senate, Committee on Energy and Natural Resources, "Greenhouse Effect and Global Climate Change, part 2" 100th Cong., 1st sess., 23 June 1988, p. 44.
References
- Good, P.; et al. (2010), An updated review of developments in climate science research since IPCC AR4. A report by the AVOID consortium (PDF), London, UK: Committee on Climate Change , p. 14. Report website.
- IAP (June 2009), Interacademy Panel (IAP) Member Academies Statement on Ocean Acidification , Secretariat: TWAS (the Academy of Sciences for the Developing World), Trieste, Italy.
- IEA (2009). World Energy Outlook 2009 (PDF). Paris, France: International Energy Agency (IEA). ISBN 978-92-64-06130-9.
- IPCC AR4 SYR (2007). Core Writing Team; Pachauri, R.K; Reisinger, A., eds. Climate Change 2007: Synthesis Report. Contribution of Working Groups I, II and III to the Fourth Assessment Report of the Intergovernmental Panel on Climate Change. IPCC. ISBN 92-9169-122-4.
- IPCC AR4 WG1 (2007). Solomon, S.; Qin, D.; Manning, M.; Chen, Z.; Marquis, M.; Averyt, K.B.; Tignor, M.; Miller, H.L., eds. Climate Change 2007: The Physical Science Basis. Contribution of Working Group I to the Fourth Assessment Report of the Intergovernmental Panel on Climate Change. Cambridge University Press. ISBN 978-0-521-88009-1. (pb: 978-0-521-70596-7)
- IPCC AR4 WG2 (2007). Parry, M.L.; Canziani, O.F.; Palutikof, J.P.; van der Linden, P.J.; Hanson, C.E., eds. Climate Change 2007: Impacts, Adaptation and Vulnerability. Contribution of Working Group II to the Fourth Assessment Report of the Intergovernmental Panel on Climate Change. Cambridge University Press. ISBN 978-0-521-88010-7. (pb: 978-0-521-70597-4)
- IPCC AR4 WG3 (2007). Metz, B.; Davidson, O.R.; Bosch, P.R.; Dave, R.; Meyer, L.A., eds. Climate Change 2007: Mitigation of Climate Change. Contribution of Working Group III to the Fourth Assessment Report of the Intergovernmental Panel on Climate Change. Cambridge University Press. ISBN 978-0-521-88011-4. (pb: 978-0-521-70598-1)
- IPCC AR5 WG1 (2013), Stocker, T.F.; et al., eds., Climate Change 2013: The Physical Science Basis. Working Group 1 (WG1) Contribution to the Intergovernmental Panel on Climate Change (IPCC) 5th Assessment Report (AR5), Cambridge University Press . Climate Change 2013 Working Group 1 website.
- IPCC AR5 WG2 A (2014), Field, C.B.; et al., eds., Climate Change 2014: Impacts, Adaptation, and Vulnerability. Part A: Global and Sectoral Aspects (GSA). Contribution of Working Group II (WG2) to the Fifth Assessment Report (AR5) of the Intergovernmental Panel on Climate Change (IPCC), Cambridge University Press, archived from the original on 16 April 2014 . Archived
- IPCC AR5 WG3 (2014), Edenhofer, O.; et al., eds., Climate Change 2014: Mitigation of Climate Change. Contribution of Working Group III (WG3) to the Fifth Assessment Report (AR5) of the Intergovernmental Panel on Climate Change (IPCC), Cambridge University Press, archived from the original on 27 November 2014 . Also available at mitigation2014.org.
- IPCC SAR SYR (1996). "Climate Change 1995: A report of the Intergovernmental Panel on Climate Change". Second Assessment Report of the Intergovernmental Panel on Climate Change. IPCC. pdf. The "Full Report", consisting of "The IPCC Second Assessment Synthesis of Scientific-Technical Information Relevant to Interpreting Article 2 of the UN Framework Convention on Climate Change" and the Summaries for Policymakers of the three Working Groups.
- IPCC SAR WG3 (1996). Bruce, J.P.; Lee, H.; Haites, E.F., eds. Climate Change 1995: Economic and Social Dimensions of Climate Change. Contribution of Working Group III to the Second Assessment Report of the Intergovernmental Panel on Climate Change. Cambridge University Press. ISBN 0-521-56051-9. (pb: 0-521-56854-4) pdf.
- IPCC SREX (2012). Field, C.B.; et al., eds. "Managing the Risks of Extreme Events and Disasters to Advance Climate Change Adaptation (SREX)". Cambridge University Press. Archived from the original on 19 December 2012. . Summary for Policymakers Summary for Policymakers.
- IPCC TAR WG1 (2001). Houghton, J.T.; Ding, Y.; Griggs, D.J.; Noguer, M.; van der Linden, P.J.; Dai, X.; Maskell, K.; Johnson, C.A., eds. Climate Change 2001: The Scientific Basis. Contribution of Working Group I to the Third Assessment Report of the Intergovernmental Panel on Climate Change. Cambridge University Press. ISBN 0-521-80767-0. Archived from the original on 30 March 2016. (pb: 0-521-01495-6)
- IPCC TAR WG2 (2001). McCarthy, J. J.; Canziani, O. F.; Leary, N. A.; Dokken, D. J.; White, K. S., eds. Climate Change 2001: Impacts, Adaptation and Vulnerability. Contribution of Working Group II to the Third Assessment Report of the Intergovernmental Panel on Climate Change. Cambridge University Press. ISBN 0-521-80768-9. Archived from the original on 14 May 2016. (pb: 0-521-01500-6)
- IPCC TAR WG3 (2001). Metz, B.; Davidson, O.; Swart, R.; Pan, J., eds. Climate Change 2001: Mitigation. Contribution of Working Group III to the Third Assessment Report of the Intergovernmental Panel on Climate Change. Cambridge University Press. ISBN 0-521-80769-7. Archived from the original on 27 February 2017. (pb: 0-521-01502-2)
- USGCRP (2015), Glossary, Washington, DC: U.S. Global Change Research Program (USGCRP), retrieved 20 January 2014 . Archived url.
- National Research Council (2011), Climate Stabilization Targets: Emissions, Concentrations, and Impacts over Decades to Millennia, Washington, DC: National Academies Press, archived from the original on 27 March 2014
- National Research Council (2010). America's Climate Choices: Panel on Advancing the Science of Climate Change;. Washington, DC: The National Academies Press. ISBN 0-309-14588-0. Archived from the original on 29 May 2014.
- Parris, A.; et al. (6 December 2012), Global Sea Level Rise Scenarios for the US National Climate Assessment. NOAA Tech Memo OAR CPO-1 (PDF), NOAA Climate Program Office . Report website.
- UNEP (2010), UNEP Emerging Issues: Environmental Consequences of Ocean Acidification: A Threat to Food Security (PDF), Nairobi, Kenya: United Nations Environment Programme (UNEP), archived from the original (PDF) on 7 April 2015 . Report summary.
- US NRC (2008). "Understanding and responding to climate change: Highlights of National Academies Reports, 2008 edition, produced by the US National Research Council (US NRC)". Washington, DC: National Academy of Sciences.
- US NRC (2012). "Climate Change: Evidence, Impacts, and Choices". US National Research Council (US NRC). Also available as PDF
- Zeebe, R.E. (May 2012), "History of Seawater Carbonate Chemistry, Atmospheric CO2, and Ocean Acidification" (PDF), Annual Review of Earth and Planetary Sciences, 40, pp. 141–65, Bibcode:2012AREPS..40..141Z, doi:10.1146/annurev-earth-042711-105521 .
External links
| Wikiversity hosts a testbank of quizzes to assess students' understanding of this article |
| Library resources about Global warming |
Research
- NASA Goddard Institute for Space Studies – Global change research
- NOAA State of the Climate Report – U.S. and global monthly state of the climate reports
- Climate Change at the National Academies – repository for reports
- Nature Reports Climate Change – free-access web resource
- Met Office: Climate Guide – UK National Weather Service
- Educational Global Climate Modelling (EdGCM) – research-quality climate change simulator
Educational
- Climate Science Special Report United States 2017
- NASA: Climate change: How do we know?
- Global Climate Change: NASA's Eyes on the Earth – NASA, JPL, Caltech
- Global Climate Change Indicators – NOAA
- NOAA Climate Services – NOAA
- Skeptical Science: Getting skeptical about global warming skepticism
- Understanding Climate Change – Frequently Asked Questions – UCAR
- Global Carbon Dioxide Circulation (NASA; 13 December 2016)
- The World Bank – Climate Change – A 4 Degree Warmer World – We must and can avoid it
- Climate change tutorial by Prof. Myles Allen (Oxford), March 2018: Parts 1, 2, 3, 4, 5 (45 min. total); background & slide deck
- Experts Discuss Recent Heat Waves and Atmospheric Changes (July 2018)
| General | 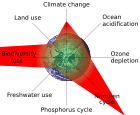 | |
|---|---|---|
| Causes | ||
| Effects |
| |
| Mitigation | ||
| ||