List of countries by carbon dioxide emissions
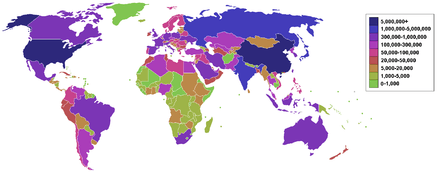
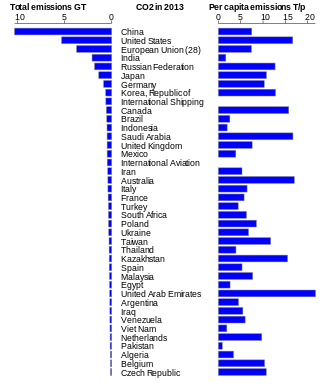
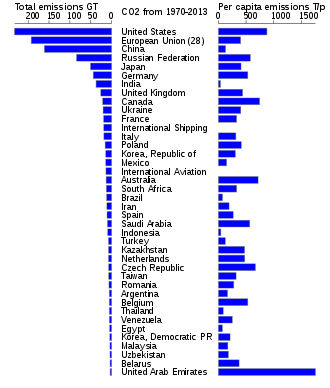

This is a list of sovereign states and territories by carbon dioxide emissions due to certain forms of human activity, based on the EDGAR database created by European Commission and Netherlands Environmental Assessment Agency released in 2015. The following table lists the 2015 annual CO2 emissions estimates (in thousands of CO2 tonnes) along with a list of emissions per capita (in tonnes of CO2 per year) from same source. The data only considers carbon dioxide emissions from the burning of fossil fuels and cement manufacture, but not emissions from land use, land-use change and forestry. Emissions from international shipping or bunker fuels are also not included in national figures,[2] which can make a large difference for small countries with important ports. The top 10 largest emitter countries account for 67.6% of the world total. Since 2006, China keeps emitting more CO2 than any other country.[3][4][5][6][7] Other powerful, more potent greenhouse gases, including methane, are not included in this data.
2015 list
| Country | Fossil fuel CO2 emissions (kt) in 2015[8] | % Fossil fuel CO2 emissions by country | Emissions per capita (t) in 2015[9] | Emissions (kg) per $1,000 of GDP (2010 US$) in 2014[10] |
|---|---|---|---|---|
| World | 36,061,710 | 100% | 4.9 | 490.8 |
| 10,641,789 | 29.51% | 7.7 | 1235 | |
| 5,172,336 | 14.34% | 16.1 | 324.2 | |
| 3,469,671 | 9.62% | 6.9 | 184.7 | |
| 2,454,968 | 6.81% | 1.9 | 1051.5 | |
| 1,760,895 | 4.88% | 12.3 | 999.4 | |
| 1,252,890 | 3.47% | 9.9 | 205.2 | |
| 777,905 | 2.16% | 9.6 | 197.4 | |
| International Shipping | 642,024 | 1.78% | — | — |
| 633,750 | 1.76% | 8.0 | 1344.4 | |
| 617,285 | 1.71% | 12.3 | 475.7 | |
| 555,401 | 1.54% | 15.5 | 301 | |
| 505,565 | 1.40% | 16.0 | 921.9 | |
| 502,961 | 1.39% | 2.0 | 492.7 | |
| International Aviation | 502,936 | 1.39% | — | — |
| 486,229 | 1.35% | 2.3 | 218.6 | |
| 472,018 | 1.31% | 3.7 | 405.4 | |
| 446,348 | 1.24% | 18.6 | 281.8 | |
| 417,161 | 1.16% | 7.7 | 1184.3 | |
| 398,524 | 1.11% | 6.2 | 158.8 | |
| 357,157 | 0.99% | 4.5 | 337.4 | |
| 352,886 | 0.98% | 5.9 | 156.8 | |
| 327,787 | 0.91% | 5.1 | 110.5 | |
| 294,879 | 0.82% | 7.6 | 533.5 | |
| 279,253 | 0.77% | 4.1 | 826.6 | |
| 279,174 | 0.77% | 11.9 | N/A | |
| 267,978 | 0.74% | 15.2 | 1349.2 | |
| 262,683 | 0.73% | 5.7 | 170.7 | |
| 245,371 | 0.68% | 8.1 | 772.5 | |
| 228,688 | 0.63% | 5.1 | 1692.1 | |
| 226,985 | 0.63% | 2.5 | 843 | |
| 206,028 | 0.57% | 2.2 | 1152.4 | |
| 199,253 | 0.55% | 21.8 | 595.3 | |
| 191,199 | 0.53% | 4.4 | 459.8 | |
| 178,568 | 0.50% | 5.7 | 439.5 | |
| 174,843 | 0.48% | 0.9 | 806.6 | |
| 165,317 | 0.46% | 7.8 | 196.4 | |
| 160,623 | 0.45% | 4.4 | 915.9 | |
| 147,692 | 0.41% | 3.7 | 795 | |
| 113,035 | 0.31% | 1.1 | 421.2 | |
| 111,092 | 0.31% | 10.5 | 450.6 | |
| 109,845 | 0.30% | 3.7 | 1960.9 | |
| 97,002 | 0.27% | 8.6 | 186.4 | |
| 95,013 | 0.26% | 24.4 | 695.6 | |
| 94,236 | 0.26% | 17.5 | 1956.1 | |
| 88,825 | 0.25% | 39.7 | 669 | |
| 86,896 | 0.24% | 0.5 | 212.9 | |
| 81,247 | 0.22% | 4.2 | 381.1 | |
| 81,110 | 0.22% | 4.5 | 319.3 | |
| 80,967 | 0.22% | 1.7 | 241.3 | |
| 78,446 | 0.22% | 17.5 | 899.6 | |
| 38,000 | 0.10% | 3.9 | 642.1 | |
| other countries | ||||
2016 Top Emitters
| Country | Fossil fuel CO2 emissions (kt) in 2016[11] |
|---|---|
| World | 35,753,306 |
| 10,432,751 | |
| 5,011,687 | |
| 2,533,638 | |
| 1,661,899 | |
| 1,239,592 | |
| 775,752 | |
| International Shipping | 656,369 |
| 642,560 | |
| 604,044 | |
| 675,919 | |
| 517,079 | |
| 530,036 | |
| International Aviation | 523,454 |
| 462,995 | |
| 441,413 | |
| 414,989 | |
| 390,558 | |
| 368,123 | |
| 367,860 | |
| 358,140 | |
| 331,533 |
See also
- List of countries by carbon dioxide emissions per capita
- List of countries by carbon intensity
- List of countries by electricity production from renewable sources
- List of countries by greenhouse gas emissions
- List of countries by greenhouse gas emissions per capita
- List of countries by ratio of GDP to carbon dioxide emissions
- List of companies by carbon dioxide emissions per year
General:
Notes and references
- 1 2 CO2 time series 1990-2013 per capita for world countries EDGAR Last update: 30/10/2017
- ↑ Schrooten, L; De Vlieger, Ina; Int Panis, Luc; Styns, R. Torfs, K; Torfs, R (2008). "Inventory and forecasting of maritime emissions in the Belgian sea territory, an activity based emission model". Atmospheric Environment. 42: 667–676. doi:10.1016/j.atmosenv.2007.09.071.
- ↑ "China's Emissions: More Than U.S. Plus Europe, and Still Rising". New York Times. 2018-01-25.
- ↑ "Chinese coal fuels rise in global carbon emissions". The Times. 2017-11-14.
- ↑ "Yes, The U.S. Leads All Countries In Reducing Carbon Emissions". Forbes. 2017-10-24.
- ↑ "World carbon dioxide emissions data by country: China speeds ahead of the rest". The Guardian. 2011-01-31.
- ↑ "China now no. 1 in CO2 emissions; USA in second position". PBL Netherlands Environmental Assessment Agency.
- ↑ "CO2 time series 1990-2015 per region/country". Netherlands Environmental Assessment Agency. Retrieved 2017-03-07.
- ↑ "CO2 time series 1990-2015 per capita for world countries". Netherlands Environmental Assessment Agency. Retrieved 2017-03-07.
- ↑ "CO2 emissions (kg per 2010 US$ of GDP)". World Bank. Retrieved 2018-08-25.
- ↑ "JRC SCIENCE FOR POLICY REPORT Fossil CO2 & GHG emissions of all world countries" (PDF). EDGAR. 2017. Retrieved 2018-03-30.
External links
The contents of this article comes from the latest figures from the millennium indicators as of 2009-07-14:
- United Nation Statistics Division
- GHG data from UNFCCC - United Nations Framework Convention on Climate Change GHG emissions data
- Google - public data "CO2 emissions (kt)"
- Google - public data "CO2 emissions (tonne per capita)"