Coal mining in the United States
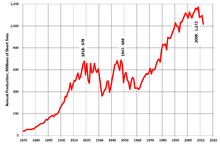
Coal mining in the United States is an industry in transition. Production in 2017 was down 33% from the peak production of 1,162.7 million tons (about 1054.8 million metric tonnes) in 2006. Employment of 50,000 coal miners is down from a peak of 883,000 in 1923.[1] Generation of electricity is the largest user of coal, being used to produce 50% of electric power in 2005 and 30% in 2016.[2]:1 The U.S. is a net exporter of coal. U.S. coal exports, for which Europe is the largest customer, peaked in 2012.[3] In 2015, the U.S. exported 7.0 percent of mined coal.[4]
Coal remains an important factor in the 25 states in which it is mined. According to the U.S. Energy Information Administration (EIA), in 2015 Wyoming, West Virginia, Kentucky, Illinois, and Pennsylvania produced about 639 millions of short tons (MST) representing 71% of total U.S. coal production in the United States.[5]
In 2015, four publicly-traded US coal companies filed for Chapter 11 bankruptcy protection, including Patriot Coal Corporation, Walter Energy, and the fourth-largest Alpha Natural Resources. By January 2016, more than 25% of coal production was in bankruptcy in the United States[6] including the top two producers Peabody Energy[7][8] and Arch Coal.[6][9] When Arch Coal filed for bankruptcy protection, the price of coal had dropped 50% since 2011[10] and it was $4.5 billion in debt.[6][10] On October 5, 2016, Arch Coal emerged from chapter 11 bankruptcy protection.[11] In October 2018, Westmoreland Coal Company filed for bankruptcy protection.[12][13][14]
History
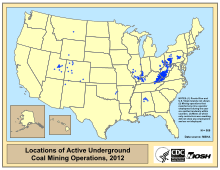
Coal, primarily from underground mines east of the Mississippi was the nation's primary fuel source until the early 1950s. Surface (strip) and mountaintop removal mining overtook underground mines in the 1970s. In 2000, the majority of coal was produced west of the Mississippi.
Production
In 2017, U.S. coal mining increased to 773 million short tons.[15] In 2016, US coal mining declined to 728.2 million short tons, down 37 percent from the peak production of 1,172 million tons in 2008. In 2015, 896.9 million short tons of coal were mined in the United States,[16] with an average price of $31.83 per short ton,[17] worth $28.6 billion.[18][19]
| Coal in the US (Million Short Tons) | |||
|---|---|---|---|
| Production[20] | Net Exports[22][23][24] | Net Available | |
| 2000 | 1,074 | 46 | 1,008 |
| 2001 | 1,128 | 29 | 1,099 |
| 2002 | 1,094 | 23 | 1,071 |
| 2003 | 1,072 | 18 | 1,054 |
| 2004 | 1,112 | 21 | 1,091 |
| 2005 | 1,131 | 19 | 1,112 |
| 2006 | 1,163 | 13 | 1,150 |
| 2007 | 1,147 | 23 | 1,124 |
| 2008 | 1,172 | 47 | 1,125 |
| 2009 | 1,075 | 36 | 1,039 |
| 2010 | 1,084 | 62 | 1,022 |
| 2011 | 1,096 | 94 | 1,002 |
| 2012 | 1,016 | 117 | 899 |
| 2013 | 985 | 109 | 876 |
| 2014 | 1,000 | 86 | 914 |
| 2015 | 896 | 63 | 833 |
| 2016 | 738.7 | 50.5 | 688 |
1 short ton = 0.907184 metric tonnes
Coal production by region
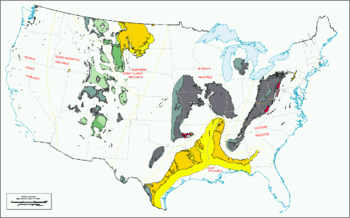


The three regions producing the largest amount of coal are Powder River Basin of Wyoming and Montana, the Appalachian Basin and the Illinois Basin. In the United States, coal production declined from 2008 but the decline was unevenly distributed. Production from the largest coal mining-region in the U.S., the Powder River Basin, with most of the coal buried too deeply to be economically accessible,[2] declined 16 percent, the Appalachian Basin declined 32 percent 2008 to 2014 and the Illinois Basin increased its production 39 percent from 2008 to 2014.[25] In 2015, five states—Wyoming, West Virginia, Kentucky, Illinois, and Pennsylvania—produced almost 3/4 of all coal production nationwide. Wyoming produced 375.8 million short tons representing 42% of U. S. coal production, West Virginia produced 95.6 million short tons or 11%, Kentucky was third with 61.4 or 7%, Illinois was fourth with 56.1 or 6% and Pennsylvania was fifth with 50.0 or 6%.[5]
As of 2014, twenty-five states produced coal. The coal-producing states were, in descending order, with annual production in millions of short tons:[26]
- 1. Wyoming 395.7 (see Coal mining in Wyoming)
- 2. West Virginia 112.2
- 3. Kentucky 77.3 (see Coal mining in Kentucky)
- 4. Pennsylvania 60.9
- 5. Illinois 58.0
- 6. Montana 44.6
- 7. Texas 43.7
- 8. Indiana 39.3
- 9. North Dakota 29.2
- 10 Colorado 24.0 (see Coal mining in Colorado)
- 11. Ohio 22.3
- 12. New Mexico 22.0
- 13. Utah 17.9
- 14. Alabama 16.4
- 15. Virginia 15.1
- 16. Arizona 8.1
- 17. Mississippi 3.7
- 18. Louisiana 2.6
- 19. Maryland 2.0
- 20. Alaska 1.5
- 21. Oklahoma 0.9
- 22. Tennessee 0.8
- 23. Missouri 0.4
- 24. Arkansas 0.1
- 25. Kansas 0.1
Coal production by type
The hardest coal, anthracite, originally used for steel production, heating, and as fuel for ships and railroads, had by 2000 dwindled to an insignificant portion of production. Softer bituminous coal replaced anthracite for steel production. The even softer sub-bituminous and lignite coals overtook bituminous in the 2000s.


Companies
| Rank | Company | Million short tons/Year | Percent of total production | Notes |
|---|---|---|---|---|
| 1 | Peabody Energy | 189.5 | 19.0% | Declared bankruptcy in 2016 |
| 2 | Arch Coal | 135.8 | 13.6% | Declared bankruptcy in 2016 |
| 3 | Cloud Peak Energy | 85.8 | 8.6% | |
| 4 | Alpha Natural Resources | 80.1 | 8.0% | Declared bankruptcy in 2015[27] |
| 5 | Murray Energy | 62.8 | 6.3% | |
| 6 | Alliance Resource Partners | 41.0 | 4.1% | |
| 7 | Westmoreland Coal Company | 35.6 | 3.6% | |
| 8 | CONSOL Energy | 32.2 | 3.2% | |
| 9 | NACCO Industries | 31.6 | 3.2% | |
| 10 | Energy Future Holdings | 29.7 | 3.0% | |
| Annual owned production, 2014. Source:[28] | ||||
In 2014, the production owned by the top ten companies was 72.6% of total US coal production.[28]
Coal mining employment


By the end of 2016, the coal industry employed approximately 50,000 miners.[1]
US employment in coal mining peaked in 1923, when there were 863,000 coal miners.[29] Since then, mechanization has greatly improved productivity in coal mining, so that employment has declined at the same time coal production increased. The average number of coal mining employees declined to 50,500 in 2016.[1] This was below the previous low of 70,000 in 2003, and the lowest number of US coal miners in at least 125 years.[30][31]
Because of the sharp declines in the U.S. coal industry, the Harvard Business Review discussed retraining coal workers for solar photovoltaic employment because of the rapid rise in U.S. solar jobs.[32] A recent study indicated that this was technically possible and would account for only 5% of the industrial revenue from a single year to provide coal workers with job security in the energy industry as whole.[33]
Exports

The U.S. is a net exporter of coal.[34] US net coal exports increased ninefold from 2006 to 2012, peaked at 117 million short tons in 2012, and were 97 million short tons in 2017. [35] In 2015, 60% of net US exports went to Europe, 27% to Asia.[36] The largest individual country export markets were the Netherlands (12.9 million short tons), India (6.4 million short tons), Brazil (6.3 million short tons), and South Korea (6.1 million short tons). Coal exports to China, formerly one of the major markets, declined from 8.3 million short tons in 2013, down to 0.2 million tons in 2015.[23][37]
In 2012, six coal export terminals were in the planning stages in the Pacific Northwest.[38] They were scheduled to be supplied by strip mines in the Powder River Basin. The export markets were South Korea, Japan, China, and other Asian nations. Like the Keystone Pipeline the building of the terminals raised environmental concerns with respect to global warming.[39] As of February 2016, four proposals for coal terminals had been withdrawn, leaving two still applied for. The withdrawals were ascribed to loss of demand and consequent lower coal prices.[40]
Usage
In 2013, 92.8 percent of US internal coal consumption was for electricity generation. Other uses were industrial (4.7 percent), coke manufacture (2.3 percent), and commercial and institutional (0.2 percent).[41][42] In 2016, the EIA calculated that coal would provide 30% of electricity generation nationwide with natural gas providing 34%, nuclear, 19%, and renewables, 15%.[43]
Both the tonnage of coal used for electricity (1,047 million short tons) and the amount of US electricity generated from coal (2.02 million GWh) peaked in 2007. By 2015, electrical generation from coal had declined to 1.36 million GWh, and coal's share of total electrical generation in the US fell from 48.5 percent in 2007 to 33.1 percent in 2015. Most of the decrease in coal electricity was offset by an increase in generation from natural gas-fired power plants.[44][45]
In 2006, there were 1,493 coal-powered generating units at electrical utilities across the US, with total nominal capacity of 335.8 GW[46] (compared to 1024 units at nominal capacity of 278 GW in 2000).[47] Actual power generated from coal in 2006 was 227.1 GW (1.991 trillion kilowatt-hours per year),[48] the highest in the world and still slightly ahead of China (1.95 trillion kilowatt-hours per year) at that time.[49] In 2000, US production of electricity from coal was 224.3 GW (1.966 trillion kilowatt-hours per year).[48] In 2006, the US consumed 1,026,636,000 short tons (931,349,000 metric tons) or 92.3% of coal mined for electricity generation.[50]
As of 2013, domestic coal consumption for power production was being displaced by natural gas, but production from strip mines utilizing thick deposits in the western United States such as the Powder River Basin in northern Wyoming and Southern Montana for export to Asia increased.[51] In 2014, 3.0 percent of the coal shipments from Montana and Wyoming were exported.[52] The 2014 coal exports from the two states of 13 .4 million short tons represented an increase of 1.2 million tons over 2012 export levels, which is 0.3 percent of the states’ 2014 total coal shipments of 439.8 million tons.[53]
Coal mining on federal lands
As of 2013, 41 percent of US coal production was mined from federal land, almost all of it in the western US, where federal coal makes up about 80 percent of mined production. The federal coal program is overseen by the Bureau of Land Management (BLM) under the US Department of Interior. Federal coal lands are leased by competitive sealed bids, for the highest bonus (initial payment) offered. In addition, the government receives an annual rental of $3 per acre, and a fixed percentage royalty of the market value of coal produced. The royalty is 8 percent for underground mines and 12.5 percent for surface mines.[54] In 2014, the program generated about $1.2 billion in lease bonuses, rentals, and royalties for coal mining on federal lands.[31]
In January 2016, the Obama administration announced a three-year moratorium on federal coal lease sales on public land, effective immediately, and leaving around 20 years-of coal production under way. He noted that the program had not had a "top-down review" for the past 30 years.[55] This would affect 50 licenses.[19] The Trump administration reversed the moratorium.[56]
The Government Accountability Office has questioned whether bonus and royalty rates reflect coal's market value. Per GAO, since 1990 Colorado earned about $22 million less from bonus bids than Utah, though Colorado leased out almost 76 million tons more coal than Utah. BLM personnel noted that the coal mined in Utah was closer to its market, and so was more valuable due to lower transportation cost.[54]:27
The GAO report noted that the BLM publishes little information on federal coal lease sales, also does not include their appraisal report, because some of this information is "sensitive and proprietary"; this violates BLM's own guidance.[54]:44
The GAO also noted that the competitiveness of federal coal lease sales was limited by lack of multiple bids. Of the 107 tracts leased since 1990, 96 drew only a single bidder. This was attributed to the fact that most leased tracts were close to a single existing mine, and the large capital cost of installing a new mine discouraged competition. The BLM can reject bids which do not meet its estimate of fair market value, and 18 of the coal tracts leased since 1990 were tracts re-bid after the BLM had rejected the initial bids as too low. However, the GAO found that some BLM offices did not have the personnel to prepare adequate estimates of market value.[54]:16–19
A Boston-based think tank, the Institute for Energy Economic & Financial Analysis study estimated that, since 1991, $29 billion over a 30-year period was lost in the Powder River Basin, due to lack of competitive bidding.[57][58] The Institute’s mission statement notes that its goals include: “… to reduce dependence on coal and other non-renewable energy resources.”[59]
Energy value


The average heat content of mined US coal has declined over the years as higher-rank coal production (anthracite, and then bituminous coal) declined, and production of lower rank coal (Sub-bituminous and lignite) increased. The average heat content of US-mined coal decreased 21% from 1950 to 2016, and 6.8% in the 20 years from 1996 to 2016.[60]
The tonnage of mined coal hit a peak in 2008, and has declined since. The energy value of mined US coal hit its all-time peak a decade earlier, in 1998, at 26.2 quadrillion BTU. The energy value of US coal mined in 2016 was 14.6 quadrillion BTU, 44 percent lower than the peak.[61]
| Year | Million short tons[20][21] | Million BTU/short ton[60] | Quadrillion BTU[62] |
|---|---|---|---|
| 2000 | 1,074 | 21.07 | 22.74 |
| 2001 | 1,128 | 20.77 | 23.55 |
| 2002 | 1,094 | 20.67 | 22.73 |
| 2003 | 1,072 | 20.50 | 22.09 |
| 2004 | 1,112 | 20.42 | 22.85 |
| 2005 | 1,131 | 20.35 | 23.18 |
| 2006 | 1,163 | 20.31 | 23.79 |
| 2007 | 1,147 | 20.34 | 23.49 |
| 2008 | 1,172 | 20.21 | 23.85 |
| 2009 | 1,075 | 19.96 | 21.62 |
| 2010 | 1,084 | 20.17 | 22.04 |
| 2011 | 1,096 | 20.14 | 22.04 |
| 2012 | 1,016 | 20.22 | 20.68 |
| 2013 | 985 | 20.18 | 20.00 |
| 2014 | 1,000 | 20.15 | 20.29 |
| 2015 | 897 | 19.88 | 17.95 |
| 2016 | 728 | 19.88 | 14.58 |
| 36.68 million BTU = 1 tonne of oil equivalent (toe) | |||
Accidents

Mine disasters have still occurred in recent years in the US,[63] Examples include the Sago Mine disaster of 2006, and the 2007 mine accident in Utah's Crandall Canyon Mine, where nine miners were killed and six entombed.[64] In the decade 2005-2014, US coal mining fatalities averaged 28 per year.[65] The most fatalities during the 2005-2014 decade were 48 in 2010, the year of the Upper Big Branch Mine disaster in West Virginia, which killed 29 miners.[66]
Human and Environmental Health
Accidents are not the only threat to modern coal miners and those living in coal regions. Respiratory disorders from coal dust and heart disease are both prevalent, especially in the West Virginia Appalachian coal mining region.[67] When mountaintop removal mining is used, not only do the miners suffer, but people living in the regions develop health issues. Excess rock, also known as overburden, removed from the mountains is dumped into valleys creating toxic runoff, that often pollutes streams used for local water sources or even the groundwater and wells.[67] Flooding and air pollution is also common in mining regions.[68] Burning coal releases CO2 into the atmosphere which is contributing to global climate change.
Adverse Economic Impacts
Coal regions in West Virginia are often referred to as energy sacrifice zones. This means that the government sacrifices the health of the people and the environment in the region for the energy, and ultimately money, that can be extracted from the area. Often, the money is not returned to the state and is instead used for the salaries and lobbying in favor of Big Coal.[67]
Because of the poor economy in the region, coal mining is many miners' only economic option, which can create health problems for them and their families.[67]
Opposition
Concern about global warming in the US [69] - especially in the aftermath of Hurricane Katrina and Al Gore's receipt of the 2007 Nobel Peace Prize for his raising awareness of climate change - temporarily increased public opposition to new coal-fired power plants.[70][71] Simultaneously with these events, the anti-coal movement in the US - similar to that in the UK and Australia - had made coal-fired power projects more politically costly, and spurred further shifts in public opinion against coal-fired power.[72][73][74]
In a 2004 effort to foster positive public opinion of coal, many large coal mining companies, electric utilities, and railroads in the U.S. launched a high-profile marketing campaign to convince the American public that coal-fired power can be environmentally sustainable, despite the fact that coal is the largest contributor of CO2 emissions in the electricity sector.[75][76][77] However, some environmentalists condemned this campaign as a "greenwashing" attempt to use environmentalist rhetoric to disguise what they call "the inherently environmentally unsustainable nature of coal-fired power generation".[78]
Coal mining has historically been a male-dominated industry.[67] Today, Grassroots organizations opposed to coal mining are mostly led by women. When asked why they are participating in the opposition of the coal industry, many women reference their identities as mothers as well as Appalachians.[67]
Reserves
The United States has 477 billion tons of demonstrable reserves.[79] The energy content of this coal exceeds that of oil and gas.
See also
- List of coal mines in the United States
- American Coalition for Clean Coal Electricity
- Coal pollution mitigation
- Coal mining
- Coal power in the United States
- Environmental effects of coal
- Greenhouse gas emissions by the United States
- History of coal mining in the United States
- Coal Creek War
- List of the largest coal power stations in the United States
Footnotes
- 1 2 3 Total employment: coal mining, Federal Reserve Board of St. Louis, accessed 21 Apr. 2017.
- 1 2 Inventory of Assessed Federal Coal Resources and Restrictions to Their Development (PDF) (Report). U.S. Departments of Energy, Interior and Agriculture. August 2007. p. 94. Retrieved March 28, 2017.
- ↑ https://www.eia.gov/todayinenergy/detail.php?id=35852#
- ↑ U.S. coal exports fall on lower European demand, increased global supply, US Energy Information Administration, 3 Oct. 2014.
- 1 2 Which states produce the most coal?, EIA, February 28, 2017, retrieved May 9, 2016
- 1 2 3 Tracy Rucinski (January 10, 2016), Arch Coal files for bankruptcy, hit by mining downturn, Reuters
- ↑ "Peabody Energy Chapter 11 Petition" (PDF). PacerMonitor. PacerMonitor. Retrieved May 9, 2016.
- ↑ "Top coal miner Peabody files for bankruptcy". The Sydney Morning Herald. April 13, 2016.
- ↑ Matthew Brown and Mead Gruver (March 28, 2017), How Trump's executive order will affect coal industry, Billings, Montana, Associated Press and Billings Gazette, retrieved March 28, 2017
- 1 2 John W. Miller and Peg Brickley (January 11, 2016), Arch Coal files for Bankruptcy, Wall Street Journal
- ↑ Chaney, Sarah. "Arch Coal Emerges from Chapter 11". wsj.com. The Wall Street Journal. Retrieved 6 October 2016.
- ↑ "Westmoreland Enters into Restructuring Support Agreement with Members of Ad Hoc Lending Group; WMLP Simultaneously Files Chapter 11 to Sell Assets — Westmoreland Coal Company". westmoreland.com. Retrieved 2018-10-10.
- ↑ Kilgore, Tomi (2018-10-09). "Coal producer Westmoreland Resource Partners files for bankruptcy". MarketWatch. Retrieved 2018-10-10.
- ↑ "Westmoreland Coal Company files for bankruptcy protection". Retrieved 2018-10-10.
- ↑ https://www.eia.gov/todayinenergy/detail.php?id=35852#
- ↑ US Energy Information Administration, Table 1 Coal Production, Annual Coal Report, 2015.
- ↑ US Energy Information Administration, Table 28, Average Price of Coal, Annual Coal Report, 2015.
- ↑ Annual Coal Report, U.S. Department of Energy, November 3, 2016, retrieved March 28, 2017
- 1 2 Oliver Milman Obama administration halts new coal mining leases on public land The Guardian, 15 January 2016, accessed 16 January 2016
- 1 2 Annual coal production, US Energy Information Administration, accessed Apr. 2016.
- 1 2 Quarterly coal production, US Energy Information Administration, accessed Apr. 2016.
- ↑ Quarterly coal exports, US Energy Information Administration, accessed Apr. 2016.
- 1 2 Quarterly coal exports, US Energy Information Administration, accessed Apr. 2016.
- ↑ Coal exports and imports, US Energy Information Administration, accessed Apr. 2016.
- ↑ Coal browser, US Energy Information Administration, accessed 16 Apr. 2016.
- ↑ Coal data browser, US Energy Information Administration, accessed 16 April 2016.
- ↑ Jodi Xu Klein and Tim Loh (January 20, 2016), "The Coal Miner `On Everybody's List' as Next Bankruptcy Victim", Bloomberg Markets, retrieved March 28, 2017
- 1 2 US Energy Information Administration, Top Coal Companies, 2014, accessed May 7, 2016.
- ↑ Coal fatalities US Mine Safety and Health Administration, accessed 17 Apr. 2016.
- ↑ Historical Statistics of the United States, US Department of Commerce, 1960, p.358-359.
- 1 2 CORAL DAVENPORT In Climate Move, Obama Halts New Coal Mining Leases on Public Lands NY Times January 14, 2016.
- ↑ What If All U.S. Coal Workers Were Retrained to Work in Solar? - Harvard Business Review. August. 2016
- ↑ Edward P. Louie and Joshua M. Pearce. Retraining Investment for U.S. Transition from Coal to Solar Photovoltaic Employment. Energy Economics. 57,295–302 (2016). doi:10.1016/j.eneco.2016.05.016
- ↑ http://www.eia.gov/coal/production/quarterly/
- ↑ https://www.eia.gov/todayinenergy/detail.php?id=35852#
- ↑ "US COAL - High GCV Coal". uscoal.in. Retrieved 2017-11-14.
- ↑ Coal prices and production decline in 2015, US Energy Information Administration, accessed Apr. 2016.
- ↑ "Coal Scorecard: Your Guide To Coal In The Northwest". EarthFix Oregon Public Broadcasting. June 28, 2012. Retrieved March 26, 2013.
- ↑ Phuong Le (March 25, 2013). "NW governors ask White House to exam coal exports". The San Francisco Chronicle. Associated Press. Retrieved March 26, 2013.
- ↑ "What coal's decline means for Northwest export markets," Oregon Public Broadcasting, 17 Feb. 2016.
- ↑ Pittsburghlive.com
- ↑ US Energy Information Administration: Net generation by energy source, accessed 24 January 2009.
- ↑ Natural gas-fired electricity generation expected to reach record level in 2016, EIA, July 14, 2016, retrieved March 28, 2017
- ↑ Coal: Consumption for electricity generation, US Energy Information Administration, 16 April 2016.
- ↑ Net generation by energy source, US Energy Information Administration, 4 April 2016.
- ↑ "Existing Electric Generating Units in the United States". Energy Information Administration. 2007. Retrieved 2008-06-19.
- ↑ "Inventory of Electric Utility Power Plants in the United States 2000". Energy Information Administration. March 2002. Retrieved 2008-06-19.
- 1 2 "Electric Power Annual with data for 2006". Energy Information Administration. October 2007. Retrieved 2008-06-19.
- ↑ See Wikipedia article on the Chinese Economy
- ↑ "U.S. Coal Consumption by End-Use Sector". Energy Information Administration. July 25, 2008. Retrieved 2008-08-29.
- ↑ Matthew Brown (March 17, 2013). "Company eyes coal on Montana's Crow reservation". The San Francisco Chronicle. Associated Press. Retrieved March 18, 2013.
- ↑ Domestic and international coal distribution, US Energy Information Administration, 2013.
- ↑ US Domestic and Foreign Coal Distribution, US Energy Information, 2012.
- 1 2 3 4 Government Accountability Office Coal Leasing: BLM Could Enhance Appraisal Process, More Explicitly Consider Coal Exports, and Provide More Public Information GAO-14-140. Published 18 December 2013. Released 4 February 2014
- ↑ CORAL DAVENPORT In Climate Move, Obama Halts New Coal Mining Leases on Public Lands NY Times, January 14, 2016, accessed 16 January 2016.
- ↑ Henry, Devin (March 29, 2017). "Trump administration ends Obama's coal-leasing freeze". The Hill. Retrieved 25 September 2017.
- ↑ Matt Pearce Obama temporarily bans new coal leases on federal land Los Angeles Times, 15 January 2016.
- ↑ “Report- Almost $30 billion in revenues lost to taxpayers by “giveaway” of federally owned coal in Powder River Basin”, Institute for Energy Economic and Financial Analysis, 25 June 2012.
- ↑ “About”, Institute for Energy Economic and Financial Analysis, accessed 20 April 2016.
- 1 2 US Energy Information Administration, Table A5, Approximate heat content of coal and coal coke.
- ↑ US Energy Information Administration, Total coal mined.
- ↑ Primary energy production by source, US Energy Information Administration, accessed Apr. 2016.
- ↑ "Census of Fatal Occupational Injuries Summary, 2006 Washington D.C.: U.S. Department of Labor". Bureau of Labor Statistics. (2006).
- ↑ "Panel to Explore Deadly Mine Accident". New York Times. Associated Press. September 4, 2007.
- ↑ Coal mining fatalities, US Mine Safety and Health Administration, accessed 27 June 2016.
- ↑ Urbina, Ian (2010-04-09). "No Survivors Found After West Virginia Mine Disaster". New York Times.
- 1 2 3 4 5 6 Braun, Shannon (2010). "Coal, Identity, and the gendering of environmental justice activism in central appalacia". Gender and Society. 24: 794–813. JSTOR 25789907.
- ↑ "Flood Advisory Task Force". 2002. Retrieved 5/2/2018. Check date values in:
|access-date=(help) - ↑ "Yale Center for Environmental Law & Policy 2007 Environment Survey" Archived 2008-08-28 at the Wayback Machine., Yale Center for Environmental Law & Policy website, March 7, 2007.
- ↑ "Iowans Want Energy Conservation Before New Coal Plants", Environment News Service, December 21, 2007.
- ↑ "Kansans Support Decision to Nix Coal Plants, Want Focus on Wind Energy", Lawrence Journal-World, January 4, 2008.
- ↑ Nace, Ted. "Stopping Coal In Its Tracks", Orion, January/February 2008.
- ↑ "Fight Against Coal Plants Draws Diverse Partners", New York Times, October 20, 2007.
- ↑ "You're Getting Warmer" Archived 2008-02-05 at the Wayback Machine., East Bay Express, December 5, 2007.
- ↑ "Coal Scores With Wager on Bush Belief", Washington Post, March 25, 2001.
- ↑ "Spreading Misleading Messages", San Francisco Chronicle, November 3, 2004.
- ↑ "Coal Industry Plugs Into the Campaign", Washington Post, January 18, 2008.
- ↑ "Greenwash of the Week: Coal Industry Buys Off CNN debates" Archived 2008-10-03 at the Wayback Machine., Rainforest Action Network Understory blog, January 23, 2008.
- ↑ "U.S. Coal Reserves". EIA. November 4, 2016. Retrieved 13 October 2017.
Further reading
- Andrew B. Arnold, Fueling the Gilded Age: Railroads, Miners, and Disorder in the Pennsylvania Coal Country. New York: New York University Press, 2014.