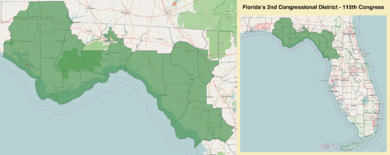
Florida's 2nd congressional district is a congressional district in the U.S. state of Florida. The district consists of the eastern part of the Florida Panhandle along with much of the Big Bend region along the Emerald Coast. It straddles both the Eastern and Central time zones. It is anchored in Panama City and includes many of the suburbs of Tallahassee, the state capital. With 51% of its residents living in urban areas, it is the least urbanized district in the state.
The district is currently represented by Republican Neal Dunn.
Characteristics
Florida's 2nd Congressional District is the largest congressional district in Florida by land area and consists of all of Bay, Calhoun, Dixie, Franklin, Gilchrist, Gulf, Jackson, Lafayette, Levy, Liberty, Suwannee, Taylor, Wakulla and Washington counties, and portions of Columbia, Holmes, Jefferson, Leon and Marion counties.
For most of its existence, the 2nd and its predecessors were centered in Tallahassee, the state capital and county seat of Leon County. While the adjacent 1st and 3rd congressional districts are among the most conservative districts in the state, the 2nd District was historically more of a swing district. Tallahassee is far more liberal than the rest of the district, and Democrat Barack Obama received 62 percent of the Leon County vote in the 2008 presidential election, but Republican John McCain received 54 percent of the 2nd district's vote overall.[5]
This changed, however, in a court-ordered redistricting that took effect for the 2016 election. Most of Tallahassee, along with nearly all of the 2nd's black residents, were drawn into the 5th District. To make up for the loss in population, the 2nd was shifted slightly to the south to take in territory previously in the nearby 3rd and 11th districts. On paper, the redrawn 2nd would have given Mitt Romney 64 percent of the vote in 2012, making it on paper the third-most Republican district in the state.[6] The new 2nd was over 12 points more Republican than its predecessor; Romney carried the old 2nd in 2012 with 52 percent of the vote.[7]
Voting
Voter registration[8]
| Voter Registration and Party Enrollment as of October 18, 2016 |
|---|
| Party |
Voters |
Percentage |
|
Republican |
204,440 |
43.39% |
|
Democratic |
183,134 |
38.86% |
|
No Party Affiliation |
71,374 |
15.14% |
List of representatives
| Representative |
Party |
Years |
Notes |
| District created March 4, 1875 |
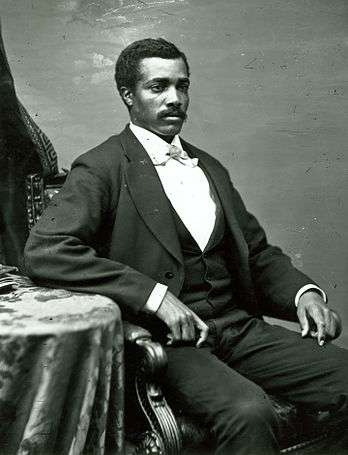 Josiah T. Walls Josiah T. Walls |
Republican |
March 4, 1875 – April 19, 1876 |
Redistricted from the At-large district, Lost contested election |
 Jesse J. Finley Jesse J. Finley |
Democratic |
April 19, 1876 – March 3, 1877 |
Won contested election |
 Horatio Bisbee, Jr. Horatio Bisbee, Jr. |
Republican |
March 4, 1877 – February 20, 1879 |
Lost contested election |
| Jesse J. Finley |
Democratic |
February 20, 1879 – March 3, 1879 |
Won contested election |
 Noble A. Hull Noble A. Hull |
Democratic |
March 4, 1879 – January 22, 1881 |
Lost contested election |
| Horatio Bisbee, Jr. |
Republican |
January 22, 1881 – March 3, 1881 |
Won contested election |
| Jesse J. Finley |
Democratic |
March 4, 1881 – June 1, 1882 |
Lost contested election |
| Horatio Bisbee, Jr. |
Republican |
June 1, 1882 – March 3, 1885 |
Won contested election |
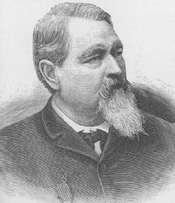
 Charles Dougherty Charles Dougherty |
Democratic |
March 4, 1885 – March 3, 1889 |
|
 Robert Bullock Robert Bullock |
Democratic |
March 4, 1889 – March 3, 1893 |
|
 Charles M. Cooper Charles M. Cooper |
Democratic |
March 4, 1893 – March 3, 1897 |
|
 Robert W. Davis Robert W. Davis |
Democratic |
March 4, 1897 – March 3, 1905 |
|
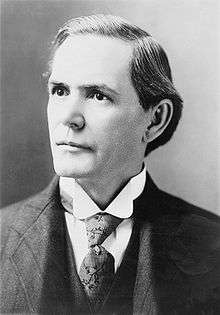 Frank Clark Frank Clark |
Democratic |
March 4, 1905 – March 3, 1925 |
|
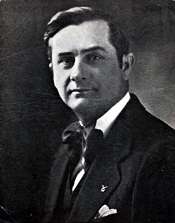 Robert A. Green Robert A. Green |
Democratic |
March 4, 1925 – January 3, 1943 |
Redistricted to the At-large district |
 Emory H. Price Emory H. Price |
Democratic |
January 3, 1943 – January 3, 1949 |
|
 Charles E. Bennett Charles E. Bennett |
Democratic |
January 3, 1949 – January 3, 1967 |
Redistricted to the 3rd district |
 Don Fuqua Don Fuqua |
Democratic |
January 3, 1967 – January 3, 1987 |
Redistricted from the 9th district |
 James W. Grant James W. Grant |
Democratic |
January 3, 1987 – February 21, 1989 |
Changed political affiliation |
| Republican |
February 21, 1989 – January 3, 1991 |
Defeated |
 Pete Peterson Pete Peterson |
Democratic |
January 3, 1991 – January 3, 1997 |
Retired |
 Allen Boyd Allen Boyd |
Democratic |
January 3, 1997 – January 3, 2011 |
Defeated |
 Steve Southerland Steve Southerland |
Republican |
January 3, 2011 – January 3, 2015 |
Defeated |
.jpg) Gwen Graham Gwen Graham |
Democratic |
January 3, 2015 – January 3, 2017 |
Retired |
 Neal Dunn Neal Dunn |
Republican |
January 3, 2017 – Present |
Incumbent |
As of January 2017, there are six former members of the U.S. House of Representatives from Florida's 2nd congressional district who are currently living at this time.
Historical district boundaries
.tif.png)
