Flood
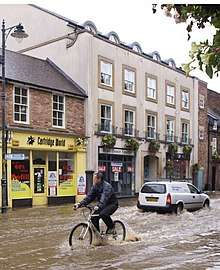


A flood is an overflow of water that submerges land that is usually dry.[1] The European Union (EU) Floods Directive defines a flood as a covering by water of land not normally covered by water.[2] In the sense of "flowing water", the word may also be applied to the inflow of the tide. Floods are an area of study of the discipline hydrology and are of significant concern in agriculture, civil engineering and public health.
Flooding may occur as an overflow of water from water bodies, such as a river, lake, or ocean, in which the water overtops or breaks levees, resulting in some of that water escaping its usual boundaries,[3] or it may occur due to an accumulation of rainwater on saturated ground in an areal flood. While the size of a lake or other body of water will vary with seasonal changes in precipitation and snow melt, these changes in size are unlikely to be considered significant unless they flood property or drown domestic animals.
Floods can also occur in rivers when the flow rate exceeds the capacity of the river channel, particularly at bends or meanders in the waterway. Floods often cause damage to homes and businesses if they are in the natural flood plains of rivers. While riverine flood damage can be eliminated by moving away from rivers and other bodies of water, people have traditionally lived and worked by rivers because the land is usually flat and fertile and because rivers provide easy travel and access to commerce and industry.
Some floods develop slowly, while others such as flash floods, can develop in just a few minutes and without visible signs of rain. Additionally, floods can be local, impacting a neighborhood or community, or very large, affecting entire river basins.
Etymology
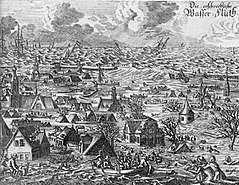
The word "flood" comes from the Old English flod, a word common to Germanic languages (compare German Flut, Dutch vloed from the same root as is seen in flow, float; also compare with Latin fluctus, flumen). Deluge myths are mythical stories of a great flood sent by a deity or deities to destroy civilization as an act of divine retribution, and they are featured in the mythology of many cultures.
Principal types
Areal
Floods can happen on flat or low-lying areas when water is supplied by rainfall or snowmelt more rapidly than it can either infiltrate or run off. The excess accumulates in place, sometimes to hazardous depths. Surface soil can become saturated, which effectively stops infiltration, where the water table is shallow, such as a floodplain, or from intense rain from one or a series of storms. Infiltration also is slow to negligible through frozen ground, rock, concrete, paving, or roofs. Areal flooding begins in flat areas like floodplains and in local depressions not connected to a stream channel, because the velocity of overland flow depends on the surface slope. Endorheic basins may experience areal flooding during periods when precipitation exceeds evaporation.[4]
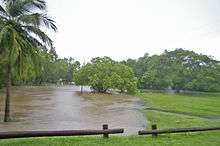
Riverine (Channel)
Floods occur in all types of river and stream channels, from the smallest ephemeral streams in humid zones to normally-dry channels in arid climates to the world's largest rivers. When overland flow occurs on tilled fields, it can result in a muddy flood where sediments are picked up by run off and carried as suspended matter or bed load. Localized flooding may be caused or exacerbated by drainage obstructions such as landslides, ice, debris, or beaver dams.
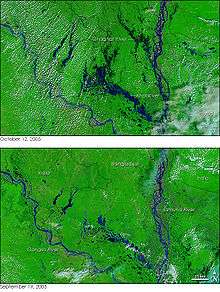
Slow-rising floods most commonly occur in large rivers with large catchment areas. The increase in flow may be the result of sustained rainfall, rapid snow melt, monsoons, or tropical cyclones. However, large rivers may have rapid flooding events in areas with dry climate, since they may have large basins but small river channels and rainfall can be very intense in smaller areas of those basins.
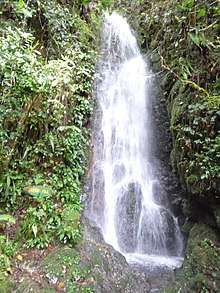
Rapid flooding events, including flash floods, more often occur on smaller rivers, rivers with steep valleys, rivers that flow for much of their length over impermeable terrain, or normally-dry channels. The cause may be localized convective precipitation (intense thunderstorms) or sudden release from an upstream impoundment created behind a dam, landslide, or glacier. In one instance, a flash flood killed eight people enjoying the water on a Sunday afternoon at a popular waterfall in a narrow canyon. Without any observed rainfall, the flow rate increased from about 50 to 1,500 cubic feet per second (1.4 to 42 m3/s) in just one minute.[5] Two larger floods occurred at the same site within a week, but no one was at the waterfall on those days. The deadly flood resulted from a thunderstorm over part of the drainage basin, where steep, bare rock slopes are common and the thin soil was already saturated.
Flash floods are the most common flood type in normally-dry channels in arid zones, known as arroyos in the southwest United States and many other names elsewhere. In that setting, the first flood water to arrive is depleted as it wets the sandy stream bed. The leading edge of the flood thus advances more slowly than later and higher flows. As a result, the rising limb of the hydrograph becomes ever quicker as the flood moves downstream, until the flow rate is so great that the depletion by wetting soil becomes insignificant.
Estuarine and coastal
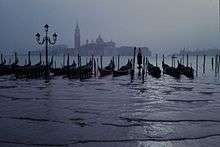
Flooding in estuaries is commonly caused by a combination of sea tidal surges caused by winds and low barometric pressure, and they may be exacerbated by high upstream river flow.
Coastal areas may be flooded by storm events at sea, resulting in waves over-topping defenses or in severe cases by tsunami or tropical cyclones. A storm surge, from either a tropical cyclone or an extratropical cyclone, falls within this category. Research from the NHC (National Hurricane Center) explains: "Storm surge is an abnormal rise of water generated by a storm, over and above the predicted astronomical tides. Storm surge should not be confused with storm tide, which is defined as the water level rise due to the combination of storm surge and the astronomical tide. This rise in water level can cause extreme flooding in coastal areas particularly when storm surge coincides with normal high tide, resulting in storm tides reaching up to 20 feet or more in some cases."[6]
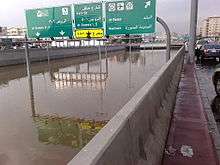
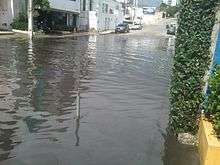
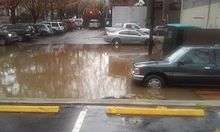
Urban flooding
Urban flooding is the inundation of land or property in a built environment, particularly in more densely populated areas, caused by rainfall overwhelming the capacity of drainage systems, such as storm sewers. Although sometimes triggered by events such as flash flooding or snowmelt, urban flooding is a condition, characterized by its repetitive and systemic impacts on communities, that can happen regardless of whether or not affected communities are located within designated floodplains or near any body of water.[7] Aside from potential overflow of rivers and lakes, snowmelt, stormwater or water released from damaged water mains may accumulate on property and in public rights-of-way, seep through building walls and floors, or backup into buildings through sewer pipes, toilets and sinks.
In urban areas, flood effects can be exacerbated by existing paved streets and roads, which increase the speed of flowing water.
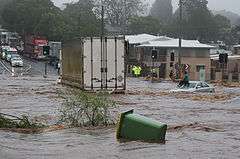
The flood flow in urbanized areas constitutes a hazard to both the population and infrastructure. Some recent catastrophes include the inundations of Nîmes (France) in 1998 and Vaison-la-Romaine (France) in 1992, the flooding of New Orleans (USA) in 2005, and the flooding in Rockhampton, Bundaberg, Brisbane during the 2010–2011 summer in Queensland (Australia). Flood flows in urban environments have been studied relatively recently despite many centuries of flood events.[8] Some recent research has considered the criteria for safe evacuation of individuals in flooded areas.[9]
Catastrophic
Catastrophic riverine flooding is usually associated with major infrastructure failures such as the collapse of a dam, but they may also be caused by drainage channel modification from a landslide, earthquake or volcanic eruption. Examples include outburst floods and lahars. Tsunamis can cause catastrophic coastal flooding, most commonly resulting from undersea earthquakes.
Causes

Upslope factors
The amount, location, and timing of water reaching a drainage channel from natural precipitation and controlled or uncontrolled reservoir releases determines the flow at downstream locations. Some precipitation evaporates, some slowly percolates through soil, some may be temporarily sequestered as snow or ice, and some may produce rapid runoff from surfaces including rock, pavement, roofs, and saturated or frozen ground. The fraction of incident precipitation promptly reaching a drainage channel has been observed from nil for light rain on dry, level ground to as high as 170 percent for warm rain on accumulated snow.[10]
Most precipitation records are based on a measured depth of water received within a fixed time interval. Frequency of a precipitation threshold of interest may be determined from the number of measurements exceeding that threshold value within the total time period for which observations are available. Individual data points are converted to intensity by dividing each measured depth by the period of time between observations. This intensity will be less than the actual peak intensity if the duration of the rainfall event was less than the fixed time interval for which measurements are reported. Convective precipitation events (thunderstorms) tend to produce shorter duration storm events than orographic precipitation. Duration, intensity, and frequency of rainfall events are important to flood prediction. Short duration precipitation is more significant to flooding within small drainage basins.[11]
The most important upslope factor in determining flood magnitude is the land area of the watershed upstream of the area of interest. Rainfall intensity is the second most important factor for watersheds of less than approximately 30 square miles or 80 square kilometres. The main channel slope is the second most important factor for larger watersheds. Channel slope and rainfall intensity become the third most important factors for small and large watersheds, respectively.[12]
Time of Concentration is the time required for runoff from the most distant point of the upstream drainage area to reach the point of the drainage channel controlling flooding of the area of interest. The time of concentration defines the critical duration of peak rainfall for the area of interest.[13] The critical duration of intense rainfall might be only a few minutes for roof and parking lot drainage structures, while cumulative rainfall over several days would be critical for river basins.
Downslope factors
Water flowing downhill ultimately encounters downstream conditions slowing movement. The final limitation in coastal flooding lands is often the ocean or some coastal flooding bars which form natural lakes. In flooding low lands, elevation changes such as tidal fluctuations are significant determinants of coastal and estuarine flooding. Less predictable events like tsunamis and storm surges may also cause elevation changes in large bodies of water. Elevation of flowing water is controlled by the geometry of the flow channel and, especially, by depth of channel, speed of flow and amount of sediments in it [12] Flow channel restrictions like bridges and canyons tend to control water elevation above the restriction. The actual control point for any given reach of the drainage may change with changing water elevation, so a closer point may control for lower water levels until a more distant point controls at higher water levels.
Effective flood channel geometry may be changed by growth of vegetation, accumulation of ice or debris, or construction of bridges, buildings, or levees within the flood channel.
Coincidence
Extreme flood events often result from coincidence such as unusually intense, warm rainfall melting heavy snow pack, producing channel obstructions from floating ice, and releasing small impoundments like beaver dams.[14] Coincident events may cause extensive flooding to be more frequent than anticipated from simplistic statistical prediction models considering only precipitation runoff flowing within unobstructed drainage channels.[15] Debris modification of channel geometry is common when heavy flows move uprooted woody vegetation and flood-damaged structures and vehicles, including boats and railway equipment. Recent field measurements during the 2010–11 Queensland floods showed that any criterion solely based upon the flow velocity, water depth or specific momentum cannot account for the hazards caused by velocity and water depth fluctuations.[8] These considerations ignore further the risks associated with large debris entrained by the flow motion.[9]
Some researchers have mentioned the storage effect in urban areas with transportation corridors created by cut and fill. Culverted fills may be converted to impoundments if the culverts become blocked by debris, and flow may be diverted along streets. Several studies have looked into the flow patterns and redistribution in streets during storm events and the implication on flood modelling.[16]
Effects
Primary effects
The primary effects of flooding include loss of life, damage to buildings and other structures, including bridges, sewerage systems, roadways, and canals.
Floods also frequently damage power transmission and sometimes power generation, which then has knock-on effects caused by the loss of power. This includes loss of drinking water treatment and water supply, which may result in loss of drinking water or severe water contamination. It may also cause the loss of sewage disposal facilities. Lack of clean water combined with human sewage in the flood waters raises the risk of waterborne diseases, which can include typhoid, giardia, cryptosporidium, cholera and many other diseases depending upon the location of the flood.
Damage to roads and transport infrastructure may make it difficult to mobilize aid to those affected or to provide emergency health treatment.
Flood waters typically inundate farm land, making the land unworkable and preventing crops from being planted or harvested, which can lead to shortages of food both for humans and farm animals. Entire harvests for a country can be lost in extreme flood circumstances. Some tree species may not survive prolonged flooding of their root systems.[17]
Secondary and long-term effects
Economic hardship due to a temporary decline in tourism, rebuilding costs, or food shortages leading to price increases is a common after-effect of severe flooding. The impact on those affected may cause psychological damage to those affected, in particular where deaths, serious injuries and loss of property occur.
Urban flooding can lead to chronically wet houses, which are linked to an increase in respiratory problems and other illnesses.[18] Urban flooding also has significant economic implications for affected neighborhoods. In the United States, industry experts estimate that wet basements can lower property values by 10–25 percent and are cited among the top reasons for not purchasing a home.[19] According to the U.S. Federal Emergency Management Agency (FEMA), almost 40 percent of small businesses never reopen their doors following a flooding disaster.[20] In the United States, insurance is available against flood damage to both homes and businesses.[21]
Benefits
Floods (in particular more frequent or smaller floods) can also bring many benefits, such as recharging ground water, making soil more fertile and increasing nutrients in some soils. Flood waters provide much needed water resources in arid and semi-arid regions where precipitation can be very unevenly distributed throughout the year and kills pests in the farming land. Freshwater floods particularly play an important role in maintaining ecosystems in river corridors and are a key factor in maintaining floodplain biodiversity.[22] Flooding can spread nutrients to lakes and rivers, which can lead to increased biomass and improved fisheries for a few years.
For some fish species, an inundated floodplain may form a highly suitable location for spawning with few predators and enhanced levels of nutrients or food.[23] Fish, such as the weather fish, make use of floods in order to reach new habitats. Bird populations may also profit from the boost in food production caused by flooding.[24]
Periodic flooding was essential to the well-being of ancient communities along the Tigris-Euphrates Rivers, the Nile River, the Indus River, the Ganges and the Yellow River among others. The viability of hydropower, a renewable source of energy, is also higher in flood prone regions.
Flood safety planning
.jpg)
At the most basic level, the best defense against floods is to seek higher ground for high-value uses while balancing the foreseeable risks with the benefits of occupying flood hazard zones.[25]:22–23 Critical community-safety facilities, such as hospitals, emergency-operations centers, and police, fire, and rescue services, should be built in areas least at risk of flooding. Structures, such as bridges, that must unavoidably be in flood hazard areas should be designed to withstand flooding. Areas most at risk for flooding could be put to valuable uses that could be abandoned temporarily as people retreat to safer areas when a flood is imminent.
Planning for flood safety involves many aspects of analysis and engineering, including:
- observation of previous and present flood heights and inundated areas,
- statistical, hydrologic, and hydraulic model analyses,
- mapping inundated areas and flood heights for future flood scenarios,
- long-term land use planning and regulation,
- engineering design and construction of structures to control or withstand flooding,
- intermediate-term monitoring, forecasting, and emergency-response planning, and
- short-term monitoring, warning, and response operations.
Each topic presents distinct yet related questions with varying scope and scale in time, space, and the people involved. Attempts to understand and manage the mechanisms at work in floodplains have been made for at least six millennia.[26]
In the United States, the Association of State Floodplain Managers works to promote education, policies, and activities that mitigate current and future losses, costs, and human suffering caused by flooding and to protect the natural and beneficial functions of floodplains – all without causing adverse impacts.[27] A portfolio of best practice examples for disaster mitigation in the United States is available from the Federal Emergency Management Agency.[28]
Control
In many countries around the world, waterways prone to floods are often carefully managed. Defenses such as detention basins, levees,[29] bunds, reservoirs, and weirs are used to prevent waterways from overflowing their banks. When these defenses fail, emergency measures such as sandbags or portable inflatable tubes are often used to try to stem flooding. Coastal flooding has been addressed in portions of Europe and the Americas with coastal defenses, such as sea walls, beach nourishment, and barrier islands.
In the riparian zone near rivers and streams, erosion control measures can be taken to try to slow down or reverse the natural forces that cause many waterways to meander over long periods of time. Flood controls, such as dams, can be built and maintained over time to try to reduce the occurrence and severity of floods as well. In the United States, the U.S. Army Corps of Engineers maintains a network of such flood control dams.
In areas prone to urban flooding, one solution is the repair and expansion of man-made sewer systems and stormwater infrastructure. Another strategy is to reduce impervious surfaces in streets, parking lots and buildings through natural drainage channels, porous paving, and wetlands (collectively known as green infrastructure or sustainable urban drainage systems (SUDS)). Areas identified as flood-prone can be converted into parks and playgrounds that can tolerate occasional flooding. Ordinances can be adopted to require developers to retain stormwater on site and require buildings to be elevated, protected by floodwalls and levees, or designed to withstand temporary inundation. Property owners can also invest in solutions themselves, such as re-landscaping their property to take the flow of water away from their building and installing rain barrels, sump pumps, and check valves.
Analysis of flood information
A series of annual maximum flow rates in a stream reach can be analyzed statistically to estimate the 100-year flood and floods of other recurrence intervals there. Similar estimates from many sites in a hydrologically similar region can be related to measurable characteristics of each drainage basin to allow indirect estimation of flood recurrence intervals for stream reaches without sufficient data for direct analysis.
Physical process models of channel reaches are generally well understood and will calculate the depth and area of inundation for given channel conditions and a specified flow rate, such as for use in floodplain mapping and flood insurance. Conversely, given the observed inundation area of a recent flood and the channel conditions, a model can calculate the flow rate. Applied to various potential channel configurations and flow rates, a reach model can contribute to selecting an optimum design for a modified channel. Various reach models are available as of 2015, either 1D models (flood levels measured in the channel) or 2D models (variable flood depths measured across the extent of a floodplain). HEC-RAS,[30] the Hydraulic Engineering Center model, is among the most popular software, if only because it is available free of charge. Other models such as TUFLOW[31] combine 1D and 2D components to derive flood depths across both river channels and the entire floodplain.
Physical process models of complete drainage basins are even more complex. Although many processes are well understood at a point or for a small area, others are poorly understood at all scales, and process interactions under normal or extreme climatic conditions may be unknown. Basin models typically combine land-surface process components (to estimate how much rainfall or snowmelt reaches a channel) with a series of reach models. For example, a basin model can calculate the runoff hydrograph that might result from a 100-year storm, although the recurrence interval of a storm is rarely equal to that of the associated flood. Basin models are commonly used in flood forecasting and warning, as well as in analysis of the effects of land use change and climate change.
Flood forecasting
Anticipating floods before they occur allows for precautions to be taken and people to be warned [32] so that they can be prepared in advance for flooding conditions. For example, farmers can remove animals from low-lying areas and utility services can put in place emergency provisions to re-route services if needed. Emergency services can also make provisions to have enough resources available ahead of time to respond to emergencies as they occur. People can evacuate areas to be flooded.
In order to make the most accurate flood forecasts for waterways, it is best to have a long time-series of historical data that relates stream flows to measured past rainfall events.[33] Coupling this historical information with real-time knowledge about volumetric capacity in catchment areas, such as spare capacity in reservoirs, ground-water levels, and the degree of saturation of area aquifers is also needed in order to make the most acrate flood forecasts.
Radar estimates of rainfall and general weather forecasting techniques are also important components of good flood forecasting. In areas where good quality data is available, the intensity and height of a flood can be predicted with fairly good accuracy and plenty of lead time. The output of a flood forecast is typically a maximum expected water level and the likely time of its arrival at key locations along a waterway,[34] and it also may allow for the computation of the likely statistical return period of a flood. In many developed countries, urban areas at risk of flooding are protected against a 100-year flood – that is a flood that has a probability of around 63% of occurring in any 100-year period of time.
According to the U.S. National Weather Service (NWS) Northeast River Forecast Center (RFC) in Taunton, Massachusetts, a rule of thumb for flood forecasting in urban areas is that it takes at least 1 inch (25 mm) of rainfall in around an hour's time in order to start significant ponding of water on impermeable surfaces. Many NWS RFCs routinely issue Flash Flood Guidance and Headwater Guidance, which indicate the general amount of rainfall that would need to fall in a short period of time in order to cause flash flooding or flooding on larger water basins.[35]
In the United States, an integrated approach to real-time hydrologic computer modelling utilizes observed data from the U.S. Geological Survey (USGS),[36] various cooperative observing networks,[37] various automated weather sensors, the NOAA National Operational Hydrologic Remote Sensing Center (NOHRSC),[38] various hydroelectric companies, etc. combined with quantitative precipitation forecasts (QPF) of expected rainfall and/or snow melt to generate daily or as-needed hydrologic forecasts.[34] The NWS also cooperates with Environment Canada on hydrologic forecasts that affect both the USA and Canada, like in the area of the Saint Lawrence Seaway.
The Global Flood Monitoring System, "GFMS," a computer tool which maps flood conditions worldwide, is available online. Users anywhere in the world can use GFMS to determine when floods may occur in their area. GFMS uses precipitation data from NASA's Earth observing satellites and the Global Precipitation Measurement satellite, "GPM." Rainfall data from GPM is combined with a land surface model that incorporates vegetation cover, soil type, and terrain to determine how much water is soaking into the ground, and how much water is flowing into streamflow.
Users can view statistics for rainfall, streamflow, water depth, and flooding every 3 hours, at each 12 kilometer gridpoint on a global map. Forecasts for these parameters are 5 days into the future. Users can zoom in to see inundation maps (areas estimated to be covered with water) in 1 kilometer resolution.[39][40]
Deadliest floods
Below is a list of the deadliest floods worldwide, showing events with death tolls at or above 100,000 individuals.
| Death toll | Event | Location | Date |
|---|---|---|---|
| 2,500,000–3,700,000[41] | 1931 China floods | China | 1931 |
| 900,000–2,000,000 | 1887 Yellow River flood | China | 1887 |
| 500,000–700,000 | 1938 Yellow River flood | China | 1938 |
| 231,000 | Banqiao Dam failure, result of Typhoon Nina. Approximately 86,000 people died from flooding and another 145,000 died during subsequent disease. | China | 1975 |
| 230,000 | 2004 Indian Ocean tsunami | Indonesia | 2004 |
| 145,000 | 1935 Yangtze river flood | China | 1935 |
| 100,000+ | St. Felix's flood, storm surge | Netherlands | 1530 |
| 100,000 | Hanoi and Red River Delta flood | North Vietnam | 1971 |
| 100,000 | 1911 Yangtze river flood | China | 1911 |
In myth and religion
Flood myths (great, civilization-destroying floods) are widespread in many cultures.
Flood events in the form of divine retribution have also been described in religious text. As a prime example, the Genesis flood narrative plays a prominent role in Judaism, Christianity and Islam.
See also
- Cold drop
- Cloudburst
- Diversion dam
- Emergency management: Disaster preparedness and disaster response.
- Flash flood guidance system
- Flood alert
- Flood pulse concept
- Flood risk assessment (FRA)
- International Rescue Corps
- Lifesaving
- List of floods
- Mudflow
- Search and rescue
- SMS (hydrology software)
- Storm drain
- Washout
- Floods by land:
References
- ↑ MSN Encarta Dictionary, Flood, Retrieved on 2006-12-28, Archived on 2009-10-31
- ↑ "Directive 2007/60/EC Chapter 1 Article2".
- ↑ Glossary of Meteorology (June 2000) Flood Archived 2007-08-24 at the Wayback Machine., Retrieved on 2009-01-09
- ↑ Jones, Myrtle (2000). "Ground-water flooding in glacial terrain of southern Puget Sound, Washington". Retrieved 2015-07-23.
- ↑ Hjalmarson, Hjalmar W. (December 1984). "Flash Flood in Tanque Verde Creek, Tucson, Arizona". Journal of Hydraulic Engineering. 110 (12): 1841–1852. doi:10.1061/(ASCE)0733-9429(1984)110:12(1841).
- ↑ "Storm Surge Overview". noaa.gov. Retrieved 3 December 2015.
- ↑ Center for Neighborhood Technology, Chicago IL, "The Prevalence and Cost of Urban Flooding", May 2013
- 1 2 Brown, Richard; Chanson, Hubert; McIntosh, Dave; Madhani, Jay (2011). Turbulent Velocity and Suspended Sediment Concentration Measurements in an Urban Environment of the Brisbane River Flood Plain at Gardens Point on 12–13 January 2011. Hydraulic Model Report No. CH83/11. p. 120. ISBN 978-1-74272-027-2.
- 1 2 Chanson, H., Brown, R., McIntosh, D. (26 June 2014). "Human body stability in floodwaters: The 2011 flood in Brisbane CBD". In L. TOOMBES. Hydraulic structures and society - Engineering challenges and extremes. Brisbane, Australia: Proceedings of the 5th IAHR International Symposium on Hydraulic Structures (ISHS2014). pp. 1–9. doi:10.14264/uql.2014.48. ISBN 978-1-74272-115-6.
- ↑ Babbitt, Harold E. & Doland, James J., Water Supply Engineering, McGraw-Hill Book Company, 1949
- ↑ Simon, Andrew L., Basic Hydraulics, John Wiley & Sons, 1981, ISBN 0-471-07965-0
- 1 2 Simon, Andrew L., Practical Hydraulics, John Wiley & Sons, 1981, ISBN 0-471-05381-3
- ↑ Urquhart, Leonard Church, Civil Engineering Handbook, McGraw-Hill Book Company, 1959
- ↑ Abbett, Robert W., American Civil Engineering Practice, John Wiley & Sons, 1956
- ↑ United States Department of the Interior, Bureau of Reclamation, Design of Small Dams, United States Government Printing Office, 1973
- ↑ Werner, MGF; Hunter, NM; Bates, PD (2006). "Identifiability of Distributed Floodplain Roughness Values in Flood Extent Estimation". Journal of Hydrology. 314 (1–4): 139–157. Bibcode:2005JHyd..314..139W. doi:10.1016/j.jhydrol.2005.03.012.
- ↑ Stephen Bratkovich, Lisa Burban, et al., "Flooding and its Effects on Trees", USDA Forest Service, Northeastern Area State and Private Forestry, St. Paul, MN, September 1993
- ↑ Indoor Air Quality (IAQ) Scientific Findings Resource Bank (IAQ-SFRB), "Health Risks or Dampness or Mold in Houses" Archived 2013-10-04 at the Wayback Machine.
- ↑ Center for Neighborhood Technology, Chicago IL "The Prevalence and Cost of Urban Flooding", May 2013
- ↑ "Protecting Your Businesses", last updated March 2013
- ↑ "National Flood Insurance Program". FloodSmart.gov. Retrieved 2015-07-06.
- ↑ WMO/GWP Associated Programme on Flood Management, "Environmental Aspects of Integrated Flood Management", 2007
- ↑ Extension of the Flood Pulse Concept, Retrieved on 2012-06-12
- ↑ Birdlife soars above Botswana's floodplains Archived 2011-02-09 at the Wayback Machine. (2010-10-15), Retrieved on 2012-06-12
- ↑ Eychaner, J.H. (2015) Lessons from a 500-year record of flood elevations, Association of State Floodplain Managers, Technical Report 7, Accessed 2015-06-27
- ↑ Dyhouse, G., "Flood modelling Using HEC-RAS (First Edition)", Haestad Press, Waterbury (USA) 2003
- ↑ "Association of State Floodplain Managers". Retrieved 2015-07-13.
- ↑ "Best Practices Portfolio". Federal Emergency Management Agency. Retrieved 2015-07-06.
- ↑ Henry Petroski (2006). Levees and Other Raised Ground. 94. American Scientist. pp. 7–11.
- ↑ United States Army Corps of Engineers, Davis, CA, Hydrologic Engineering Center
- ↑ BMT WBM Pty Ltd., Brisbane, Queensland, "TUFLOW Flood and Tide Simulation Software" Archived 2008-06-27 at the Wayback Machine.
- ↑ "Flood Warnings". Environment Agency. 2013-04-30. Retrieved 2013-06-17.
- ↑ "Australia rainfall and river conditions". Bom.gov.au. Retrieved 2013-06-17.
- 1 2 Connelly, Brian A; Braatz, Dean T; Halquist, John B; Deweese, Michael M; Larson, Lee; Ingram, John J (1999). "Advanced Hydrologic Prediction System". Journal of Geophysical Research. 104 (D16): 19, 655. Bibcode:1999JGR...10419655C. doi:10.1029/1999JD900051. Retrieved 4 February 2013.
- ↑ "FFG". Retrieved 29 January 2013.
- ↑ "WaterWatch". 4 February 2013. Retrieved 4 February 2013.
- ↑ "Community Collaborative Rain, Hail and Snow Network". Retrieved 4 February 2013.
- ↑ "NOHRSC". 2 May 2012. Retrieved 4 February 2013.
- ↑ "Predicting Floods". science.nasa.gov. Retrieved 2015-07-22.
- ↑ ScienceCasts: Predicting Floods. YouTube. 21 July 2015. Retrieved 13 January 2016 – via YouTube.
- ↑ Worst Natural Disasters In History Archived 2008-04-21 at the Wayback Machine. (2012-06-07), Retrieved on 2012-06-12
Bibliography
- O'Connor, Jim E. & John E. Costa (2004) The World's Largest Floods, Past and Present: Their Causes and Magnitudes [Circular 1254], Washington, D.C.: U.S. Department of the Interior, U.S. Geological Survey.
- Thompson, M.T., (1964). Historical Floods in New England [Geological Survey Water-Supply Paper 1779-M]. Washington, D.C.: United States Government Printing Office.
- Powell, W. Gabe, 2009, Identifying Land Use/Land Cover (LULC) Using National Agriculture Imagery Program (NAIP) Data as a Hydrologic Model Input for Local Flood Plain Management, Applied Research Project, Texas State University–San Marcos
External links
| Wikimedia Commons has media related to Floods in India. |
- Associated Programme on Flood Management from the World Meteorological Organization
- Flood and natural hazard research from Bushfire and Natural Hazards CRC
- International Flood Initiative from UNESCO
| Overview | |||||||||||||
|---|---|---|---|---|---|---|---|---|---|---|---|---|---|
| Disasters |
| ||||||||||||
| Countermeasures | |||||||||||||
| Media | |||||||||||||
| Organizations | |||||||||||||
| |||||||||||||
| Air |
|  | ||||
|---|---|---|---|---|---|---|
| Energy | ||||||
| Land | ||||||
| Life | ||||||
| Water |
| |||||
| Related |
| |||||
| ||||||
| ||||||
| Authority control |
|---|