Air quality index
An air quality index (AQI) is a number used by government agencies [1] to communicate to the public how polluted the air currently is or how polluted it is forecast to become.[2][3] As the AQI increases, an increasingly large percentage of the population is likely to experience increasingly severe adverse health effects. Different countries have their own air quality indices, corresponding to different national air quality standards. Some of these are the Air Quality Health Index (Canada), the Air Pollution Index (Malaysia), and the Pollutant Standards Index (Singapore).

Definition and usage
Computation of the AQI requires an air pollutant concentration over a specified averaging period, obtained from an air monitor or model. Taken together, concentration and time represent the dose of the air pollutant. Health effects corresponding to a given dose are established by epidemiological research.[4] Air pollutants vary in potency, and the function used to convert from air pollutant concentration to AQI varies by pollutant. Its air quality index values are typically grouped into ranges. Each range is assigned a descriptor, a color code, and a standardized public health advisory.
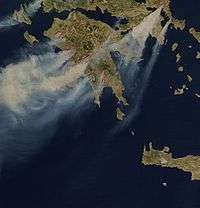
The AQI can increase due to an increase of air emissions (for example, during rush hour traffic or when there is an upwind forest fire) or from a lack of dilution of air pollutants. Stagnant air, often caused by an anticyclone, temperature inversion, or low wind speeds lets air pollution remain in a local area, leading to high concentrations of pollutants, chemical reactions between air contaminants and hazy conditions.[5]
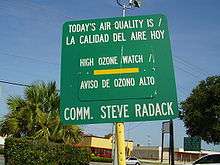
On a day when the AQI is predicted to be elevated due to fine particle pollution, an agency or public health organization might:
- advise sensitive groups, such as the elderly, children, and those with respiratory or cardiovascular problems to avoid outdoor exertion.[6]
- declare an "action day" to encourage voluntary measures to reduce air emissions, such as using public transportation.[7]
- recommend the use of masks to keep fine particles from entering the lungs[8]
During a period of very poor air quality, such as an air pollution episode, when the AQI indicates that acute exposure may cause significant harm to the public health, agencies may invoke emergency plans that allow them to order major emitters (such as coal burning industries) to curtail emissions until the hazardous conditions abate.[9]
Most air contaminants do not have an associated AQI. Many countries monitor ground-level ozone, particulates, sulfur dioxide, carbon monoxide and nitrogen dioxide, and calculate air quality indices for these pollutants.[10]
The definition of the AQI in a particular nation reflects the discourse surrounding the development of national air quality standards in that nation.[11] A website allowing government agencies anywhere in the world to submit their real-time air monitoring data for display using a common definition of the air quality index has recently become available.[12]
Indices by location
Canada
Air quality in Canada has been reported for many years with provincial Air Quality Indices (AQIs). Significantly, AQI values reflect air quality management objectives, which are based on the lowest achievable emissions rate, and not exclusively concern for human health. The Air Quality Health Index or (AQHI) is a scale designed to help understand the impact of air quality on health. It is a health protection tool used to make decisions to reduce short-term exposure to air pollution by adjusting activity levels during increased levels of air pollution. The Air Quality Health Index also provides advice on how to improve air quality by proposing behavioural change to reduce the environmental footprint. This index pays particular attention to people who are sensitive to air pollution. It provides them with advice on how to protect their health during air quality levels associated with low, moderate, high and very high health risks.
The Air Quality Health Index provides a number from 1 to 10+ to indicate the level of health risk associated with local air quality. On occasion, when the amount of air pollution is abnormally high, the number may exceed 10. The AQHI provides a local air quality current value as well as a local air quality maximums forecast for today, tonight, and tomorrow, and provides associated health advice.[13]
| 1 | 2 | 3 | 4 | 5 | 6 | 7 | 8 | 9 | 10 | + |
| Risk: | Low (1–3) | Moderate (4–6) | High (7–10) | Very high (above 10) |
| Health Risk | Air Quality Health Index | Health Messages | |
|---|---|---|---|
| At Risk population | *General Population | ||
| Low | 1–3 | Enjoy your usual outdoor activities. | Ideal air quality for outdoor activities |
| Moderate | 4–6 | Consider reducing or rescheduling strenuous activities outdoors if you are experiencing symptoms. | No need to modify your usual outdoor activities unless you experience symptoms such as coughing and throat irritation. |
| High | 7–10 | Reduce or reschedule strenuous activities outdoors. Children and the elderly should also take it easy. | Consider reducing or rescheduling strenuous activities outdoors if you experience symptoms such as coughing and throat irritation. |
| Very high | Above 10 | Avoid strenuous activities outdoors. Children and the elderly should also avoid outdoor physical exertion. | Reduce or reschedule strenuous activities outdoors, especially if you experience symptoms such as coughing and throat irritation. |
Hong Kong
On the 30 December 2013 Hong Kong replaced the Air Pollution Index with a new index called the Air Quality Health Index.[14] This index, reported by the Environmental Protection Department, is measured on a scale of 1 to 10+ and considers four air pollutants: ozone; nitrogen dioxide; sulphur dioxide and particulate matter (including PM10 and PM2.5). For any given hour the AQHI is calculated from the sum of the percentage excess risk of daily hospital admissions attributable to the 3-hour moving average concentrations of these four pollutants. The AQHIs are grouped into five AQHI health risk categories with health advice provided:[15]
| Health risk category | AQHI |
|---|---|
| Low | 1 |
| 2 | |
| 3 | |
| Medium | 4 |
| 5 | |
| 6 | |
| High | 7 |
| Very High | 8 |
| 9 | |
| 10 | |
| Serious | 10+ |
Each of the health risk categories has advice with it. At the low and moderate levels the public are advised that they can continue normal activities. For the high category, children, the elderly and people with heart or respiratory illnesses are advising to reduce outdoor physical exertion. Above this (very high or serious) the general public are also advised to reduce or avoid outdoor physical exertion.
Mainland China
China's Ministry of Environmental Protection (MEP) is responsible for measuring the level of air pollution in China. As of 1 January 2013, MEP monitors daily pollution level in 163 of its major cities. The AQI level is based on the level of six atmospheric pollutants, namely sulfur dioxide (SO2), nitrogen dioxide (NO2), suspended particulates smaller than 10 μm in aerodynamic diameter (PM10)[16], suspended particulates smaller than 2.5 μm in aerodynamic diameter (PM2.5)[16],carbon monoxide (CO), and ozone (O3) measured at the monitoring stations throughout each city.[17]
AQI Mechanics
An individual score (Individual Air Quality Index, IAQI) is assigned to each pollutant and the final AQI is the highest of these six scores. The final AQI value can be calculated either per hour or per 24 hours. The concentrations of pollutants can be measured quite differently. If the AQI value is calculated hourly, then SO2, NO2, CO concentrations are measured as average per 24h, O3 concentration is measured as average per hour and the moving average per 8h, PM2.5 and PM10 concentrations are measured as average per hour and per 24h. If the AQI value is calculated per 24h, then SO2, NO2, CO, PM2.5 and PM10 concentrations are measured as average per 24h, while O3 concentration is measured as the maximum 1h average and the maximum 24h moving average. The IAQI of each pollutant is calculated according to a formula published by the MEP.[17]
The score for each pollutant is non-linear, as is the final AQI score. Thus an AQI of 300 does not mean twice the pollution of AQI at 150, nor does it mean the air is twice as harmful. The concentration of a pollutant when its IAQI is 100 does not equal twice its concentration when its IAQI is 50, nor does it mean the pollutant is twice as harmful. While an AQI of 50 from day 1 to 182 and AQI of 100 from day 183 to 365 does provide an annual average of 75, it does not mean the pollution is acceptable even if the benchmark of 100 is deemed safe. Because the benchmark is a 24-hour target, and the annual average must match the annual target, it is entirely possible to have safe air every day of the year but still fail the annual pollution benchmark.[17]
AQI and Health Implications (HJ 633—2012)[17]
| AQI | Air Pollution Level | Air Pollution Category | Health Implications | Recommended Precautions |
|---|---|---|---|---|
| 0–50 | Level 1 | Excellent | No health implications. | Everyone can continue their outdoor activities normally. |
| 51–100 | Level 2 | Good | Some pollutants may slightly affect very few hypersensitive individuals. | Only very few hypersensitive people should reduce outdoor activities. |
| 101–150 | Level 3 | Lightly Polluted | Healthy people may experience slight irritations and sensitive individuals will be slightly affected to a larger extent. | Children, seniors and individuals with respiratory or heart diseases should reduce sustained and high-intensity outdoor exercises. |
| 151–200 | Level 4 | Moderately Polluted | Sensitive individuals will experience more serious conditions. The hearts and respiratory systems of healthy people may be affected. | Children, seniors and individuals with respiratory or heart diseases should avoid sustained and high-intensity outdoor exercises. General population should moderately reduce outdoor activities. |
| 201–300 | Level 5 | Heavily Polluted | Healthy people will commonly show symptoms. People with respiratory or heart diseases will be significantly affected and will experience reduced endurance in activities. | Children, seniors and individuals with heart or lung diseases should stay indoors and avoid outdoor activities. General population should reduce outdoor activities. |
| >300 | Level 6 | Severely Polluted | Healthy people will experience reduced endurance in activities and may also show noticeably strong symptoms. Other illnesses may be triggered in healthy people. Elders and the sick should remain indoors and avoid exercise. Healthy individuals should avoid outdoor activities. | Children, seniors and the sick should stay indoors and avoid physical exertion. General population should avoid outdoor activities. |
India
The National Air Quality Index (AQI) was launched in New Delhi on 17 September 2014 under the Swachh Bharat Abhiyan.[18]
The Central Pollution Control Board along with State Pollution Control Boards has been operating National Air Monitoring Program (NAMP) covering 240 cities of the country having more than 342 monitoring stations.[19] An Expert Group comprising medical professionals, air quality experts, academia, advocacy groups, and SPCBs was constituted and a technical study was awarded to IIT Kanpur. IIT Kanpur and the Expert Group recommended an AQI scheme in 2014.[20] While the earlier measuring index was limited to three indicators, the new index measures eight parameters.[21] The continuous monitoring systems that provide data on near real-time basis are installed in New Delhi, Mumbai, Pune and Ahmedabad.[22]
There are six AQI categories, namely Good, Satisfactory, Moderately polluted, Poor, Very Poor, and Severe. The proposed AQI will consider eight pollutants (PM10, PM2.5, NO2, SO2, CO, O3, NH3, and Pb) for which short-term (up to 24-hourly averaging period) National Ambient Air Quality Standards are prescribed.[23] Based on the measured ambient concentrations, corresponding standards and likely health impact, a sub-index is calculated for each of these pollutants. The worst sub-index reflects overall AQI. Likely health impacts for different AQI categories and pollutants have also been suggested, with primary inputs from the medical experts in the group. The AQI values and corresponding ambient concentrations (health breakpoints) as well as associated likely health impacts for the identified eight pollutants are as follows:
| AQI Category (Range) | PM10 (24hr) | PM2.5 (24hr) | NO2 (24hr) | O3 (8hr) | CO (8hr) | SO2 (24hr) | NH3 (24hr) | Pb (24hr) |
| Good (0–50) | 0–50 | 0–30 | 0–40 | 0–50 | 0–1.0 | 0–40 | 0–200 | 0–0.5 |
| Satisfactory (51–100) | 51–100 | 31–60 | 41–80 | 51–100 | 1.1–2.0 | 41–80 | 201–400 | 0.5–1.0 |
| Moderately polluted (101–200) | 101–250 | 61–90 | 81–180 | 101–168 | 2.1–10 | 81–380 | 401–800 | 1.1–2.0 |
| Poor (201–300) | 251–350 | 91–120 | 181–280 | 169–208 | 10–17 | 381–800 | 801–1200 | 2.1–3.0 |
| Very poor (301–400) | 351–430 | 121–250 | 281–400 | 209–748 | 17–34 | 801–1600 | 1200–1800 | 3.1–3.5 |
| Severe (401–500) | 430+ | 250+ | 400+ | 748+ | 34+ | 1600+ | 1800+ | 3.5+ |
| AQI | Associated Health Impacts |
|---|---|
| Good (0–50) | Minimal impact |
| Satisfactory (51–100) | May cause minor breathing discomfort to sensitive people. |
| Moderately polluted (101–200) | May cause breathing discomfort to people with lung disease such as asthma, and discomfort to people with heart disease, children and older adults. |
| Poor (201–300) | May cause breathing discomfort to people on prolonged exposure, and discomfort to people with heart disease. |
| Very poor (301–400) | May cause respiratory illness to the people on prolonged exposure. Effect may be more pronounced in people with lung and heart diseases. |
| Severe (401–500) | May cause respiratory impact even on healthy people, and serious health impacts on people with lung/heart disease. The health impacts may be experienced even during light physical activity. |
Mexico
The air quality in Mexico City is reported in IMECAs. The IMECA is calculated using the measurements of average times of the chemicals ozone (O3), sulphur dioxide (SO2), nitrogen dioxide (NO2), carbon monoxide (CO), particles smaller than 2.5 micrometers (PM2.5), and particles smaller than 10 micrometers (PM10).[24]
Singapore
Singapore uses the Pollutant Standards Index to report on its air quality,[25] with details of the calculation similar but not identical to that used in Malaysia and Hong Kong[26] The PSI chart below is grouped by index values and descriptors, according to the National Environment Agency.[27]
| PSI | Descriptor | General Health Effects |
|---|---|---|
| 0–50 | Good | None |
| 51–100 | Moderate | Few or none for the general population |
| 101–200 | Unhealthy | Mild aggravation of symptoms among susceptible persons i.e. those with underlying conditions such as chronic heart or lung ailments; transient symptoms of irritation e.g. eye irritation, sneezing or coughing in some of the healthy population. |
| 201–300 | Very Unhealthy | Moderate aggravation of symptoms and decreased tolerance in persons with heart or lung disease; more widespread symptoms of transient irritation in the healthy population. |
| 301–400 | Hazardous | Early onset of certain diseases in addition to significant aggravation of symptoms in susceptible persons; and decreased exercise tolerance in healthy persons. |
| Above 400 | Hazardous | PSI levels above 400 may be life-threatening to ill and elderly persons. Healthy people may experience adverse symptoms that affect normal activity. |
South Korea
The Ministry of Environment of South Korea uses the Comprehensive Air-quality Index (CAI) to describe the ambient air quality based on the health risks of air pollution. The index aims to help the public easily understand the air quality and protect people's health. The CAI is on a scale from 0 to 500, which is divided into six categories. The higher the CAI value, the greater the level of air pollution. Of values of the five air pollutants, the highest is the CAI value. The index also has associated health effects and a colour representation of the categories as shown below.[28]
| CAI | Description | Health Implications |
|---|---|---|
| 0–50 | Good | A level that will not impact patients suffering from diseases related to air pollution. |
| 51–100 | Moderate | A level that may have a meager impact on patients in case of chronic exposure. |
| 101–150 | Unhealthy for sensitive groups | A level that may have harmful impacts on patients and members of sensitive groups. |
| 151–250 | Unhealthy | A level that may have harmful impacts on patients and members of sensitive groups (children, aged or weak people), and also cause the general public unpleasant feelings. |
| 251–350 | Very unhealthy | A level that may have a serious impact on patients and members of sensitive groups in case of acute exposure. |
| 351-500 | Hazardous | A level that may have a serious impact on patients and members of sensitive groups in case of acute exposure. |
The N Seoul Tower on Namsan Mountain in central Seoul, South Korea, is illuminated in blue, from sunset to 23:00 and 22:00 in winter, on days where the air quality in Seoul is 45 or less. During the spring of 2012, the Tower was lit up for 52 days, which is four days more than in 2011.[29]
United Kingdom
The most commonly used air quality index in the UK is the Daily Air Quality Index recommended by the Committee on Medical Effects of Air Pollutants (COMEAP).[30] This index has ten points, which are further grouped into 4 bands: low, moderate, high and very high. Each of the bands comes with advice for at-risk groups and the general population.[31]
| Air pollution banding | Value | Health messages for At-risk individuals | Health messages for General population |
|---|---|---|---|
| Low | 1–3 | Enjoy your usual outdoor activities. | Enjoy your usual outdoor activities. |
| Moderate | 4–6 | Adults and children with lung problems, and adults with heart problems, who experience symptoms, should consider reducing strenuous physical activity, particularly outdoors. | Enjoy your usual outdoor activities. |
| High | 7–9 | Adults and children with lung problems, and adults with heart problems, should reduce strenuous physical exertion, particularly outdoors, and particularly if they experience symptoms. People with asthma may find they need to use their reliever inhaler more often. Older people should also reduce physical exertion. | Anyone experiencing discomfort such as sore eyes, cough or sore throat should consider reducing activity, particularly outdoors. |
| Very High | 10 | Adults and children with lung problems, adults with heart problems, and older people, should avoid strenuous physical activity. People with asthma may find they need to use their reliever inhaler more often. | Reduce physical exertion, particularly outdoors, especially if you experience symptoms such as cough or sore throat. |
The index is based on the concentrations of 5 pollutants. The index is calculated from the concentrations of the following pollutants: Ozone, Nitrogen Dioxide, Sulphur Dioxide, PM2.5 (particles with an aerodynamic diameter less than 2.5 μm) and PM10. The breakpoints between index values are defined for each pollutant separately and the overall index is defined as the maximum value of the index. Different averaging periods are used for different pollutants.[31]
| Index | Ozone, Running 8 hourly mean (μg/m3) | Nitrogen Dioxide, Hourly mean (μg/m3) | Sulphur Dioxide, 15 minute mean (μg/m3) | PM2.5 Particles, 24 hour mean (μg/m3) | PM10 Particles, 24 hour mean (μg/m3) |
|---|---|---|---|---|---|
| 1 | 0–33 | 0–67 | 0–88 | 0–11 | 0–16 |
| 2 | 34–66 | 68–134 | 89–177 | 12–23 | 17–33 |
| 3 | 67–100 | 135–200 | 178–266 | 24–35 | 34–50 |
| 4 | 101–120 | 201–267 | 267–354 | 36–41 | 51–58 |
| 5 | 121–140 | 268–334 | 355–443 | 42–47 | 59–66 |
| 6 | 141–160 | 335–400 | 444–532 | 48–53 | 67–75 |
| 7 | 161–187 | 401–467 | 533–710 | 54–58 | 76–83 |
| 8 | 188-213 | 468–534 | 711–887 | 59–64 | 84–91 |
| 9 | 214–240 | 535–600 | 888–1064 | 65–70 | 92–100 |
| 10 | ≥ 241 | ≥ 601 | ≥ 1065 | ≥ 71 | ≥ 101 |
Europe
The Common Air Quality Index (CAQI)[32] is an air quality index used in Europe since 2006.[33] In November 2017, the European Environment Agency announced the European Air Quality Index (EAQI) and started encouraging its use on websites and for other ways of informing the public about air quality.[34]
CAQI
As of 2012, the EU-supported project CiteairII argued that the CAQI had been evaluated on a "large set" of data, and described the CAQI's motivation and definition. CiteairII stated that having an air quality index that would be easy to present to the general public was a major motivation, leaving aside the more complex question of a health-based index, which would require, for example, effects of combined levels of different pollutants. The main aim of the CAQI was to have an index that would encourage wide comparison across the EU, without replacing local indices. CiteairII stated that the "main goal of the CAQI is not to warn people for possible adverse health effects of poor air quality but to attract their attention to urban air pollution and its main source (traffic) and help them decrease their exposure."[33]
The CAQI is a number on a scale from 1 to 100, where a low value means good air quality and a high value means bad air quality. The index is defined in both hourly and daily versions, and separately near roads (a "roadside" or "traffic" index) or away from roads (a "background" index). As of 2012, the CAQI had two mandatory components for the roadside index, NO2 and PM10, and three mandatory components for the background index, NO2, PM10 and O3. It also included optional pollutants PM2.5, CO and SO2. A "sub-index" is calculated for each of the mandatory (and optional if available) components. The CAQI is defined as the sub-index that represents the worst quality among those components.[33]
Some of the key pollutant densities in μg/m3 for the hourly background index, the corresponding sub-indices, and five CAQI ranges and verbal descriptions are as follows.[33]
| Qualitative name | Index or sub-index | Pollutant (hourly) density in μg/m3 | |||
|---|---|---|---|---|---|
| NO2 | PM10 | O3 | PM2.5(optional) | ||
| Very low | 0–25 | 0–50 | 0–25 | 0–60 | 0–15 |
| Low | 25–50 | 50–100 | 25–50 | 60–120 | 15–30 |
| Medium | 50–75 | 100–200 | 50–90 | 120–180 | 30–55 |
| High | 75–100 | 200–400 | 90–180 | 180–240 | 55–110 |
| Very high | >100 | >400 | >180 | >240 | >110 |
Frequently updated CAQI values and maps are shown on the www.airqualitynow.eu and other websites.[32] A separate Year Average Common Air Quality Index (YACAQI) is also defined, in which different pollutant sub-indices are separately normalised to a value typically near unity. For example, the yearly averages of NO2, PM10 and PM2.5 are divided by 40 μg/m^3, 40 μg/m^3 and 20 μg/m^3, respectively. The overall background or traffic YACAQI for a city is the arithmetic mean of a defined subset of these sub-indices.[33]
United States
The United States Environmental Protection Agency (EPA) has developed an Air Quality Index that is used to report air quality. This AQI is divided into six categories indicating increasing levels of health concern. An AQI value over 300 represents hazardous air quality and below 50 the air quality is good.[10]
|
The AQI is based on the five "criteria" pollutants regulated under the Clean Air Act: ground-level ozone, particulate matter, carbon monoxide, sulfur dioxide, and nitrogen dioxide. The EPA has established National Ambient Air Quality Standards (NAAQS) for each of these pollutants in order to protect public health. An AQI value of 100 generally corresponds to the level of the NAAQS for the pollutant.[10] The Clean Air Act (USA) (1990) requires EPA to review its National Ambient Air Quality Standards every five years to reflect evolving health effects information. The Air Quality Index is adjusted periodically to reflect these changes.
Computing the AQI
The air quality index is a piecewise linear function of the pollutant concentration. At the boundary between AQI categories, there is a discontinuous jump of one AQI unit. To convert from concentration to AQI this equation is used:[35]

where:
- = the (Air Quality) index,
- = the pollutant concentration,
- = the concentration breakpoint that is ≤ ,
- = the concentration breakpoint that is ≥ ,
- = the index breakpoint corresponding to ,
- = the index breakpoint corresponding to .


EPA's table of breakpoints is:[36][37][38]
| O3 (ppb) | O3 (ppb) | PM2.5 (µg/m3) | PM10 (µg/m3) | CO (ppm) | SO2 (ppb) | NO2 (ppb) | AQI | AQI |
| Clow - Chigh (avg) | Clow - Chigh (avg) | Clow- Chigh (avg) | Clow - Chigh (avg) | Clow - Chigh (avg) | Clow - Chigh (avg) | Clow - Chigh (avg) | Ilow - Ihigh | Category |
| 0-54 (8-hr) | - | 0.0-12.0 (24-hr) | 0-54 (24-hr) | 0.0-4.4 (8-hr) | 0-35 (1-hr) | 0-53 (1-hr) | 0-50 | Good |
| 55-70 (8-hr) | - | 12.1-35.4 (24-hr) | 55-154 (24-hr) | 4.5-9.4 (8-hr) | 36-75 (1-hr) | 54-100 (1-hr) | 51-100 | Moderate |
| 71-85 (8-hr) | 125-164 (1-hr) | 35.5-55.4 (24-hr) | 155-254 (24-hr) | 9.5-12.4 (8-hr) | 76-185 (1-hr) | 101-360 (1-hr) | 101-150 | Unhealthy for Sensitive Groups |
| 86-105 (8-hr) | 165-204 (1-hr) | 55.5-150.4 (24-hr) | 255-354 (24-hr) | 12.5-15.4 (8-hr) | 186-304 (1-hr) | 361-649 (1-hr) | 151-200 | Unhealthy |
| 106-200 (8-hr) | 205-404 (1-hr) | 150.5-250.4 (24-hr) | 355-424 (24-hr) | 15.5-30.4 (8-hr) | 305-604 (24-hr) | 650-1249 (1-hr) | 201-300 | Very Unhealthy |
| - | 405-504 (1-hr) | 250.5-350.4 (24-hr) | 425-504 (24-hr) | 30.5-40.4 (8-hr) | 605-804 (24-hr) | 1250-1649 (1-hr) | 301-400 | Hazardous |
| - | 505-604 (1-hr) | 350.5-500.4 (24-hr) | 505-604 (24-hr) | 40.5-50.4 (8-hr) | 805-1004 (24-hr) | 1650-2049 (1-hr) | 401-500 |
Suppose a monitor records a 24-hour average fine particle (PM2.5) concentration of 12.0 micrograms per cubic meter. The equation above results in an AQI of:
- ,

corresponding to air quality in the "Good" range. To convert an air pollutant concentration to an AQI, EPA has developed a calculator.[39]
If multiple pollutants are measured at a monitoring site, then the largest or "dominant" AQI value is reported for the location. The ozone AQI between 100 and 300 is computed by selecting the larger of the AQI calculated with a 1-hour ozone value and the AQI computed with the 8-hour ozone value.
8-hour ozone averages do not define AQI values greater than 300; AQI values of 301 or greater are calculated with 1-hour ozone concentrations. 1-hour SO2 values do not define higher AQI values greater than 200. AQI values of 201 or greater are calculated with 24-hour SO2 concentrations.
Real time monitoring data from continuous monitors are typically available as 1-hour averages. However, computation of the AQI for some pollutants requires averaging over multiple hours of data. (For example, calculation of the ozone AQI requires computation of an 8-hour average and computation of the PM2.5 or PM10 AQI requires a 24-hour average.) To accurately reflect the current air quality, the multi-hour average used for the AQI computation should be centered on the current time, but as concentrations of future hours are unknown and are difficult to estimate accurately, EPA uses surrogate concentrations to estimate these multi-hour averages. For reporting the PM2.5, PM10 and ozone air quality indices, this surrogate concentration is called the NowCast. The Nowcast is a particular type of weighted average that provides more weight to the most recent air quality data when air pollution levels are changing.[40][41] There is a free email subscription service for New York inhabitants - AirNYC.[42] Subscribers get notification about AQI values changes for selected location (eg home address), based on air quality conditions.
Public Availability of the AQI
Real time monitoring data and forecasts of air quality that are color-coded in terms of the air quality index are available from EPA's AirNow web site.[43] Historical air monitoring data including AQI charts and maps are available at EPA's AirData website.[44] Detailed map about current AQI level and its two day forecast is available from Aerostate web site.[45]
History of the AQI
The AQI made its debut in 1968, when the National Air Pollution Control Administration undertook an initiative to develop an air quality index and to apply the methodology to Metropolitan Statistical Areas. The impetus was to draw public attention to the issue of air pollution and indirectly push responsible local public officials to take action to control sources of pollution and enhance air quality within their jurisdictions.
Jack Fensterstock, the head of the National Inventory of Air Pollution Emissions and Control Branch, was tasked to lead the development of the methodology and to compile the air quality and emissions data necessary to test and calibrate resultant indices.[46]
The initial iteration of the air quality index used standardized ambient pollutant concentrations to yield individual pollutant indices. These indices were then weighted and summed to form a single total air quality index. The overall methodology could use concentrations that are taken from ambient monitoring data or are predicted by means of a diffusion model. The concentrations were then converted into a standard statistical distribution with a preset mean and standard deviation. The resultant individual pollutant indices are assumed to be equally weighted, although values other than unity can be used. Likewise, the index can incorporate any number of pollutants although it was only used to combine SOx, CO, and TSP because of a lack of available data for other pollutants.
While the methodology was designed to be robust, the practical application for all metropolitan areas proved to be inconsistent due to the paucity of ambient air quality monitoring data, lack of agreement on weighting factors, and non-uniformity of air quality standards across geographical and political boundaries. Despite these issues, the publication of lists ranking metropolitan areas achieved the public policy objectives and led to the future development of improved indices and their routine application.
See also
References
- ↑ "International Air Quality". Retrieved 20 August 2015.
- ↑ National Weather Service Corporate Image Web Team. "NOAA's National Weather Service/Environmental Protection Agency - United States Air Quality Forecast Guidance". Retrieved 20 August 2015.
- ↑ https://www.gmes-atmosphere.eu/services/raq/raq_nrt/
- ↑ "Step 2 - Dose-Response Assessment". Retrieved 20 August 2015.
- ↑ Myanmar government (2007). "Haze". Archived from the original on 27 January 2007. Retrieved 2007-02-11.
- ↑ "Air Quality Index - American Lung Association". American Lung Association. Archived from the original on 28 August 2015. Retrieved 20 August 2015.
- ↑ "Spare the Air - Summer Spare the Air". Retrieved 20 August 2015.
- ↑ "FAQ: Use of masks and availability of masks". Archived from the original on 2018-06-22. Retrieved 20 August 2015.
- ↑ "Archived copy" (PDF). Archived from the original (PDF) on 2014-09-03. Retrieved 2014-09-25.
- 1 2 3 "Air Quality Index (AQI) - A Guide to Air Quality and Your Health". US EPA. 9 December 2011. Retrieved 8 August 2012.
- ↑ Jay Timmons (13 August 2014). "The EPA's Latest Threat to Economic Growth". WSJ. Retrieved 20 August 2015.
- ↑ "World Air Quality Index". Retrieved 20 August 2015.
- ↑ "Environment Canada - Air - AQHI categories and explanations". Ec.gc.ca. 2008-04-16. Retrieved 2011-11-11.
- ↑ Hsu, Angel. "China's new Air Quality Index: How does it measure up?". Archived from the original on 17 July 2013. Retrieved 8 February 2014.
- ↑ "Air Quality Health Index". Government of the Hong Kong Special Administrative Region. Retrieved 9 February 2014.
- 1 2 "环境空气质量标准" [Ambient Air Quality Standards] (PDF). Ministry of Environmental Protection of the People's Republic of China (in Chinese). 2012-03-02. Retrieved 2018-02-02.
- 1 2 3 4 "环境空气质量指数(AQI) 技术规定(试行)" [Technical Regulation on Ambient Air Quality Index (on trial)] (PDF). Ministry of Environmental Protection of the People's Republic of China (in Chinese). 2012-03-02. Retrieved 2018-02-02.
- ↑ Rama Lakshmi (17 October 2014). "India launches its own Air Quality Index. Can its numbers be trusted?". Washington Post. Retrieved 20 August 2015.
- ↑ "Ambient Air Quality Monitoring Stations". 2016-08-15. Retrieved 2016-08-16.
- ↑ "Archived copy". Archived from the original on 2014-11-07. Retrieved 2014-10-21.
- ↑ "National Air Quality Index (AQI) launched by the Environment Minister AQI is a huge initiative under 'Swachh Bharat'". Retrieved 20 August 2015.
- ↑ "India launches index to measure air quality". timesofindia-economictimes. Retrieved 20 August 2015.
- ↑ "::: Central Pollution Control Board :::". Retrieved 20 August 2015.
- ↑ "Dirección de Monitoreo Atmosférico". www.aire.cdmx.gob.mx. Retrieved 2016-06-15.
- ↑ "MEWR - Key Environment Statistics - Clean Air". App.mewr.gov.sg. 2011-06-08. Archived from the original on 2011-10-09. Retrieved 2011-11-11.
- ↑ ."National Environment Agency - Calculation of PSI" (PDF). Archived from the original (PDF) on 2013-05-15. Retrieved 2012-06-15.
- ↑ "National Environment Agency". App2.nea.gov.sg. Archived from the original on 2011-11-25. Retrieved 2011-11-11.
- ↑ "What's CAI". Air Korea. Retrieved 25 October 2015.
- ↑ "Improved Air Quality Reflected in N Seoul Tower". Chosun Ilbo. 18 May 2012. Archived from the original on 4 March 2014. Retrieved 29 July 2012.
- ↑ COMEAP. "Review of the UK Air Quality Index". COMEAP website. Archived from the original on 2011-11-15.
- 1 2 "Daily Air Quality Index". Air UK Website. Defra.
- 1 2 "Indices definition". Air quality. Retrieved 9 August 2012.
- 1 2 3 4 5 CiteairII — Common Information to European Air (2012-07-09). "CAQI Air quality index — Comparing Urban Air Quality across Borders – 2012" (PDF). Archived (PDF) from the original on 2018-02-18. Retrieved 2018-02-18.
- ↑ "European Air Quality Index: current air quality information at your finger tips". European Environment Agency. 2017-11-16. Archived from the original on 2018-02-19. Retrieved 2018-02-19.
- ↑ http://www.epa.gov/airnow/aqi-technical-assistance-document-dec2013.pdf
- ↑ David Mintz (February 2009). Technical Assistance Document for the Reporting of Daily Air Quality – the Air Quality Index (AQI) (PDF). North Carolina: US EPA Office of Air Quality Planning and Standards. EPA-454/B-09-001. Retrieved 9 August 2012.
- ↑ Revised Air Quality Standards For Particle Pollution And Updates To The Air Quality Index (AQI) (PDF). North Carolina: US EPA Office of Air Quality Planning and Standards. 2013.
- ↑ http://www3.epa.gov/airquality/ozonepollution/pdfs/20151001fr.pdf
- ↑ "AQI Calculator". Retrieved 7 October 2018.
- ↑ "AirNow API Documentation". Retrieved 20 August 2015.
- ↑ "How are your ozone maps calculated?". Retrieved 20 August 2015.
- ↑ "AirNYC - Air quality in New York. Online". Retrieved 10 August 2017.
- ↑ "AirNow". Retrieved 9 August 2012. .
- ↑ "AirData - US Environmental Protection Agency". Retrieved 20 August 2015.
- ↑ "Aerostate AQI map". aerostate.io. Retrieved 13 February 2018.
- ↑ J.C Fensterstock et al., " The Development and Utilization of an Air Quality Index," Paper No. 69–73, presented at the 62nd Annual Meeting of the Air Pollution Control Administration, June 1969.
External links
Some of the following websites display actively updated air quality index maps; others are archived versions of inactive websites:
- Global:
- Worldwide Air Pollution: Real-time Air Quality Index Visual Map
- AQI at Aerostate.io - Aerostate website about AQI real time data, forecasts, maps, analytics
- Europe:
- CAQI- AirqualityNow
- EAQI - European Environment Agency
- The UK Air Quality Archive
- North America:
- AQI at airnow.gov - cross-agency U.S. Government site
- New Mexico Air Quality and API data - Example of how New Mexico Environment Department publishes their Air Quality and API data.
- AQI at Meteorological Service of Canada
- San Francisco Bay Area Spare-the-Air - AQI explanation
- Asia:
- CAI at Airkorea.or.kr - website of South Korea Environmental Management Corp.
- API at JAS (Malaysian Department of Environment)
- Malaysia Air Pollution Index (inactive as of 19 February 2018)
- API at Hong Kong - Environmental Protection Department of the Government of the Hong Kong Special Administrative Region (inactive as of 19 February 2018)
- AQI in Thailand
- Unofficial PM25 AQI in Hanoi, Vietnam
| Air |
|  | ||||
|---|---|---|---|---|---|---|
| Energy | ||||||
| Land | ||||||
| Life | ||||||
| Water |
| |||||
| Related |
| |||||
| ||||||
| ||||||