Demographics of Zambia
This article is about the demographic features of the population of Zambia, including population density, ethnicity, education level, health of the populace, economic status, religious affiliations and others aspects of the population.
Ethnic groups
Zambia's population comprises more than 70 Bantu-speaking ethnic groups. Some ethnic groups are small, and only two have enough people to constitute at least 10% of the population. The majority of Zambians are subsistence farmers, but the country is also fairly urbanised, with 42% of the population being city residents. The predominant religion is a blend of traditional beliefs and Christianity.
Expatriates, mostly British or South African, as well as some white Zambian citizens (about 40,000), live mainly in Lusaka and in the Copperbelt in northern Zambia, where they are either employed in mines, financial and related activities or retired. Zambia also has a small but economically important Asian population, most of whom are Indians.
2000 census
African: 99.5% (includes Bemba, Tonga, Chewa, Lozi, Nsenga, Tumbuka, Ngoni, Lala, Kaonde, Lunda, and other African groups)
Other: 0.5% (includes Europeans, Asians, and Americans)
(2000 Census)
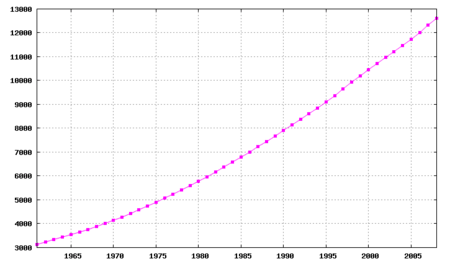
Population
According to the 2017 revision of the World Population Prospects[1] the total population of Zambia is 16,591,390 in 2016, compared to only 2 340 000 in 1950. The proportion of children below the age of 15 in 2010 was 46.4%, 50.6% was between 15 and 65 years of age, while 3.1% was 65 years or older.[2]
| Total population (x 1000)[3] | Population aged 0–14 (%) | Population aged 15–64 (%) | Population aged 65+ (%) | |
|---|---|---|---|---|
| 1950 | 2 340 | 44.9 | 52.3 | 2.7 |
| 1955 | 2 653 | 44.7 | 52.7 | 2.6 |
| 1960 | 3 045 | 44.9 | 52.6 | 2.5 |
| 1965 | 3 537 | 45.2 | 52.2 | 2.6 |
| 1970 | 4 139 | 46.4 | 50.9 | 2.7 |
| 1975 | 4 900 | 47.0 | 50.3 | 2.7 |
| 1980 | 5 775 | 47.3 | 49.9 | 2.8 |
| 1985 | 6 785 | 46.6 | 50.6 | 2.8 |
| 1990 | 7 860 | 45.8 | 51.4 | 2.8 |
| 1995 | 8 919 | 45.3 | 51.8 | 2.9 |
| 2000 | 10 202 | 45.3 | 51.8 | 2.9 |
| 2005 | 11 462 | 45.9 | 51.0 | 3.0 |
| 2010 | 13 089 | 46.4 | 50.6 | 3.1 |
Vital statistics
Registration of vital events is in Zambia not complete. The Population Departement of the United Nations prepared the following estimates. [2]
| Period | Live births per year | Deaths per year | Natural change per year | CBR* | CDR* | NC* | TFR* | IMR* |
|---|---|---|---|---|---|---|---|---|
| 1950-1955 | 117 000 | 54 000 | 63 000 | 46.8 | 21.7 | 25.1 | 6.75 | 148 |
| 1955-1960 | 136 000 | 57 000 | 78 000 | 47.6 | 20.1 | 27.5 | 6.90 | 137 |
| 1960-1965 | 160 000 | 62 000 | 98 000 | 48.6 | 18.8 | 29.8 | 7.15 | 127 |
| 1965-1970 | 189 000 | 68 000 | 121 000 | 49.3 | 17.7 | 31.6 | 7.40 | 118 |
| 1970-1975 | 219 000 | 72 000 | 147 000 | 48.5 | 16.0 | 32.5 | 7.43 | 107 |
| 1975-1980 | 254 000 | 79 000 | 174 000 | 47.5 | 14.9 | 32.6 | 7.38 | 100 |
| 1980-1985 | 283 000 | 91 000 | 192 000 | 45.1 | 14.4 | 30.6 | 6.95 | 99 |
| 1985-1990 | 322 000 | 113 000 | 209 000 | 44.0 | 15.4 | 28.6 | 6.66 | 103 |
| 1990-1995 | 365 000 | 151 000 | 214 000 | 43.5 | 18.0 | 25.5 | 6.30 | 107 |
| 1995-2000 | 427 000 | 187 000 | 240 000 | 44.6 | 19.6 | 25.1 | 6.20 | 105 |
| 2000-2005 | 480 000 | 212 000 | 269 000 | 44.4 | 19.6 | 24.8 | 6.10 | 103 |
| 2005-2010 | 547 000 | 204 000 | 342 000 | 44.5 | 16.7 | 27.9 | 6.20 | 95 |
| * CBR = crude birth rate (per 1000); CDR = crude death rate (per 1000); NC = natural change (per 1000); IMR = infant mortality rate per 1000 births; TFR = total fertility rate (number of children per woman) | ||||||||
Births and deaths [4]
| Year | Population | Live births | Deaths | Natural increase | Crude birth rate | Crude death rate | Rate of natural increase | TFR |
|---|---|---|---|---|---|---|---|---|
| 2010 | 13 092 666 | 442 998 | 164 385 | 278 613 | 35,4 | 13,1 | 22,2 |
Fertility and Births
Total Fertility Rate (TFR) (Wanted TFR) and Crude Birth Rate (CBR) :[5] [6]
| Year | CBR Total | TFR (Wanted TFR) Total | CBR Urban | TFR (Wanted TFR) Urban | CBR Rural | TFR (Wanted TFR) Rural |
|---|---|---|---|---|---|---|
| 1992 | 45 | 6,5 (5,4) | 44 | 5,8 (4,7) | 46 | 7,1 (6,2) |
| 1996 | 45,2 | 6,08 (5,2) | 43,7 | 5,08 (4,1) | 46,1 | 6,86 (6,1) |
| 2001-2002 | 43,3 | 5,9 (4,9) | 36,7 | 4,3 (3,4) | 47,0 | 6,9 (5,8) |
| 2007 | 43,6 | 6,2 (5,2) | 36,3 | 4,3 (3,6) | 47,5 | 7,5 (6,3) |
| 2013-2014 | 37,2 | 5,3 (4,5) | 32,2 | 3,7 (3,3) | 40,3 | 6,6 (5,6) |
Fertility data as of 2013-2014 (DHS Program):[7]
| Province | Total fertility rate | Percentage of women age 15-49 currently pregnant | Mean number of children ever born to women age 40-49 |
|---|---|---|---|
| Central | 5.9 | 8.1 | 6.8 |
| Copperbelt | 4.0 | 7.6 | 5.5 |
| Eastern | 5.8 | 8.7 | 6.9 |
| Luapula | 6.4 | 11.4 | 6.6 |
| Lusaka | 3.7 | 7.7 | 5.1 |
| Muchinga | 6.3 | 10.3 | 7.2 |
| Northern | 6.6 | 10.4 | 7.6 |
| North Western | 6.2 | 9.2 | 6.7 |
| Southern | 6.2 | 9.2 | 6.9 |
| Western | 5.6 | 8.1 | 6.0 |
Life expectancy
| Period | Life expectancy in Years[8] |
|---|---|
| 1950–1955 | 42.07 |
| 1955–1960 | |
| 1960–1965 | |
| 1965–1970 | |
| 1970–1975 | |
| 1975–1980 | |
| 1980–1985 | |
| 1985–1990 | |
| 1990–1995 | |
| 1995–2000 | |
| 2000–2005 | |
| 2005–2010 | |
| 2010–2015 |
CIA World Factbook demographic statistics
The following demographic statistics are from the CIA World Factbook, unless otherwise indicated.
Median age
- total: 17.2 years
- male: 17.1 years
- female: 17.3 years (2010 est.)
- total: 16.46 years
- male: 16.26 years
- female: 16.67 years (2005 est.)
- total: 16.5 years
- male: 16.4 years
- female: 16.6 years (2002)
Sex ratio
- at birth: 1.03 male(s)/female
- under 15 years: 1.01 male(s)/female
- 15-64 years: 1.01 male(s)/female
- 65 years and over: 0.68 male(s)/female
- total population: 1 male(s)/female (2010 est.)
Life expectancy at birth
- total population: 52.7 years
- male: 51.1 years
- female: 54.4 years (2017 est.)
- total population: 39.7 years
- male: 39.43 years
- female: 39.98 years (2005 est.)
- total population:37.24 years
- male:37.08 years
- female:37.41 years (2000 est.)
HIV/AIDS
adult prevalence rate
- 11.5% (2017 est.)
- 16.5% (2003 est.)
- 21.5% (2001 est.)
people living with HIV/AIDS
- 1.1 million (2017 est.)
- 920,000 (2003 est.)
- 1.2 million (2001 est.)
deaths
- 16,000 (2017 est.)
- 89,000 (2003 est.)
- 120,000 (2001 est.)
Nationality
- noun:Zambian(s)
- adjective:Zambian
Religions[9]
- Protestant 75.3%
- Roman Catholic 20.2%
- Other 2.7% (includes Islam, Buddhist, Hindu, and Bahá'í)
- None 1.8% (2010 est.)
Languages[9]
- English (official), major vernaculars - Bemba, Kaonde, Lozi, Lunda, Luvale, Nyanja, Tonga, and about 70 other indigenous languages (Ambo - Aushi - Bisa - Chikunda - Cishinga - Chokwe - Gova - Ila - Inamwanga - Iwa - Kabende - Kosa - Kunda - Kwandi - Kwandu - Kwangwa - Lala - Lamba - Lenje - Leya - Lima - Liyuwa - Luano - Lucazi - Lumbu - Lundwe - Lungu - Lunda - Makoma - Mambwe - Mashasha - Mashi - Mbowe - Mbukushu - Mbumi - Mbunda - Mbwela - Mukulu - Mulonga - Ndembu - Ng'umbo - Nkoya - Nsenga - Nyengo - Nyiha - Sala - Seba - Senga - Shanjo - Shila - Simaa - Soli - Subiya - Swaka - Tabwa - Tambo - Toka - Totela - Tumbuka - Twa - Unga - Wandya - Yombe)
Literacy
definition: age 15 and over can read and write
- total population: 63.4%
- male: 70.9%
- female: 56% (2015 est.)
See also
References
| Wikimedia Commons has media related to Demographics of Zambia. |
- ↑ "World Population Prospects: The 2017 Revision". ESA.UN.org (custom data acquired via website). United Nations Department of Economic and Social Affairs, Population Division. Retrieved 10 September 2017.
- 1 2 "2015 Revision of World Population Prospects". Esa.un.org. Archived from the original on 2011-05-06. Retrieved 2016-08-09.
- ↑ De Wulf, Martin. "Zambia 2015". Population Pyramids of the World from 1950 to 2100.
- ↑ "United Nations Statistics Division - Demographic and Social Statistics". Unstats.un.org. Retrieved 2016-08-09.
- ↑ "Cambodia - Demographic and Health Survey 2010". Microdata.worldbank.org. Retrieved 2016-08-09.
- ↑ "National Health Survey 1998" (PDF). Dhsprogram.com. Retrieved 2016-08-09.
- ↑ "Demographic and Health Survey 2013-14" (PDF). Dhsprogram.com. Retrieved 7 November 2017.
- ↑ "World Population Prospects - Population Division - United Nations". esa.un.org. Retrieved 2018-08-26.
- 1 2 "Africa :: ZAMBIA". CIA The World Factbook.