Immigration to Norway
In 2017, Norway's immigrant population consisted of 883,751 people, making up 16.8% of the country's total population.[1] This includes both foreign-born and Norwegian-born with two foreign-born parents, and four foreign-born grandparents. In this population, 724,987 are foreign-born immigrants, while 158,764 are norwegian-born with foreign-born parents.[2] The ten most common countries of origin of immigrants residing in Norway are Poland (97,196), Lithuania (37,638), Sweden (36,315), Somalia (28,696), Germany (24,601), Iraq & Kurdistan region (22,493), Syria (20,823), Philippines (20,537), Iran & Kordestan province (21,364) Pakistan (19,973).[3] The immigration population comprises people from a total of 221 countries and autonomous regions.[4]
Immigration to Norway has increased over the last decades, beginning in the early 1990s. In 1992, the immigrant population in Norway was 183,000 individuals, representing 4.3% of the total population, and the net migration consisted of 9,105 people. In 2012, net migration peaked, as 48,714 people came to the country. Starting in 2013, net migration has decreased. In 2016, net migration was 27,778. [5]
Immigrants from specific countries are divided into several ethnic groups. For example, there are both Turks and Kurds from Turkey, Arabs and Berbers from Morocco, Russians and Chechens from Russland and immigrants from Iran are divided into Persians, Azeris Kurds and Lurs.[6]
History

Historical immigration to Norway, started in the Viking Age. The practice of Royal intermarriage was common in European aristocracies and elsewhere. Norwegian kings used to seek their wives from other Royal houses, in order to foster ties with foreign countries.[7] See the Kings of Norway family tree.
Other historical fields linked to migrations were trade and academia, bringing workforce and innovation respectively. The Hanseatic League introduced large scale trade in Bergen and Northern Norway. Mining in Kongsberg, Røros and other places was made possible by immigrants from nearby countries. During the 19th century the evolution of dairies and the industrial exploitation of waterfalls depended on immigrants. Before the University was established in Christiania in 1811, almost all civil servants from up to circa 1500, were migrants.[8]
From the middle of the 20th century, the history of migration to Norway is characterized by four main phases.[4] The first wave of immigrants came during the 1960s, as a result of demand of labor within the secondary labor market. This group was mainly dominated by men from Pakistan and Turkey, who came to work in the oil sector. The shock of the 1973 Oil Crisis resulted in an immigration stop to Norway, which ended this first wave. The next wave came the late 1970s, and consisted mostly of family members from former immigrants. The third wave of the mid 1980s, was a increasing flow of asylum seekers mainly from Iran, Chile, Vietnam, Sri Lanka and the former Yugoslavia. From the beginning of the 21st century until today, Norwegian immigration has been characterized by a more liberal approach to labor immigration, as well as stricter policies towards asylum seekers.
Contemporary immigration
According to the Norwegian Immigration Act, all foreigners have to apply for permanent residency in order to live and work in Norway, except for citizens of Nordic countries.[9] There are four main reasons for immigration to Norway that are lawfully accepted - employment, education, protection and family reunification.[10] In 2016, most Norwegian immigrants came for family reunification (16,465 people), followed by protection (15,190), work (14,372) and education (4,147). Of the total number of 788,531 people who immigrated between 1990 and 2016, most immigrated for family reunification (283,478), followed by work (262,669), protection (156,590) and education (80,956).[10]
Norway is part of the European Economic Area (EEA) and the Schengen area. This makes it easier for immigrants from the European countries to gain residency in Norway. In 2017, 41.2% of the total immigrant population in Norway were from countries in the EU or EEA. 32.4% were from Asia including Turkey, and 13.7% were from Africa. The remaining 12.7% were from European countries not in the EU or EEA, North America, South America and Oceania.[11]
In 1999, the Norwegian Directorate of Immigration (Norwegian: Udlendingsdirektoratet, UDI) started to use blood testing on Somalis who applied for family reunification with parents, the tests showed that 1 out of 4 lied about the family ties. The tests were later changed to DNA tests to verify family ties.[12] The leader of a Somali community organization in Norway and the Norwegian Medical Association protested the tests and wished they would be discontinued.[13] In 2010, UDI started DNA-tests on Somali childless couples who applied for family reunification where one spouse already resided in Norway. The results showed that 40% of such pairs were siblings. As the tests became widely known, the ratio dropped to 25% and the tests were widended to migrants from other regions.[14]
Refugees in Norway
One cause of immigration in the 20th and 21st century is the need for protection in a new country, due to wars or riots in the migrants' home countries. In the 1950s, refugees came from Hungary to Norway, and in the 1970s from Chile and Vietnam.[4] In the mid-1980s, there was an increase in the number of asylum seekers from countries such as Iran and Sri Lanka. In the 1990s, war refugees from the Balkans were the predominant immigrant group accepted into Norway; a large number of which have since returned home to Kosovo. Since the end of the 1990s, new groups of asylum seekers from countries such as Iraq, Somalia, and Afghanistan arrived.
The Dublin Regulation in 2001 states that non-European refugees applying for asylum in a Dublin country, will only get their application processed once, in the country where they first apply for asylum.[15]
During the European migrant crisis in 2015, a total of 31,145 asylum seekers crossed the Norwegian border in 2015.[16] The number had not been as high since the Balkan wars in 1990s. Most of the asylum seekers came from Afghanistan and Syria. In 2016, the number was dramatically reduced by almost 90%. In 2016, 3460 asylum seekers came to Norway. This was partly due to the stricter border control in Europe.[17] The EU-Turkey agreement, implemented Mars 20th 2016, was made in order strengthen organized channels of immigration to Europe, and prevent irregular migration from Turkey to the EU.[18]
As part of the UN, Norway receives UN quota refugees. In 2015, the Norwegian government announced that they would receive 8,000 Syrian quota refugees between 2015 and 2017.
Immigration of Married Children
In April 2016, Reuters reported that in the past year, Norway admitted 10 married children (children under 16 years of age). Four had children of their own. The Norwegian Directorate of Immigration (UDI) stated that "some" of the married children in Norway live "with their partners." The head of the PLAN charity stated: ""If the girl is aged under 16, the minimum age for sexual intercourse in Norway, the child bride refugee should be separated from her husband even if they have children together."[19]
Demographics
Population
As of 2014, an official study showed that 4,081,000 people or 79.9% of the total population were Norwegians having no migrant background (both of their parents were born in Norway)[20] and more than 759,000 individuals (14.9%)[20] were immigrants—or descendants of recent immigrants—from neighbouring countries and the rest of the world. A further 235,000 (4.6%) were born in Norway to one foreign-born parent, and 34,000 (0.7%) were born abroad to one parent born in Norway.
In 2012, of the total 710,465 with immigrant background, 407,262 had Norwegian citizenship (60.2 percent).[21] Of these 13,2%, 335,000 (51%)[20] had a Western background mostly from Poland, Germany, and Sweden. 325,000 (49%)[20] had a non-Western background mostly from Turkey, Morocco, Iraq, Somalia, Pakistan and Iran.[3] Immigrants were represented in all Norwegian municipalities. The cities or municipalities with the highest share of immigrants in 2012 were Oslo (30.4 percent), Drammen (25 percent), Lørenskog (23 per cent) and Skien (19.6 percent).[1] According to Reuters, Oslo is the "fastest growing city in Europe because of increased immigration".[22] In recent years, immigration has accounted for most of Norway's population growth.
In 2010, the immigrant community grew by 57,000, which accounted for 90% of Norway's population growth; some 2% of newborn children were of immigrant background (two foreign parents). These statistics indicate that Norway's population is now 87.8% ethnic Norwegian, a figure that has steadily decreased since the late 20th century. Some 12.2% of the population is of solely immigrant background, while 5.7% of the population is of mixed Norwegian-foreign ancestry. People of other European ethnicity are 5.8% of the total, while Asians (including Pakistanis, and Iraqis) are 4.3%, Africans 1.5%, and others 0.6%.[23]
Religion
Immigration has altered the religious demography of Norway. Among the immigrants, 250,030 have background from predominantly Christian countries, 119,662 from predominantly Muslim countries, 28,942 from mostly Buddhist countries, and 7,224 from countries that are predominantly Hindu.[24] The proportion of Muslim immigrants has fallen drastically in recent years, from about 80% in 2000 to less than 20% in 2007.[25]
As of 2008 there were living in Norway somewhere between 120,000 and 163,000 persons who had either immigrated from or who had parents who had immigrated from countries where Islam is the predominant religion, accounting for up to 3.4% of the country's total population.[25][26] This number should interpreted with caution according to a report by Statistics Norway, as there are significant religious minorities in several of these countries, and varying degrees of commitment to the religion. In the same year, 84,000 persons were members of an Islamic congregation.[25] The largest single denomination besides the state church is the Roman Catholic Church, which had a membership of more than 54,000 in 2008. It gained about 10,000 new members, mostly Poles, in the period 2004-2008.[25] Other religions which have increased mainly as a result of recent post-war immigration (with percentages of adherents in parenthesis), include Hinduism (0.5%), Buddhism (0.4%), Eastern Orthodoxy and Oriental Orthodoxy (0.2%) and the Bahá'í Faith (<0.1%).
Employment
Unemployment
Immigrant employment rates are generally higher in Norway than overall employment rates in most countries , the overall unemployment rate among immigrants being 6.5% in May 2011, totalling about 20,000 persons. The unemployment rate in the population as a whole was 2.7% at this time. There are differences between immigrant groups. People with African backgrounds have the highest unemployment rates, with 12.4%. Unemployment rates among immigrants from Asia and Eastern Europe were 8.2% and 7.4%, respectively. Persons born in Norway to immigrant parents, still a young and relatively small demographic, had an unemployment rate of 5.0%, totalling 766 persons. This was 1.6 percentage points above persons with Norwegian-born parents in the same age group, and 2.1 percentage points below immigrants in the same age group.[27]
Workforce participation
Overall workforce participation in the immigrant population was 61.6% in 2010,[27] compared to 71.9% for the population as a whole.[28] African immigrants had the lowest workforce participation, with 43.9%. Persons born to immigrant parents had a workforce participation of 53.0%, similar to that of the corresponding age demographic with Norwegian-born parents.[27]
Effects of immigration
Demographic
From 1977 to 2012, the number of non-Norwegian citizens living in Norway of European descent has increased from around 46,000 to around 280,000. In the same period the number of citizens of nations on other continents increased from about 25,000 to about 127,000, of which 112,230 from Middle East, Asia, Africa and South America.[29] If persons with two immigrant parents are counted, the total immigrant population has risen from 57,041 in 1970 to 710 465 in 2012, the non-European proportion rose from 20.1% to 46.1%. The proportion of women in the immigrant population shifted from 56.1% in 1970 to 48.0% in 2012.[30] According to a book chapter published by Amsterdam University in 2008 and authored by Prof. Mete Feridun of University of Greenwich, immigration has a positive impact on economic growth in Norway and it has no statistically significant impact on unemployment in the job market.[31]
Crime
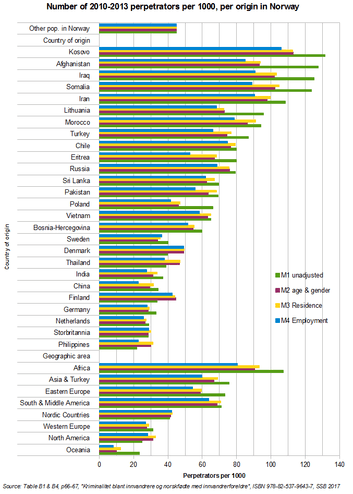
The overall probability that a person living in Norway would be convicted for a felony (Norwegian: forbrytelse) was increased by about 0.5 percentage points for the immigrant compared to non-immigrant populations for felonies committed in the years 2001-2004. The incidence was especially high among immigrants from Kosovo, Morocco, Somalia, Iraq, Iran and Chile, and reached more than 2% in all these groups. In comparison, the incidence in the non-immigrant population was about 0.7%. Incidence was lower than for the non-immigrant population among immigrants from among others, Western European countries, Eastern Europe except Poland, the Balkans and Russia, the Philippines, China and North America. Incidence was also higher for persons with two immigrant parents for all countries of origin, including Nordic and Western European countries. When the data was corrected for the population group's age and gender structure (the most over-represented immigrant groups also have a considerable over-representation of young men), place of residence (rural–central) and employment situation, the over-representation was found to be significantly lower, especially for those groups which had the highest incidence in the uncorrected statistics. For some groups, among them immigrants from Bosnia-Herzegovina, Poland, Russia and the other Eastern European countries, the corrected incidences did not differ significantly from the non-immigrant population.[33]
According to data released by the European Council, 341 out of the year 2000 prison inmate population of 2643 were foreign nationals, a share of 12.9%. In the year 2010 foreign nationals represented 1129 out of a 3636 total, a 31.1% share. These figures were corroborated by officials of the Norwegian Correctional Service which stated the rising trend escalated when 8 countries joined the Schengen Area in 2007.[34] In order to decrease costs for interpreters and other special needs of foreign inmates, foreign nationals serving sentences involving subsequent deportation were in 2012 incarcerated in an institution holding only foreigners as they are not intended to be re-integrated into Norwegian society.[35] This institution opened in December 2012 in Kongsvinger.[36]
In September 2016 Norwegian authorities discovered that more than a million identity papers had been issued without stringent checks which enabled fraudsters to claim social welfare benefits of many persons simultaneously. The Norwegian system is based on trust and cohesion in society and therefore lacks stringent identity checks at every single government agency.[37]
| Rape suspects by place of birth in 2017 | |
 | |
| Source: Norwegian National Criminal Investigation Service[38] | |
In 2017, a Statistics Norway (SSB) report on crime in Norway was ordered by the immigration minister Sylvi Listhaug.[39] SSB limited the scope of the paper to figures for individual nations from which at least 4,000 immigrants lived in Norway as of January 1, 2010.[40] In the 2010-2013 period, the proportion of foreign-born perpetrators of criminal offences aged 15 and older per 1000 residents in Norway was found to be highest among immigrants from South and Central America (164.0), Africa (153.8), and Asia including Turkey (117.4), and lowest among immigrants from Eastern Europe (98.4), other Nordic countries (69.1), and Western Europe outside the Nordic region (50.7). This was compared to averages of 44.9 among native Norwegians and 112.9 among Norway-born residents with parents of foreign origin.[41] Among individual countries of origin for which figures were provided, the estimated proportion of foreign-born perpetrators was highest among immigrants from Kosovo (131.48), Afghanistan (127.62), Iraq (125.29), Somalia (123.81), and Iran (108.60). Immigrants from Poland were the only over-represented population for which gender and age structure, employment and place of residence, could explain their over-representation.[32] The total number of perpetrators in the 2010-2013 period with Norwegian background was 154326 and 27985 with immigration background.[42]
According to Statistics Norway, as of 2015, a total of 260,868 persons residing in Norway incurred sanctions. Of these, most were citizens of countries in Europe (240,497 individuals), followed by Asia (2,899 individuals), Africa (2,469 individuals), the Americas (909 individuals), and Oceania (92 individuals). There were also 13,853 persons sanctioned who had unknown citizenship, and 149 persons sanctioned without citizenship. The five most common countries of origin of foreign citizens in Norway who incurred sanctions were Poland (7,952 individuals), Lithuania (4,227 individuals), Sweden (3,490 individuals), Romania (1,953 individuals) and Denmark (1,728 individuals).[43]
In 2007 was the first time when foreign perpetrators of partner murders were in the majority. While 13% of Norway's population are foreigners, they represent 47% of perpetrators who have murdered their partner.[44] The most prevalent countries of origin were: Iran, Afghanistan, Iraq, Somalia and Eritrea.[44]
In 2018, an investigation into court cases involving domestic violence against children showed that 47% of the cases involved parents who were both born abroad. According to a researcher at Norwegian Police University College the over-representation was due to cultural (honor culture) and legal differences in Norway and foreign countries.[45]
Legal and administration issues
The Directorate of Immigration (UDI) is responsible for the administration of immigration into the country.[46] Before the UDI was established in 1988, several government organisations were involved in administrating immigration.[47] Another body, Integrerings- og mangfoldsdirektoratet (IMDi) (Directorate of Integration and Diversity), "contribute[s] to equality in living conditions and diversity through employment, integration and participation".[48]
Immigrants and Norwegian-born to immigrant parents, by country of origin
| Rank | Country of origin[49] | Population (2001)[50] | Population (2014)[51] | Population (2017)[52] |
|---|---|---|---|---|
| 1. | 6,432 | 91,179 | 108,255 | |
| 2. | 23,010 | 38,414 | 39,266 | |
| 3. | 10,107 | 35,912 | 41,463 | |
| 4. | 378 | 35,546 | 42,491 | |
| 5. | 23,581 | 34,447 | 36,700 | |
| 6. | 12,357 | 30,144 | 32,304 | |
| 7. | 9,448 | 26,683 | 27,593 | |
| 8. | 15,880 | 21,721 | 22,658 | |
| 9. | 19,049 | 20,897 | 21,447 | |
| 10. | 5,885 | 19,886 | 22,892 | |
| 11. | 11,016 | 19,793 | 21,364 | |
| 12. | 3,749 | 18,770 | 20,444 | |
| 13. | 10,990 | 17,345 | 18,172 | |
| 14. | 12,944 | 16,845 | 17,684 | |
| 15. | 3,738 | 16,559 | 19,254 | |
| 16. | 1,346 | 15,459 | 19,560 | |
| 17. | 10,335 | 14,797 | 15,308 | |
| 18. | 10,925 | 14,774 | 15,321 | |
| 19. | 0[53] | 14,408 | 15,328 | |
| 20. | 813 | 14,397 | 23,618 | |
| 21. | 6,140 | 12,924 | 14,933 | |
| 22. | 1,054 | 11,068 | 15,664 | |
| 23. | 3,654 | 9,491 | 10,466 | |
| 24. | 385 | 9,460 | 11,072 | |
| 25. | 5,719 | 9,111 | ||
| 26. | 7,253 | 8,652 | ||
| 27. | 3,756 | 8,169 | ||
| 28. | 3,848 | 8,062 | ||
| 29. | 6,491 | 7,904 | ||
| 30. | 2,803 | 7,807 | ||
| 31. | 6,776 | 6,797 | ||
| 32. | 2,350 | 5,276 | ||
| 33. | 842 | 5,227 | ||
| 34. | 342 | 5,092 | ||
| 35. | 1,382 | 4,903 | ||
| 36. | 0[53] | 4,253 | ||
| 37. | 399 | 4,210 | ||
| 38. | 824 | 4,017 | ||
| 39. | 860 | 3,977 | 22,285 | |
| 40. | 63 | 3,974 | ||
| 41. | 64 | 3,825 | ||
| 42. | 207 | 3,813 | ||
| 43. | 1,666 | 3,789 | ||
| 44. | 1,863 | 3,699 | ||
| 45. | 789 | 3,595 | ||
| 46. | 1,265 | 3,271 | ||
| 47. | 433 | 3,092 | ||
| 48. | 1,613 | 2,624 | ||
| 49. | 276 | 2,590 | ||
| 50. | 704 | 2,560 | ||
| 51. | 1,355 | 2,424 | ||
| 52. | 557 | 2,180 | ||
| 53. | 541 | 1,964 | ||
| 54. | 604 | 1,841 | ||
| 55. | 1,120 | 1,786 | ||
| 56. | 533 | 1,776 | ||
| 57. | 927 | 1,637 | ||
| 58. | 689 | 1,636 | ||
| 59. | 1,050 | 1,606 | ||
| 60. | 609 | 1,468 | ||
| 60. | 405 | 1,468 | ||
| 61. | 922 | 1,430 | ||
| 62. | 157 | 1,418 | ||
| 63. | 69 | 1,350 | ||
| 64. | 492 | 1,295 | ||
| 65. | 648 | 1,279 | ||
| 67. | 768 | 1,259 | ||
| 68. | 29 | 1,220 | ||
| 69. | 501 | 1,167 | ||
| 70. | 595 | 1,153 | ||
| 71. | 413 | 1,118 | ||
| 72. | 358 | 1,094 | ||
| 73. | 490 | 1,086 | ||
| 74. | 134 | 1,045 | ||
| 75. | 393 | 1,040 | ||
| 76. | 152 | 996 | ||
| 77. | 445 | 991 | ||
| 78. | 286 | 959 | ||
| 79. | 60 | 956 | ||
| 80. | 491 | 951 | ||
| 81. | 562 | 916 | ||
| 82. | 378 | 890 | ||
| 83. | 156 | 878 | ||
| 84. | 742 | 853 | ||
| 85. | 770 | 848 | ||
| 86. | 276 | 844 | ||
| 87. | 464 | 821 | ||
| 88. | 218 | 760 | ||
| 89. | 257 | 713 | ||
| 90. | 485 | 697 | ||
| 91. | 43 | 696 | ||
| 92. | 83 | 632 | ||
| 93. | 247 | 631 | ||
| 94. | 95 | 599 | ||
| 95. | 62 | 569 | ||
| 96. | 277 | 564 | ||
| 97. | 144 | 521 | ||
| 98. | 297 | 518 | ||
| 99. | 252 | 511 | ||
| 100. | 96 | 504 | ||
| 101. | 174 | 492 | ||
| 101. | 35 | 492 | ||
| 102. | 0[53] | 460 | ||
| 103. | 133 | 459 | ||
| 104. | 47 | 446 | ||
| 105. | 220 | 442 | ||
| 106. | 51 | 403 | ||
| 107. | 114 | 390 | ||
| 108. | 10 | 372 | ||
| 109. | 53 | 353 | ||
| 110. | 47 | 339 | ||
| 111. | 47 | 336 | ||
| 112. | 134 | 308 | ||
| 112. | 110 | 308 | ||
| 113. | 33 | 293 | ||
| 114. | 83 | 281 | ||
| 115. | 39 | 278 | ||
| 116. | 204 | 269 | ||
| 117. | 113 | 259 | ||
| 118. | 119 | 254 | ||
| 119. | 60 | 251 | ||
| 120. | 134 | 235 | ||
| 121. | 167 | 234 | ||
| 122. | 141 | 226 | ||
| 123. | 181 | 221 | ||
| 124. | 6 | 211 | ||
| 125. | 0[54] | 192 | ||
| 126. | 81 | 191 | ||
| 127. | 119 | 190 | ||
| 128. | 72 | 167 | ||
| 129. | 73 | 160 | ||
| 130. | 78 | 159 | ||
| 131. | 80 | 155 | ||
| 132. | 90 | 144 | ||
| 133. | 8 | 140 | ||
| 134. | 52 | 133 | ||
| 135. | 17 | 125 | ||
| 136. | 64 | 117 | ||
| 137. | 56 | 110 |
Opposition
In some nation states there is some opposition to immigration.[55] The Progress Party has made the reduction of high levels of immigration from non-European countries one of their agendas:
- "Immigration from countries outside the EEA must be strictly enforced to ensure a successful integration. It can not be accepted that fundamental Western values and human rights are set aside by cultures and attitudes that certain groups of immigrants bring with them to Norway."[56]
An extreme form of opposition to immigration in Norway was carried out by the terrorist Anders Behring Breivik on 22 July 2011. He bombed government buildings in Oslo and massacred 69 young people at a youth summer camp held by the Labour Party. He blamed the party for the high level of Muslim immigration and accused it of "promoting multiculturalism".[57]
See also
References
- 1 2 "Immigrants and Norwegian-born to immigrant parents, 1 January 2016". Statistics Norway. Accessed 01 May 2016.
- ↑ "Flest nye bosatte fra Syria". ssb.no (in Norwegian Bokmål). Retrieved 2018-03-02.
- ↑ "Population by immigrant category and country background". Statistics Norway. Retrieved 25 December 2017.
- 1 2 3 Sandnes, Toril (2017). Innvandrere i Norge, 2017. Oslo-Kongsvinger: Statistics Norway.
- ↑ "05394: Innvandring, utvandring og nettoinnvandring, etter norsk/utenlandsk statsborgerskap 1958 - 2016-PX-Web SSB". PX-Web SSB. Retrieved 2018-03-02.
- ↑ https://www.ssb.no/
- ↑ From Harald Finehair to Håkon Håkonsson eight out of ten known queens were princesses from neighbouring countries. Steinar Imsen. Våre dronninger (in Norwegian). Grøndahl og Dreyer. 1991. ISBN 82-09-10678-3
- ↑ Knut Kjeldstadli. Norsk innvandringshistorie (in Norwegian). Pax, 2003. ISBN 82-530-2541-6
- ↑ "Lov om utlendingers adgang til riket og deres opphold her (utlendingsloven) - Lovdata". lovdata.no (in Norwegian). Retrieved 2018-03-02.
- 1 2 "Innvandrere etter innvandringsgrunn". ssb.no (in Norwegian Bokmål). Retrieved 2018-03-02.
- ↑ "Innvandrere og norskfødte med innvandrerforeldre". ssb.no (in Norwegian Bokmål). Retrieved 2018-03-02.
- ↑ "UDI fortsetter med omstridt DNA-test". Dagbladet.no (in Norwegian). 2001-10-02. Retrieved 2018-08-27.
- ↑ "UDI fortsetter med omstridt DNA-test". Dagbladet.no (in Norwegian). 2001-10-02. Retrieved 2018-08-27.
- ↑ "DNA-tester avdekket juks med familiegjenforening". Aftenposten (in Norwegian Bokmål). Retrieved 2018-08-27.
- ↑ Text of the current Dublin Regulation Regulation (EU) No 604/2013 of the European Parliament and of the Council of 26 June 2013 establishing the criteria and mechanisms for determining the Member State responsible for examining an application for international protection lodged in one of the Member States by a third-country national or a stateless person
- ↑ Garvik, Olav (2017). "Asylsituasjonen i Norge 2015 og 2016". Store Norske Leksikon. Retrieved March 2, 2018.
- ↑ Amundsen, Bård (December 23, 2016). "Fra 30 000 til 3000 asylsøkere, hva har skjedd?". Forskning.no. Retrieved March 2, 2018.
- ↑ "EU-Turkey Statement 2016" (PDF).
- ↑ Doyle, Alister (21 April 2016). "Child brides sometimes tolerated in Nordic asylum centers despite bans". Reuters (Oslo). Retrieved 22 April 2016.
10 of those aged under 16 -- the minimum local age for sex or marriage -- were married and four had children, the Norwegian Directorate of Immigration (UDI) said [...] Of the 10 "some live in adult asylum centers, some in their own rooms and some with their partners," it said in emailed replies [...] "If the girl is aged under 16, the minimum age for sexual intercourse in Norway, the child bride refugee should be separated from her husband even if they have children together and even if they say they want to stay together," said Kjell Erik Oie, head of PLAN Norway.
- 1 2 3 4 "Archived copy". Archived from the original on 6 February 2013. Retrieved 6 February 2013.
- ↑ "Three categories of immigration background, country of birth and citizenship by country background and sex. 1 January 2012 " Archived 20 November 2012 at the Wayback Machine.. Statistics Norway. 26 April 2012. Accessed 27 April 2012. Archived 7 August 2011.
- ↑ Hare, Sophie. "Factbox – facts about Norway". Reuters. 22 July 2011. Accessed 22 July 2011.
- ↑ "Statistics Norway – Persons with immigrant background by immigration category and country background". Ssb.no. 2011-01-01. Retrieved 2011-07-23.
- ↑ "De fleste innvandrerne er kristne" Google translation. NRK. 9 December 2009. Accessed 7 August 2011.
- 1 2 3 4 Daugstad, Gunnlaug; Østby, Lars (2009). "Et mangfold av tro og livssyn" [A variety of beliefs and denominations]. Det flerkulturelle Norge (in Norwegian). Statistics Norway. Retrieved July 18, 2012.
- ↑ Leirvik, Oddbjørn. "Islam i Norge". Google translation. University of Oslo. 2008. Accessed 7 August 2011.
- 1 2 3 Anders Ekeland (2011). "Stabil yrkesdeltakelse og ledighet" [Stable workforce participation and unemployment rates] (in Norwegian). Statistics Norway. Retrieved July 18, 2012.
- ↑ "Tabell:05111: Personer i alderen 15-74 år, etter kjønn, arbeidsstyrkestatus og alder" [Persons aged 15-74, by gender, workforce status and age] (in Norwegian). Statistics Norway. Retrieved July 18, 2012.
- ↑ "Tabell:05196: Folkemengde, etter kjønn, alder og statsborgerskap" [Table:05196: Population by gender, age and citizenship] (in Norwegian). Statistics Norway. Retrieved July 18, 2012.
- ↑ "Tabell:07110: Innvandrere, etter landbakgrunn (verdensdel) og kjønn (K)" [Table:07110: Immigrants by country background (World part) and gender (municipality level)] (in Norwegian). Statistics Norway. Retrieved July 18, 2012.
- ↑ Investigating the Economic Impact of Immigration on the Host Country: The Case of Norway, in Kolb, Holger and Egbert, Henrik (Eds.), 46-55, Migrants and Markets: Perspectives from Economics and Other Social Sciences, Amsterdam University Press (2008).
- 1 2 Synøve N. Andersen, Bjart Holtsmark & Sigmund B. Mohn (2017). Kriminalitet blant innvandrere og norskfødte med innvandrerforeldre En analyse av registerdata for perioden 1992-2015. Statistics Norway. pp. 29, 30 (Figur 3.2), 66 (Tabell B1). ISBN 978-82-537-9643-7.
Figur 3.2 viser den ujusterte (M1) og de justerte (M2-M4) andelene gjernings-personer blant øvrig befolkning og blant innvandrere fra ulike land og verdens-regioner. De grønne og lilla søylene (M1 og M2) tilsvarer tallene i Tabell 3.3. Vedå kontrollere for alder og kjønn (M2) skjer det vesentlige endringer i andelgjerningspersoner, og da særlig for de landgruppene med høyest andel gjernings-personer. For eksempel synker andelen gjerningspersoner fra Afghanistan fra 127,6til 93,2 per 1000 (en reduksjon på 27 prosent), og for Irak synker andelen fra 125,3til 102,1 per 1000 (en reduksjon på 21 prosent). Dette betyr at for disse landenehenger overrepresentasjonen i vesentlig grad sammen med kjønns- og alders-strukturen. Korreksjon for alder og kjønn gir også en vesentlig reduksjon i andelengjerningspersoner blant innvandrere fra Litauen, Somalia og Irak, og en vissreduksjon ses også for alle andre grupper med unntak for innvandrere fra Danmark, Finland, Filipinene, Thailand og Nord-Amerika.[...] Å justere for bosted (M3) gir ingen eller liten endring for samtlige landgrupper.[...] Å kontrollere for sysselsetting (M4) reduserer imidlertid andelengjerningspersoner ytterligere for de landgruppene som fremdeles har relativt høyandel gjerningspersoner – herunder Somalia og øvrige Afrika, Irak og Iran.[...] Samlet sett er derfor rimelig åsi at sysselsetting forklarer noe av overrepresentasjonen for enkelte land ogregioner, selv om forskjellene jevnt over ikke er veldig store. Dette er i tråd medtidligere studier som finner at kjønn og alder er de viktigste sosiodemografiskeforklaringsfaktorene når man ønsker å forklare hvorfor innvandrere er over-representert i kriminalstatistikken. Det er også viktig å påpeke at kjønn, alder, bosted og sysselsetting kan forklare hele overrepresentasjonen kun blantinnvandrere fra Polen. For de andre landene som var overrepresentert i utgangspunktet består overrepresentasjonen også etter at disse faktorene er tatt hensyn til
- ↑ Skarðhamar, Torbjørn; Thorsen, Lotte R.; Henriksen, Kristin (2011-09-12). Kriminalitet og straff blant innvandrere og øvrig befolkning [Crime and punishment among immigrants and non-immigrants] (pdf) (in Norwegian). Oslo: Statistics Norway. ISBN 978-82-537-8124-2.
- ↑ "Kraftig økning av utlendinger i norske fengsler". NRK. 9 Oct 2012. Retrieved 11 November 2016.
- ↑ "Eget fengsel for utenlandske fanger". NRK. 8 October 2012. Retrieved 11 November 2016.
- ↑ "Eget fengsel for utlendinger". Bergensavisen. 10 December 2012. Retrieved 11 November 2016.
- ↑ NRK. "Sjekker ikke ID godt nok". NRK (in Norwegian). Retrieved 2017-05-25.
- ↑ Voldtektssituasjonen i Norge 2017. Kripos. p. 18.
- ↑ "Etterlyste mer info om innvandrere og kriminalitet – svaret overrasker ikke SSB-forskerne". Aftenposten (in Norwegian Bokmål). Retrieved 2017-12-23.
- ↑ Synøve N. Andersen, Bjart Holtsmark & Sigmund B. Mohn. Kriminalitet blant innvandrere og norskfødte med innvandrerforeldre En analyse av registerdata for perioden 1992-2015. p. 24.
For å begrense rapportens omfang, og fordi det i alle befolkningsgrupper er en relativt lav andel som begår kriminalitet, og analyser av relativt små befolkningsgrupper derfor er lite hensiktsmessig, rapporterer vi tall for enkeltland dersom antall innvandrere fra landet var minst 4000 personer per 1.1.2010, jfr. Skarðhamar et al. (2011).
- ↑ Synøve N. Andersen, Bjart Holtsmark & Sigmund B. Mohn. Kriminalitet blant innvandrere og norskfødte med innvandrerforeldre En analyse av registerdata for perioden 1992-2015. p. 38 (Tabell 3.6).
Tabell 3.6 viser oss det totale antallet gjerningspersoner blant norskfødte med innvandrerforeldre, brutt ned etter foreldrenes landbakgrunn og innvandringsgrunn. Tallet i den øverste raden i tabellen kjenner vi igjen fra tidligere; det er 44,9 gjerningspersoner per 1000 bosatt i den øvrige befolkningen. Blant norskfødte med innvandrerforeldre er tallet 112,9.
- ↑ Synøve N. Andersen, Bjart Holtsmark & Sigmund B. Mohn. Kriminalitet blant innvandrere og norskfødte med innvandrerforeldre En analyse av registerdata for perioden 1992-2015. p. 24.
p27, Tabell 3.3
- ↑ "Persons sanctioned, by group of principal offence and citizenship (and category of principal offence -2014). Absolute figures". Statistics Norway. Retrieved 25 December 2017.
- 1 2 "De ble drept av sine kjære". VG Nett. Retrieved 2018-04-21.
- ↑ Trovåg, Einar Orten. "NRK-undersøking: 47 prosent av alle born i familievaldsaker er innvandrarar". NRK (in Norwegian Nynorsk). Retrieved 2018-09-22.
- ↑ "About UDI". Directorate of Immigration. Accessed 22 July 2011. Archived 7 August 2011.
- ↑ "A brief history of the UDI". Directorate of Immigration. 6 May 2004. Accessed 22 July 2011. Archived 7 August 2011.
- ↑ "About IMDi". Directorate of Integration and Diversity. Accessed 22 July 2011.
- ↑ Immigrants and Norwegian-born to immigrant parents
- ↑ "Innvandrarbefolkninga og personar med annan innvandringsbakgrunn, etter innvandringskategori, kjønn og landbakgrunn. 1. januar 2001". Statistics Norway (in Norwegian).
- ↑ "Innvandrere og norskfødte med innvandrerforeldre". Statistics Norway (in Norwegian).
- ↑ "Immigrants and Norwegian-born to immigrant parents, 1 January 2017". Statistics Norway (in Norwegian).
- 1 2 3 15,469 from Yugoslavia
- ↑ 433 from Sudan
- ↑ Chinyong Liow, Joseph (3–4 September 2004). Malaysia's Approachęş to its Illegal Indonesian Migrant Labour Problem: Securitization, Politics, or Catharsis? (pdf). Singapore: Paper for Institute of Defence and Strategic Studies-Ford (IDSS-Ford) workshop on non-traditional security in Asia.
- ↑ The Progress Party's politics (In Norwegian) From the official website of the Progress Party (23.11.2014)
- ↑ "Prime minister: Norway still 'an open society' despite 'the horror'" CNN, 25 July 2011
Further reading
- "9 Migration policy". Ministry of Foreign Affairs (Norway). 2008. Accessed 7 August 2011.
- "Population statistics. Immigration and emigration, 2010". Statistics Norway. Accessed 22 July 2011.
- ""Overview 2008: How well is integration working?"" (PDF). Archived from the original on 22 July 2011. (714 KB). Directorate of Integration and Diversity. 18 May 2009. Accessed 22 July 2011. 22 July 2011. See webpage.
- ""Immigrants in the Norwegian media"" (PDF). Archived from the original on 22 July 2011. (765 KB). Directorate of Integration and Diversity. 7 April 2010. Accessed 22 July 2011. 22 July 2011. See webpage.
- Mete Feridun, Investigating the Economic Impact of Immigration on the Host Country: The Case of Norway, in Kolb, Holger and Egbert, Henrik (Eds.), 46-55, Migrants and Markets: Perspectives from Economics and Other Social Sciences, Amsterdam University Press (2008).
External links
- Directorate of Immigration
- Integrerings- og mangfoldsdirektoratet (Directorate of Integration and Diversity)
Norway articles | |||||||
|---|---|---|---|---|---|---|---|
| History |  | ||||||
| Geography | |||||||
| Politics | |||||||
| Economy |
| ||||||
| Society |
| ||||||
| |||||||