Hammersmith and Fulham London Borough Council election, 2006
| ||||||||||||||||||||||
All 46 seats to Hammersmith and Fulham London Borough Council 24 seats needed for a majority | ||||||||||||||||||||||
|---|---|---|---|---|---|---|---|---|---|---|---|---|---|---|---|---|---|---|---|---|---|---|
| Turnout |
39.7% ( | |||||||||||||||||||||
| ||||||||||||||||||||||
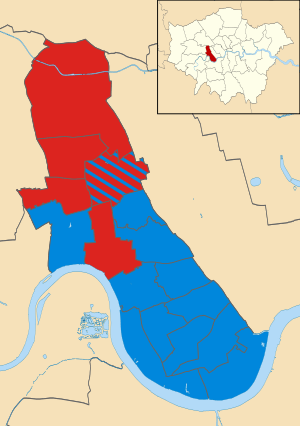 Map of the results of the 2006 Hammersmith and Fulham council election. Conservatives in blue and Labour in red. | ||||||||||||||||||||||
| ||||||||||||||||||||||
Elections to Hammersmith and Fulham Council were held on 4 May 2006. The whole council was up for election for the first time since the 2002 election.
Hammersmith and Fulham local elections are held every four years. Therefore, the next elections were held in 2010.
Election result
| Party | Seats | Gains | Losses | Net gain/loss | Seats % | Votes % | Votes | +/− | |
|---|---|---|---|---|---|---|---|---|---|
| Conservative | 33 | 15 | 0 | +15 | 72% | 48.7% | +6.2% | ||
| Labour | 13 | 0 | 15 | -15 | 28% | 32.0% | -9.0% | ||
| Liberal Democrat | 0 | 0 | 0 | 0 | 0 | 14.0% | -0.1% | ||
| Green | 0 | 0 | 0 | 0 | 0 | ||||
At the Hammersmith and Fulham council election, 2006, the Conservative Party won a majority for the first time since 1968, taking 33 seats and forming the Administration for the London Borough of Hammersmith and Fulham . The Council leader was Cllr Stephen Greenhalgh. Labour formed the opposition on the Council, with 13 seats, and was led by Stephen Cowan.[2]
The Conservative Party came close to losing the usually safe ward of Palace Riverside, after the sitting councillors were deselected, and ran as independents. One of the two rebels returned 12 years later as the Conservative candidate in the same ward, and was elected[3].
One notable loss for the Labour Party was one of the three seats in the Shepherds Bush Green ward - which only ever elected Labour councillors before or since. After alternating between Abu Khalad (1986, 1994 & 2002) and Jafar Khaled (1990 & 1998), Abu Khaled stood for re-election, but lost by 4 votes in a ward where the Conservatives had previously been nowhere near winning a seat.
Ward results
The borough is divided into 16 electoral wards, all bar two electing three councillors apiece[4].
Addison
| Party | Candidate | Votes | % | ± | |
|---|---|---|---|---|---|
| Conservative | Helen Binmore | 1799 | 42.5% | ||
| Conservative | Belinda Donovan | 1682 | |||
| Conservative | Peter Tobias | 1664 | |||
| Labour | Coughlan, Siobhan M. | 1276 | 30.2% | ||
| Labour | Smallman, Melanie L. | 1238 | |||
| Labour | Ellard, Andrew R. | 1155 | |||
| Green | Clarence-Smith, Dylan A.P. | 597 | 14.1% | ||
| Liberal Democrat | Burden, Janet L. | 480 | 11.3% | ||
| Liberal Democrat | Sutton, John B. | 360 | |||
| Christian Peoples | Mills, Katherine S. | 80 | 1.9% | ||
Askew
| Party | Candidate | Votes | % | ± | |
|---|---|---|---|---|---|
| Labour | Gill Dickenson | 1186 | 39.0% | ||
| Labour | Rory Vaughan | 1086 | |||
| Labour | Lisa Homan | 1080 | |||
| Liberal Democrat | Bewley, Henrietta S. | 1052 | 34.6% | ||
| Liberal Democrat | Sainty, Sophie P. | 1002 | |||
| Liberal Democrat | Young, Thoby W.A. | 950 | |||
| Conservative | Cann, David | 806 | 26.5% | ||
| Conservative | Oliver, William J. | 769 | |||
| Conservative | Evans, Alexander K. | 760 | |||
Avonmore & Brook Green
| Party | Candidate | Votes | % | ± | |
|---|---|---|---|---|---|
| Conservative | Alexandra Robson | 1747 | 55.9% | ||
| Conservative | Will Bethell* | 1717 | |||
| Conservative | Robert Iggulden | 1669 | |||
| Labour | Khan, Mujeer M. | 931 | 29.8% | ||
| Labour | Woodhatch, Victoria M. | 847 | |||
| Labour | Risley, Simon C. | 841 | |||
| Liberal Democrat | Cottam, Thomas G.E. | 447 | 14.3% | ||
| Liberal Democrat | Crawley, Nicola J. | 438 | |||
| Liberal Democrat | Whyatt, Adrian D. | 389 | |||
College Park & Old Oak
| Party | Candidate | Votes | % | ± | |
|---|---|---|---|---|---|
| Labour | Wesley Harcourt* | 686 | 45.4% | ||
| Labour | Reg McLaughlin* | 610 | |||
| Conservative | de Lisle, Alexandra E. | 308 | 20.4% | ||
| Liberal Democrat | Burden, Jon P. | 287 | 19.0% | ||
| Conservative | Spencer-Smith, Gerald P.H. | 252 | |||
| Independent | Brennan, Stephen P. | 231 | 15.3% | ||
| Liberal Democrat | Freisberg, Carsten P.J. | 231 | |||
Fulham Broadway
| Party | Candidate | Votes | % | ± | |
|---|---|---|---|---|---|
| Conservative | Aidan Burley | 1682 | 49.3% | ||
| Conservative | Victoria Brocklebank-Fowler | 1644 | |||
| Conservative | Rachel Ford | 1610 | |||
| Labour | Jones, Andrew M. | 1191 | 34.9% | ||
| Labour | Napier, Charles J. | 1146 | |||
| Labour | Stephens, Anthony F. | 1111 | |||
| Liberal Democrat | Carr, Shaun A. | 305 | 8.9% | ||
| BNP | Tyler, Stephen J. | 236 | 6.9% | ||
| Liberal Democrat | Falkner, Robert | 235 | |||
| Liberal Democrat | Mynors, Rowland P.B. | 210 | |||
Fulham Reach
| Party | Candidate | Votes | % | ± | |
|---|---|---|---|---|---|
| Conservative | Gavin Donovan* | 1683 | 49.9% | ||
| Conservative | Paul Bristow | 1635 | |||
| Conservative | Andrew Johnson | 1573 | |||
| Labour | Burke, Stephen B. | 1284 | 38.1% | ||
| Labour | Cardigan, Oliver P. | 1222 | |||
| Labour | Turmaine, Matthew R. | 1207 | |||
| Liberal Democrat | Stephens, Elizabeth M. | 407 | 12.1% | ||
| Liberal Democrat | Jablkowska, Marytka K. | 341 | |||
Hammersmith Broadway
| Party | Candidate | Votes | % | ± | |
|---|---|---|---|---|---|
| Labour | Michael Cartwright* | 1203 | 42.9% | ||
| Labour | Lisa Nandy | 1203 | |||
| Labour | Stephen Cowan* | 1161 | |||
| Conservative | Clarke, Edward | 1152 | 41.1% | ||
| Conservative | St Clair-Legge, Elizabeth A. | 1042 | |||
| Conservative | Craig, Oliver D. | 1038 | |||
| Liberal Democrat | Young, Andrew C. | 448 | 16.0% | ||
| Liberal Democrat | Le Rougetel, Samuel R. | 447 | |||
| Liberal Democrat | Oliaji, Meher | 366 | |||
Munster
| Party | Candidate | Votes | % | ± | |
|---|---|---|---|---|---|
| Conservative | Michael Adam* | 1825 | 67.7% | ||
| Conservative | Adronie Alford* | 1762 | |||
| Conservative | Alex Karmel* | 1736 | |||
| Labour | Butler, Thomas W. | 508 | 18.9% | ||
| Labour | Moriah, Joseph L. | 454 | |||
| Labour | Stanley, Simon H.F. | 445 | |||
| Liberal Democrat | Carr, Sarah J. | 361 | 13.4% | ||
| Liberal Democrat | Brett, Alastair J. | 314 | |||
| Liberal Democrat | Morris, Stephen J. | 273 | |||
North End
| Party | Candidate | Votes | % | ± | |
|---|---|---|---|---|---|
| Conservative | Caroline Ffiske | 1585 | 49.1% | ||
| Conservative | Sarah Gore | 1521 | |||
| Conservative | Lucy Gugen | 1492 | |||
| Labour | Coleman, Iain | 1295 | 40.1% | ||
| Labour | Brown, Daryl J.E. | 1250 | |||
| Labour | Treloggan, Charles W.A. | 1158 | |||
| Liberal Democrat | Harris, Suzanna C. | 349 | 10.8% | ||
| Liberal Democrat | Falkner, Kishwer | 337 | |||
| Liberal Democrat | Ratcliffe, Paul G. | 278 | |||
Palace Riverside
| Party | Candidate | Votes | % | ± | |
|---|---|---|---|---|---|
| Conservative | Donald Johnson | 1239 | 45.3% | ||
| Conservative | Melanie Scott Russell | 1183 | |||
| Independent | Al-Uzaizi Emile P. | 1056 | 38.6% | ||
| Independent | Lloyd-Harris, Amanda J. | 1038 | |||
| Labour | Lukey, Francis J. | 278 | 10.2% | ||
| Labour | Stead, Barrington J. | 243 | |||
| Liberal Democrat | Macdonald, Hector I. | 163 | 6.0% | ||
| Liberal Democrat | Dragadze, Tamara | 152 | |||
Parson's Green & Walham
| Party | Candidate | Votes | % | ± | |
|---|---|---|---|---|---|
| Conservative | Nicholas Botterill* | 2307 | 74.9% | ||
| Conservative | Frances Stainton* | 2307 | |||
| Conservative | Mark Loveday* | 2274 | |||
| Labour | Homan, Robin M. | 426 | 13.8% | ||
| Labour | Vaughan, Jenny R. | 402 | |||
| Labour | Pavelin, Colin G. | 392 | |||
| Liberal Democrat | Meek, Alice M. | 348 | 11.3% | ||
| Liberal Democrat | Bagwell, William H. | 337 | |||
| Liberal Democrat | Hartwell, Peter J. | 316 | |||
Ravenscourt Park
| Party | Candidate | Votes | % | ± | |
|---|---|---|---|---|---|
| Conservative | Lucy Ivimy | 1815 | 50.3% | ||
| Conservative | Harry Phibbs | 1725 | |||
| Conservative | Eugenie White | 1725 | |||
| Labour | Allen, Christopher M. | 1227 | 34.0% | ||
| Labour | Hillman, Julian D. | 1164 | |||
| Labour | McMahon, Anthony R. | 1131 | |||
| Liberal Democrat | Goldstein, Margaret | 563 | 15.6% | ||
| Liberal Democrat | Eckersley, Lillian R. | 514 | |||
| Liberal Democrat | Harris, Ian J. | 499 | |||
Sands End
| Party | Candidate | Votes | % | ± | |
|---|---|---|---|---|---|
| Conservative | Steve Hamilton* | 1728 | 57.2% | ||
| Conservative | Jane Law | 1714 | |||
| Conservative | Jeanette Bentley | 1707 | |||
| Labour | Bird, Brendan J. | 1044 | 34.5% | ||
| Labour | Watson, Winifred G. | 869 | |||
| Labour | Haregot, Mulat T. | 864 | |||
| Liberal Democrat | Graves, Lucia M. | 250 | 8.3% | ||
| Liberal Democrat | McKelvie, Allan W. | 215 | |||
| Liberal Democrat | Harnett, Joan P. | 195 | |||
Shepherd's Bush Green
| Party | Candidate | Votes | % | ± | |
|---|---|---|---|---|---|
| Labour | Ed Owen | 909 | 38.6% | ||
| Labour | Mercy Umeh* | 846 | |||
| Conservative | Alexander Chalk | 838 | 35.6% | ||
| Labour | Khaled, Abu S.M.J. | 834 | |||
| Conservative | Goodall, John R. | 735 | |||
| Conservative | Dewhirst, Charles A.G. | 704 | |||
| Liberal Democrat | Owen, Patricia | 608 | 25.8% | ||
| Liberal Democrat | Collie, George M. | 501 | |||
| Liberal Democrat | Winn, Jane A.J. | 449 | |||
Town
| Party | Candidate | Votes | % | ± | |
|---|---|---|---|---|---|
| Conservative | Stephen Greenhalgh* | 1581 | 62.6% | ||
| Conservative | Greg Smith | 1570 | |||
| Conservative | Antony Lillis* | 1554 | |||
| Labour | Cash, Anthony | 539 | 21.3% | ||
| Labour | Church, Dominic J. | 462 | |||
| Labour | Kadoo, Krokhukoomaj J.J. | 429 | |||
| Liberal Democrat | Braund, Henry C. | 406 | 16.1% | ||
| Liberal Democrat | Kennedy, Paul G. | 397 | |||
| Liberal Democrat | Muir, Graham P. | 368 | |||
Wormholt & White City
| Party | Candidate | Votes | % | ± | |
|---|---|---|---|---|---|
| Labour | Jean Campbell | 1292 | 48.1% | ||
| Labour | Colin Aherne* | 1278 | |||
| Labour | Dame Sally Powell * | 1151 | |||
| Conservative | Barnes, Terry J. | 767 | 28.6% | ||
| Conservative | Trehearne, Edward G.P. | 623 | |||
| Conservative | Yogeswaran, Arunasalam, S. | 519 | |||
| Liberal Democrat | Perrin, Julie C. | 442 | 16.5% | ||
| Liberal Democrat | Pocock, Matthew C. | 404 | |||
| Liberal Democrat | Pettit, Rosemary | 382 | |||
| Independent | Hauzaree, Jagdeo | 184 | 6.9% | ||
References
- ↑ "Council Election results 1964 to 2006" (PDF). LBHF. Retrieved 8 May 2010.
- ↑ https://s3-eu-west-1.amazonaws.com/londondatastore-upload/London-Borough-Council-Elections-2006.pdf
- ↑ https://www.pinknews.co.uk/2006/04/13/tories-deselect-single-mother-and-gay-arab/
- ↑ http://www.andrewteale.me.uk/leap/results/2006/8/
| Mayor of London | |
|---|---|
| London Assembly | |
| Inner London Education Authority | |
| Greater London Council | |
| London County Council | |
| Borough Councils | |
| Referendums | |
| |