Hammersmith and Fulham London Borough Council election, 2002
The 2002 Hammersmith and Fulham Council election took place on 2 May 2002 to elect members of Hammersmith and Fulham London Borough Council in London, England. The whole council was up for election and the Labour party stayed in overall control of the council, despite winning fewer votes than the Conservative party.[1]
Background
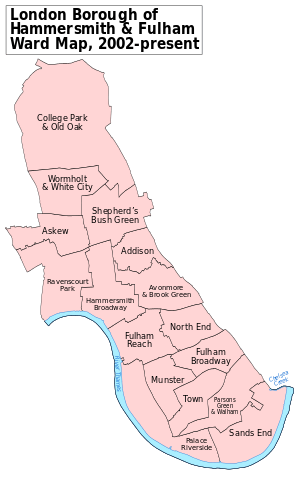
This was the first set of council election using new ward boundaries - a majority of which were three seaters. The total number of council seats was reduced from 50 to 46.
Election result
The Labour Party won 28 seats (on a 41.0% share of the vote) - 8 fewer seats than at previous election (on a loss of 8.7% of the vote), and maintained control of the council. The Conservative Party won 18 seats (with 42.5% of the vote) - 4 more seats than their previous result (increasing their vote share by 4.9%) The Liberal Democrats did not win any seats, and polled 14.1% of the votes cast - an increase of 1.5%.[2][3]
Ward results
Addison
| Party | Candidate | Votes | % | ± | |
|---|---|---|---|---|---|
| Labour | Coughlan, Siobhan | 1058 | 45.3% | ||
| Labour | Karian, Ghassan | 946 | |||
| Labour | Smallman, Melanie L. | 937 | |||
| Conservative | Donovan, Belinda C. | 911 | 39.0% | ||
| Conservative | Browne, James W. | 897 | |||
| Conservative | Blaney, Terence W.D. | 886 | |||
| Liberal Democrat | Pettit, Rosemary | 369 | 15.8% | ||
| Liberal Democrat | Bowater, Lucien | 341 | |||
| Liberal Democrat | Sutton, John B. | 309 | |||
Askew
| Party | Candidate | Votes | % | ± | |
|---|---|---|---|---|---|
| Labour | Graham, Christine | 1246 | 52.6% | ||
| Labour | Wicks, Josephine A. | 1056 | |||
| Labour | Stanley, Timothy | 1021 | |||
| Liberal Democrat | Perrin, Julie C. | 465 | 19.6% | ||
| Conservative | Roberts, Sally A.E. | 420 | 17.7% | ||
| Conservative | Cardale, Dowglass C. | 391 | |||
| Conservative | Watson, Robert P. | 371 | |||
| Liberal Democrat | Broomfield, Graham M. | 369 | |||
| Liberal Democrat | Ocock, Timothy J. | 350 | |||
| Socialist Alliance | Macdermott, Fionntan | 130 | 5.5% | ||
| Independent | Schouwenburg, Herbert | 108 | 4.6% | ||
Avonmore and Brook Green
| Party | Candidate | Votes | % | ± | |
|---|---|---|---|---|---|
| Conservative | Bethell, William A. | 1240 | 40.6% | ||
| Conservative | Dawson, Sian E. | 1214 | |||
| Conservative | Neubert, Jolyon N. | 1151 | |||
| Labour | Brown, Daryl J. | 1112 | 36.4% | ||
| Labour | Hillman, Julian D. | 964 | |||
| Labour | Stanley, Simon H. | 952 | |||
| Liberal Democrat | Bhatti, Nowsheen M. | 375 | 12.3% | ||
| Liberal Democrat | Watts, Anthony E. | 349 | |||
| Independent | Mallinson, Keith A. | 327 | 10.7% | ||
College Park and Old Oak
| Party | Candidate | Votes | % | ± | |
|---|---|---|---|---|---|
| Labour | Harcourt, Wesley S. | 726 | 65.9% | ||
| Labour | McLaughlin, Reginald | 715 | |||
| Liberal Democrat | Halliday, Ian J. | 206 | 18.7% | ||
| Conservative | Farquharson, Emma M. | 170 | 15.4% | ||
| Liberal Democrat | Pollard, Timothy D.P | 170 | |||
| Conservative | Spencer-Smith, Gerald P.H. | 158 | |||
Fulham Broadway
| Party | Candidate | Votes | % | ± | |
|---|---|---|---|---|---|
| Labour | Jones, Andrew M. | 1276 | 47.4% | ||
| Labour | Church, Dominic J. | 1253 | |||
| Labour | Napier, Charles J. | 1217 | |||
| Conservative | Collett, Jonathan M.T. | 1183 | 43.9% | ||
| Conservative | Swann, Emma J. | 1169 | |||
| Conservative | Kenyon, Thomas E.G | 1166 | |||
| Liberal Democrat | Miller, Margaret P. | 233 | 8.7% | ||
| Liberal Democrat | Falkner, Robert | 188 | |||
| Liberal Democrat | Mynors, Rowland P.B. | 165 | |||
Fulham Reach
| Party | Candidate | Votes | % | ± | |
|---|---|---|---|---|---|
| Conservative | Boyle, Charles R. | 1102 | 42.7% | ||
| Labour | Birdsey, Araminta | 1095 | 42.4% | ||
| Conservative | Donovan, Charles G. | 1094 | |||
| Conservative | Harper, Victoria J.T. | 1069 | |||
| Labour | Homan, Lisa F. | 1051 | |||
| Labour | Vaughan, Rory J. | 1011 | |||
| Liberal Democrat | Campbell, Duncan G.A. | 285 | 11.0% | ||
| Liberal Democrat | Jablkowska, Marytka K. | 269 | |||
| Liberal Democrat | Ruston, Graham C. | 228 | |||
| Independent | Braun, Christian A. | 99 | 3.8% | ||
Hammersmith Broadway
| Party | Candidate | Votes | % | ± | |
|---|---|---|---|---|---|
| Labour | Davies, Huw | 1061 | 51.3% | ||
| Labour | Cartwright, Kenneth M. | 1041 | |||
| Labour | Cowan, Stephen E. | 1016 | |||
| Conservative | Douglas-Home, Tara J | 562 | 27.2% | ||
| Conservative | Parker, Hannah M. | 531 | |||
| Conservative | Hillman, Nicholas P.H. | 528 | |||
| Liberal Democrat | Sainty, Sophie P. | 380 | 18.4% | ||
| Liberal Democrat | Collie, George M. | 373 | |||
| Liberal Democrat | Le Rougetel, Samuel R | 318 | |||
| UKIP | Lawrie, Andrew J.G. | 64 | 3.1% | ||
| UKIP | Roberts, Gerald | 52 | |||
Munster
| Party | Candidate | Votes | % | ± | |
|---|---|---|---|---|---|
| Conservative | Adam, Michael F | 1232 | 61.4% | ||
| Conservative | Alford, Adronie E. | 1197 | |||
| Conservative | Karmel, Alexander P | 1168 | |||
| Labour | Eaton, Andreene | 535 | 26.7% | ||
| Labour | Pearson, Simon M. | 532 | |||
| Labour | Grigg, John H. | 518 | |||
| Liberal Democrat | Muir, Diane | 239 | 11.9% | ||
| Liberal Democrat | Brett, Alastair J. | 231 | |||
| Liberal Democrat | Mann, Gary S. | 193 | |||
North End
| Party | Candidate | Votes | % | ± | |
|---|---|---|---|---|---|
| Labour | Williams, David | 1159 | 45.2% | ||
| Labour | Treloggan, Charles W. | 1136 | |||
| Labour | Slaughter, Andrew | 1127 | |||
| Conservative | Boys Smith, Nicholas J. | 1013 | 39.5% | ||
| Conservative | Vickers, Mark R. | 993 | |||
| Conservative | Woods, Michael B | 964 | |||
| Liberal Democrat | Falkner, Kishwer | 264 | 10.3% | ||
| Liberal Democrat | Harris, Suzanna C. | 262 | |||
| Liberal Democrat | Diamand-Levy, Pepita | 217 | |||
| Socialist Alliance | Colerick, George A. | 63 | 2.5% | ||
| Socialist Labour | Sheridan, Linda V | 63 | 2.5% | ||
Palace Riverside
| Party | Candidate | Votes | % | ± | |
|---|---|---|---|---|---|
| Conservative | Lloyd-Harris, Amanda J. | 1455 | 66.5% | ||
| Conservative | Al-Uzaizi, Emile P. | 1416 | |||
| Labour | Leaver, John C. | 443 | 20.3% | ||
| Labour | Watson, Winifred G. | 393 | |||
| Liberal Democrat | Macdonald, Hector I | 289 | 13.2% | ||
| Liberal Democrat | Morris, Stephen J. | 219 | |||
Parsons Green and Walham
| Party | Candidate | Votes | % | ± | |
|---|---|---|---|---|---|
| Conservative | Loveday, Mark A. | 1710 | 71.3% | ||
| Conservative | Botterill, Nicholas B. | 1704 | |||
| Conservative | Stainton, Frances M. | 1696 | |||
| Labour | Dunne, Katherine S | 409 | 17.0% | ||
| Labour | Carlisle, Michele E | 403 | |||
| Labour | Lukey, Francis J. | 389 | |||
| Liberal Democrat | Bagwell, William H. | 280 | 11.7% | ||
| Liberal Democrat | McKelvie, Shahina | 272 | |||
| Liberal Democrat | Brock, Jonathan S. | 257 | |||
Ravenscourt Park
| Party | Candidate | Votes | % | ± | |
|---|---|---|---|---|---|
| Labour | Allen, Christopher M. | 1177 | 37.4% | ||
| Conservative | Donald, Caroline M. | 1131 | 36.0% | ||
| Labour | Evans-Lothian, Fiona G.M. | 1128 | |||
| Conservative | Merriman, Huw W. | 1107 | |||
| Labour | Jackson, Gregory S | 1102 | |||
| Conservative | Miles, Joseph W.C. | 1087 | |||
| Liberal Democrat | Goldstein, Margaret C. | 838 | 26.6% | ||
| Liberal Democrat | Burden, Jon | 832 | |||
| Liberal Democrat | Poll, Katharine S. | 828 | |||
Sands End
| Party | Candidate | Votes | % | ± | |
|---|---|---|---|---|---|
| Labour | Bird, Brendan J. | 1257 | 49.2% | ||
| Labour | Vaughan, Jenny R. | 1130 | |||
| Conservative | Hamilton, Stephen J. | 1114 | 43.6% | ||
| Labour | Pavelin, Colin G. | 1111 | |||
| Conservative | Holdsworth, Mark B. | 1061 | |||
| Conservative | Woods, Karen A. | 1058 | |||
| Liberal Democrat | Hartwell, Peter J. | 182 | 7.1% | ||
| Liberal Democrat | Mercadier, Thierry R.A. | 174 | |||
| Liberal Democrat | McKelvie, Allan W. | 158 | |||
Shepherds Bush Green
| Party | Candidate | Votes | % | ± | |
|---|---|---|---|---|---|
| Labour | Gibbons, Ivan | 985 | 54.0% | ||
| Labour | Khaled, Abu S.M.J. | 908 | |||
| Labour | Umeh, Mercy C-E. | 785 | |||
| Conservative | Burns-Thomson, Nicola J. | 475 | 26.0% | ||
| Conservative | Harvey, Anna | 467 | |||
| Conservative | Seely, Robert W.H. | 447 | |||
| Liberal Democrat | Owen, Patricia | 365 | 20.0% | ||
| Liberal Democrat | Andrew, Michael P | 342 | |||
| Liberal Democrat | McDonnell, Colquitto A. | 322 | |||
Town
| Party | Candidate | Votes | % | ± | |
|---|---|---|---|---|---|
| Conservative | Hands, Gregory W. | 1161 | 60.3% | ||
| Conservative | Greenhalgh, Stephen J. | 1155 | |||
| Conservative | Lillis, Antony | 1108 | |||
| Labour | Fordham, Jeremy P | 519 | 27.0% | ||
| Labour | Dawber, Howard | 468 | |||
| Labour | Rham, John P.C. | 396 | |||
| Liberal Democrat | Braund, Henry C. | 245 | 12.7% | ||
| Liberal Democrat | Cloney, Michael J. | 242 | |||
| Liberal Democrat | Muir, Graham P | 225 | |||
Wormholt and White City
| Party | Candidate | Votes | % | ± | |
|---|---|---|---|---|---|
| Labour | Aherne, Colin | 1141 | 63.5% | ||
| Labour | Powell, Sally A. | 1084 | |||
| Labour | Burke, Stephen B. | 1082 | |||
| Conservative | Donovan-Smith, Sean P. | 366 | 20.4% | ||
| Conservative | Oliver, Grace C. | 337 | |||
| Liberal Democrat | Morrison, Paul T. | 289 | 16.1% | ||
| Liberal Democrat | Spencer, David | 279 | |||
| Conservative | Yogeswaran, Arunasalam S. | 272 | |||
| Liberal Democrat | Eze, Richard | 242 | |||