Berwick-upon-Tweed (UK Parliament constituency)
| Berwick-upon-Tweed | |
|---|---|
|
County constituency for the House of Commons | |
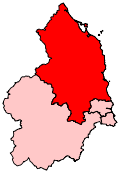 Boundary of Berwick-upon-Tweed in Northumberland. | |
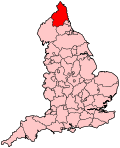 Location of Northumberland within England. | |
| County | Northumberland |
| Population | 75,718 (2011 census)[1] |
| Electorate | 55,785 (December 2010)[2] |
| Current constituency | |
| Created | 1512 |
| Member of parliament | Anne-Marie Trevelyan (Conservative) |
| Number of members | One |
| Created from | North Northumberland |
| Overlaps | |
| European Parliament constituency | North East England |
Berwick-upon-Tweed (/ˌbɛrɪk-/ (![]()
Boundaries
The constituency of Berwick-upon-Tweed is in the county of Northumberland. It includes as its northernmost point the town of Berwick-upon-Tweed and stretches south to include the towns of Alnwick and Amble — the Northumberland coast forms its long eastern boundary. Its length is roughly 50 miles (80 km) and its area is 2,310 square kilometres.
Predominantly rural in character, this constituency is the most northerly in England and is relatively sparsely populated.
Between 1918 and 1949 the constituency comprised Berwick upon Tweed Municipal Borough, the Urban Districts of Alnwick, Amble and Rothbury, together with the Rural Districts of Alnwick, Belford, Glendale, Norham & Islandshire and Rothbury.
Boundary review
Following the last review of parliamentary representation in Northumberland, the Boundary Commission for England made only minor changes to the existing Berwick constituency. A proposal to rename the historic seat "Berwick-upon-Tweed and Mid Northumberland" was rejected: whilst it is geographically accurate, it was thought unwieldy[n 3].
The electoral wards used to form the slightly modified constituency are:
- The entire former district of Alnwick
- The entire former district of Berwick-upon-Tweed
- The former Castle Morpeth wards of Chevington, Ellington, Hartburn, Longhorsley, Lynemouth, Ulgham
History
Rural in nature, sparse of population and with agriculture as a major source of employment, Berwick-upon-Tweed has never elected a Labour candidate. It was represented by Liberal Democrat Sir Alan Beith from 1973 (formerly Liberal) until his retirement in 2015, when it was gained by the Conservative candidate Anne-Marie Trevelyan. The area has been notable for its Liberal members – both Sir William Beveridge (influential in the formation of the National Health Service) and Edward Grey (Foreign Secretary at the start of World War I, best remembered for the "lamps are going out all over Europe...." remark) have served this constituency.
Sir Alan was first elected in a by-election, required as a result of the resignation of the then incumbent MP Antony Lambton (Conservative), who had been caught up in a scandal involving call girls, marijuana and a tabloid newspaper.
In 1923, Mabel Philipson, a former music hall actress, took over the seat as a Conservative, when her husband was forced to resign. In doing so she became only the third female MP to sit in the House of Commons since female members became legal five years previously.
Members of Parliament
The seat has sent members to Parliament since its enfranchisement by Henry VIII. It initially sent two members; this was reduced to one in 1885.
MPs before 1660
| Parliament | First member | Second member |
|---|---|---|
| 1510–1523 | No names known[3] | |
| 1529 | John Martin | John Cooper, died and replaced after 1532 by ?John Uvedale[3] |
| 1536 | ? | |
| 1539 | Odinel Selby | ?[3] |
| 1542 | ? | |
| 1545 | ? | |
| 1547 | Odinel Selby | John Watson[3] |
| 1553 (Mar) | ? | |
| 1553 (Oct) | ? | |
| 1554 (Apr) | George Browne | Odinel Selby[3] |
| 1554 (Nov) | ? | |
| 1555 | Thomas Bradford | Charles Wharton[3] |
| 1558 | ? | |
| 1562/3 | Anthony Temple | Thomas Norton[4] |
| 1571 | Sir Valentine Browne | Henry Carey[4] |
| 1572 | Martin Garnett | Robert Newdigate[4] |
| 1584 | William Morton | Thomas Parkinson[4] |
| 1586 (Oct) | Sir Valentine Browne | [4] |
| 1589 (Jan) | William Morton | William Selby[4] |
| 1593 | William Morton | William Selby[4] |
| 1597 (Oct) | William Selby | Thomas Parkinson[4] |
| 1601 | William Selby | David Waterhouse[4] |
| 1604 | Sir William Selby | Christopher Parkinson |
| 1614 | Sir John Selby | Meredith Morgan |
| 1621 | Sir John Selby | Sir Robert Jackson |
| 1624 | Sir Robert Jackson | Edward Lively |
| 1625 | Sir Robert Jackson | Sir John Selby |
| 1626 | Sir Robert Jackson | Richard Lowther |
| 1628 | Sir Edmund Sawyer | Edward Liveley |
| 1629–1640 | No Parliaments convened | |
| 1640 (Apr) | Sir Thomas Widdrington | Hugh Potter |
| 1640 (Nov) | Sir Thomas Widdrington | Robert Scawen |
| 1645 | Sir Thomas Widdrington | Robert Scawen |
| 1648 | Sir Thomas Widdrington | Robert Scawen |
| 1653 | Berwick not represented in Barebones Parliament | |
| 1654 | George Fenwick | Only one representative in 1st Protectorate Parliament |
| 1656 | George Fenwick, died 1657 and replaced by John Rushworth | Only one representative in 2nd Protectorate Parliament |
| 1659 | John Rushworth | George Payler |
MPs 1660–1885
MPs since 1885
Elections
Elections in the 2010s
| Party | Candidate | Votes | % | ± | |
|---|---|---|---|---|---|
| Conservative | Anne-Marie Trevelyan | 22,145 | 52.5 | +11.4 | |
| Labour | Scott Dickinson | 10,364 | 24.6 | +9.6 | |
| Liberal Democrat | Julie Pörksen | 8,916 | 21.1 | -7.8 | |
| Green | Thomas Stewart | 787 | 1.9 | -1.8 | |
| Majority | 11,781 | 27.9 | +15.7 | ||
| Turnout | 42,212 | 71.8 | +2.2 | ||
| Conservative hold | Swing | +0.9 | |||
| Party | Candidate | Votes | % | ± | |
|---|---|---|---|---|---|
| Conservative | Anne-Marie Trevelyan | 16,603 | 41.1 | +4.4 | |
| Liberal Democrat | Julie Pörksen | 11,689 | 28.9 | -14.8 | |
| Labour | Scott Dickinson | 6,042 | 14.9 | +1.8 | |
| UKIP | Nigel Coghill-Marshall | 4,513 | 11.2 | +7.9 | |
| Green | Rachael Roberts | 1,488 | 3.7 | N/A | |
| English Democrat | Neil Humphrey | 88 | 0.2 | N/A | |
| Majority | 4,914 | 12.2 | |||
| Turnout | 40,423 | 69.6 | +2.6 | ||
| Conservative gain from Liberal Democrat | Swing | +9.6 | |||
| Party | Candidate | Votes | % | ± | |
|---|---|---|---|---|---|
| Liberal Democrat | Alan Beith | 16,806 | 43.7 | -8.9 | |
| Conservative | Anne-Marie Trevelyan | 14,116 | 36.7 | +7.7 | |
| Labour | Alan Strickland | 5,061 | 13.2 | -5.2 | |
| UKIP | Mick Weatheritt | 1,243 | 3.2 | ||
| BNP | Peter Mailer | 1,213 | 3.2 | ||
| Majority | 2,690 | 7.0 | -16.3 | ||
| Turnout | 38,439 | 67.0 | +3.7 | ||
| Liberal Democrat hold | Swing | -8.3 | |||
Elections in the 2000s
| Party | Candidate | Votes | % | ± | |
|---|---|---|---|---|---|
| Liberal Democrat | Alan Beith | 19,052 | 52.8 | +1.4 | |
| Conservative | Mike Elliott | 10,420 | 28.9 | +0.8 | |
| Labour | Glen Reynolds | 6,618 | 18.3 | +0.6 | |
| Majority | 8,632 | 23.9 | |||
| Turnout | 36,090 | 63.4 | -0.4 | ||
| Liberal Democrat hold | Swing | +0.3 | |||
| Party | Candidate | Votes | % | ± | |
|---|---|---|---|---|---|
| Liberal Democrat | Alan Beith | 18,651 | 51.4 | +5.9 | |
| Conservative | Glen Sanderson | 10,193 | 28.1 | +4.0 | |
| Labour | Martin Walker | 6,435 | 17.7 | -8.5 | |
| UKIP | John Pearson | 1,029 | 2.8 | +2.0 | |
| Majority | 8,458 | 23.3 | +4.1 | ||
| Turnout | 36,308 | 63.8 | -9.7 | ||
| Liberal Democrat hold | Swing | +1.0 | |||
Elections in the 1990s
| Party | Candidate | Votes | % | ± | |
|---|---|---|---|---|---|
| Liberal Democrat | Alan Beith | 19,007 | 45.5 | +1.1 | |
| Labour | Paul Brannen | 10,965 | 26.2 | +3.4 | |
| Conservative | Nick Herbert | 10,058 | 24.1 | -8.7 | |
| Referendum | Ned Lambton | 1,423 | 3.4 | ||
| UKIP | Ian Dodds | 352 | 0.8 | ||
| Majority | 8,042 | 19.3 | +8.7 | ||
| Turnout | 41,805 | 73.5 | -5.6 | ||
| Liberal Democrat hold | Swing | ||||
| Party | Candidate | Votes | % | ± | |
|---|---|---|---|---|---|
| Liberal Democrat | Alan Beith | 19,283 | 44.37 | -7.7 | |
| Conservative | Anthony Henfrey | 14,240 | 32.77 | +3.3 | |
| Labour | Gordon Adam | 9,933 | 22.86 | +5.4 | |
| Majority | 5,043 | 11.60 | -11.0 | ||
| Turnout | 43,456 | 79.1 | +1.8 | ||
| Liberal Democrat hold | Swing | -5.5 | |||
Elections in the 1980s
| Party | Candidate | Votes | % | ± | |
|---|---|---|---|---|---|
| Liberal | Alan Beith | 21,903 | 52.10 | ||
| Conservative | John Middleton | 12,400 | 29.49 | ||
| Labour | Stephen Lambert | 7,360 | 17.51 | ||
| Green | Nigel Pamphilion | 379 | 0.90 | ||
| Majority | 9,503 | 22.60 | |||
| Turnout | 42,042 | 77.3 | |||
| Liberal hold | Swing | ||||
| Party | Candidate | Votes | % | ± | |
|---|---|---|---|---|---|
| Liberal | Alan Beith | 21,958 | 52.69 | ||
| Conservative | Julian Brazier | 13,743 | 32.98 | ||
| Labour | Vera Baird | 5,975 | 14.34 | ||
| Majority | 8,215 | 19.71 | |||
| Turnout | 77.78 | ||||
| Liberal hold | Swing | ||||
Elections in the 1970s
| Party | Candidate | Votes | % | ± | |
|---|---|---|---|---|---|
| Liberal | Alan Beith | 19,351 | 54.34 | ||
| Conservative | Charles Baker-Cresswell | 13,663 | 38.36 | ||
| Labour | G. M. Elliott | 2,602 | 7.31 | ||
| Majority | 5,688 | 15.97 | |||
| Turnout | 83.82 | ||||
| Liberal hold | Swing | ||||
| Party | Candidate | Votes | % | ± | |
|---|---|---|---|---|---|
| Liberal | Alan Beith | 14,684 | 43.11 | ||
| Conservative | Charles Baker-Cresswell | 14,611 | 42.89 | ||
| Labour | G. Spain | 4,768 | 14.00 | ||
| Majority | 73 | 0.21 | |||
| Turnout | 81.37 | ||||
| Liberal hold | Swing | ||||
| Party | Candidate | Votes | % | ± | |
|---|---|---|---|---|---|
| Liberal | Alan Beith | 15,732 | 44.51 | ||
| Conservative | John Donald Morrison Hardie | 15,289 | 43.25 | ||
| Labour | Gordon Adam | 4,326 | 12.24 | ||
| Majority | 443 | 1.25 | |||
| Turnout | 85.14 | ||||
| Liberal hold | Swing | ||||
| Party | Candidate | Votes | % | ± | |
|---|---|---|---|---|---|
| Liberal | Alan Beith | 12,489 | 39.9 | +18.0 | |
| Conservative | John Donald Morrison Hardie | 12,432 | 39.7 | -11.0 | |
| Labour | Gordon Adam | 6,178 | 19.8 | -7.6 | |
| Independent | T. G. Symonds | 126 | 0.4 | ||
| Independent | Robert Goodall | 72 | 0.2 | ||
| Majority | 57 | 0.2 | |||
| Turnout | 75.0 | +1.3 | |||
| Registered electors | 41,721 | ||||
| Liberal gain from Conservative | Swing | +14.5 | |||
| Party | Candidate | Votes | % | ± | |
|---|---|---|---|---|---|
| Conservative | Antony Lambton | 15,558 | 50.66 | +3.1 | |
| Labour Co-op | Bob Wareing | 8,413 | 27.39 | -5.7 | |
| Liberal | Alan Beith | 6,741 | 21.95 | +2.6 | |
| Majority | 7,145 | 23.26 | +8.7 | ||
| Turnout | 30,712 | 73.60 | -3.6 | ||
| Conservative hold | Swing | +4.6 | |||
Elections in the 1960s
| Party | Candidate | Votes | % | ± | |
|---|---|---|---|---|---|
| Conservative | Antony Lambton | 14,281 | 47.63 | -2.3 | |
| Labour | James W. Conway | 9,908 | 33.04 | +7.2 | |
| Liberal | Aubrey Herbert | 5,796 | 19.33 | -4.9 | |
| Majority | 4,373 | 14.58 | -9.4 | ||
| Turnout | 31,750 | 76.58 | +1.1 | ||
| Conservative hold | Swing | +4.75 | |||
| Party | Candidate | Votes | % | ± | |
|---|---|---|---|---|---|
| Conservative | Antony Lambton | 15,851 | 49.92 | ||
| Labour | R. Christopher Jelley | 8,218 | 25.88 | ||
| Liberal | Nicholas B. Madison | 7,681 | 24.19 | ||
| Majority | 7,633 | 24.04 | |||
| Turnout | 31,750 | 79.54 | |||
| Conservative hold | Swing | ||||
Elections in the 1950s
| Party | Candidate | Votes | % | ± | |
|---|---|---|---|---|---|
| Conservative | Antony Lambton | 19,904 | 63.11 | ||
| Labour | R. Christopher Jelley | 11,637 | 36.89 | ||
| Majority | 8,267 | 26.21 | |||
| Turnout | 31,541 | 77.02 | |||
| Conservative hold | Swing | ||||
| Party | Candidate | Votes | % | ± | |
|---|---|---|---|---|---|
| Conservative | Antony Lambton | 18,301 | 60.35 | ||
| Labour | John Frater | 12,024 | 39.65 | ||
| Majority | 6,277 | 20.70 | |||
| Turnout | 30,325 | 72.78 | |||
| Conservative hold | Swing | ||||
| Party | Candidate | Votes | % | ± | |
|---|---|---|---|---|---|
| Conservative | Antony Lambton | 17,632 | 52.70 | ||
| Labour | Thomas H. Jones | 11,069 | 33.08 | ||
| Liberal | John Beeching Frankenburg | 4,759 | 14.22 | ||
| Majority | 6,563 | 19.61 | |||
| Turnout | 78.84 | ||||
| Conservative hold | Swing | ||||
| Party | Candidate | Votes | % | ± | |
|---|---|---|---|---|---|
| Conservative | Robert Thorp | 14,804 | 43.91 | ||
| Liberal | Arthur Comyns Carr | 10,260 | 30.43 | ||
| Labour | John Davis | 8,651 | 25.66 | ||
| Majority | 4,544 | 13.48 | |||
| Turnout | 80.13 | ||||
| Conservative hold | Swing | ||||
Elections in the 1940s
| Party | Candidate | Votes | % | ± | |
|---|---|---|---|---|---|
| Conservative | Robert Thorp | 12,315 | 43.29 | ||
| Liberal | William Beveridge | 10,353 | 36.39 | ||
| Labour | John Davis | 5,782 | 20.32 | ||
| Majority | 1,962 | 6.90 | |||
| Turnout | 67.77 | ||||
| Conservative gain from Liberal | Swing | ||||
| Party | Candidate | Votes | % | ± | |
|---|---|---|---|---|---|
| Liberal | William Beveridge | 8,792 | 87.4 | ||
| Independent | W. D. Clark | 1,269 | 12.6 | ||
| Majority | 7,523 | 74.8 | |||
| Turnout | 10,061 | 24.5 | |||
| Registered electors | 41,068 | ||||
| Liberal hold | Swing | ||||
| Party | Candidate | Votes | % | ± | |
|---|---|---|---|---|---|
| Liberal | George Charles Grey | Unopposed | |||
| Liberal hold | Swing | ||||
Elections in the 1930s
| Party | Candidate | Votes | % | ± | |
|---|---|---|---|---|---|
| Liberal | Hugh Seely | 15,779 | 51.0 | ||
| Conservative | Alfred Todd | 15,145 | 49.0 | ||
| Majority | 634 | 2.0 | |||
| Turnout | 76.0 | ||||
| Liberal gain from Conservative | Swing | ||||
| Party | Candidate | Votes | % | ± | |
|---|---|---|---|---|---|
| Conservative | Alfred Todd | Unopposed | |||
| Conservative hold | Swing | ||||
Elections in the 1920s
| Party | Candidate | Votes | % | ± | |
|---|---|---|---|---|---|
| Unionist | Alfred Todd | 12,526 | 42.8 | -8.1 | |
| Liberal | Penry Williams | 11,372 | 38.8 | +4.5 | |
| Labour | Henry Kegie | 5,402 | 18.4 | +3.6 | |
| Majority | 1,154 | 4.0 | -12.6 | ||
| Turnout | 76.1 | -1.6 | |||
| Unionist hold | Swing | -6.3 | |||
| Party | Candidate | Votes | % | ± | |
|---|---|---|---|---|---|
| Unionist | Mabel Philipson | 12,130 | 50.9 | +2.9 | |
| Liberal | Harold Burge Robson | 8,165 | 34.3 | -5.2 | |
| Labour | J. Adams | 3,521 | 14.8 | +2.3 | |
| Majority | 3,965 | 16.6 | +8.1 | ||
| Turnout | 77.7 | +4.3 | |||
| Unionist hold | Swing | +4.0 | |||
| Party | Candidate | Votes | % | ± | |
|---|---|---|---|---|---|
| Unionist | Mabel Philipson | 10,636 | 48.0 | -7.0 | |
| Liberal | Harold Burge Robson | 8,767 | 39.5 | +12.7 | |
| Labour | Edna Martha Penny | 2,784 | 12.5 | -5.7 | |
| Majority | 1,869 | 8.5 | -19.7 | ||
| Turnout | 73.4 | -1.5 | |||
| Unionist hold | Swing | -9.9 | |||
| Party | Candidate | Votes | % | ± | |
|---|---|---|---|---|---|
| Unionist | Mabel Philipson | 12,000 | 55.0 | n/a | |
| Liberal | Harold Burge Robson | 5,858 | 26.8 | -11.3 | |
| Labour | Gilbert Oliver | 3,966 | 18.2 | n/a | |
| Majority | 6,142 | 28.1 | +4.3 | ||
| Turnout | 21,824 | 74.9 | +8.7 | ||
| Unionist gain from National Liberal | Swing | n/a | |||
| Party | Candidate | Votes | % | ± | |
|---|---|---|---|---|---|
| National Liberal | Hilton Philipson | 11,933 | 61.9 | ||
| Liberal | Walter Runciman | 7,354 | 38.1 | ||
| Majority | 4,579 | 23.8 | |||
| Turnout | 19,287 | 66.2 | |||
| National Liberal gain from Liberal | Swing | ||||
Elections in the 1910s
| Party | Candidate | Votes | % | ± | |
|---|---|---|---|---|---|
| Liberal | Francis Blake | 6,721 | 60.5 | −0.7 | |
| Independent | William Watson-Armstrong | 4,397 | 39.5 | N/A | |
| Majority | 2,324 | 21.0 | −1.4 | ||
| Turnout | 11,118 | ||||
| Liberal hold | Swing | N/A | |||
| Party | Candidate | Votes | % | ± | |
|---|---|---|---|---|---|
| Liberal | Francis Blake | 3,794 | 85.9 | +24.7 | |
| Independent | Arthur Turnbull | 621 | 14.1 | N/A | |
| Majority | 3,173 | 71.8 | +49.4 | ||
| Turnout | 4,415 | 46.7 | −33.1 | ||
| Registered electors | 9,454 | ||||
| Liberal hold | Swing | N/A | |||
| Party | Candidate | Votes | % | ± | |
|---|---|---|---|---|---|
| Liberal | Edward Grey | 4,612 | 61.2 | +1.1 | |
| Conservative | Charles Henry Hoare | 2,926 | 38.8 | −1.1 | |
| Majority | 1,686 | 22.4 | +2.2 | ||
| Turnout | 7,538 | 79.8 | −8.5 | ||
| Registered electors | 9,445 | ||||
| Liberal hold | Swing | +1.1 | |||
| Party | Candidate | Votes | % | ± | |
|---|---|---|---|---|---|
| Liberal | Edward Grey | 5,010 | 60.1 | −4.0 | |
| Conservative | Thomas Inskip | 3,327 | 39.9 | +4.0 | |
| Majority | 1,683 | 20.2 | −8.0 | ||
| Turnout | 8,337 | 88.3 | +2.8 | ||
| Registered electors | 9,445 | ||||
| Liberal hold | Swing | −4.0 | |||
Elections in the 1900s
| Party | Candidate | Votes | % | ± | |
|---|---|---|---|---|---|
| Liberal | Edward Grey | 5,102 | 64.1 | N/A | |
| Conservative | Thomas Inskip | 2,862 | 35.9 | N/A | |
| Majority | 2,240 | 28.2 | N/A | ||
| Turnout | 7,964 | 85.5 | N/A | ||
| Registered electors | 9,316 | ||||
| Liberal hold | Swing | N/A | |||
| Party | Candidate | Votes | % | ± | |
|---|---|---|---|---|---|
| Liberal | Edward Grey | Unopposed | |||
| Liberal hold | |||||
Elections in the 1890s
| Party | Candidate | Votes | % | ± | |
|---|---|---|---|---|---|
| Liberal | Edward Grey | 4,378 | 54.9 | +2.0 | |
| Conservative | Henry Percy | 3,593 | 45.1 | −2.0 | |
| Majority | 785 | 9.8 | +4.0 | ||
| Turnout | 7,971 | 85.9 | +3.2 | ||
| Registered electors | 9,277 | ||||
| Liberal hold | Swing | +2.0 | |||
| Party | Candidate | Votes | % | ± | |
|---|---|---|---|---|---|
| Liberal | Edward Grey | 4,002 | 52.9 | −1.9 | |
| Conservative | Watson Askew-Robertson[26] | 3,560 | 47.1 | +1.9 | |
| Majority | 442 | 5.8 | −3.8 | ||
| Turnout | 7,562 | 82.7 | +4.9 | ||
| Registered electors | 9,141 | ||||
| Liberal hold | Swing | −1.9 | |||
Elections in the 1880s
| Party | Candidate | Votes | % | ± | |
|---|---|---|---|---|---|
| Liberal | Edward Grey | 4,131 | 54.8 | −2.9 | |
| Liberal Unionist | Frederick Lambton | 3,407 | 45.2 | +2.9 | |
| Majority | 724 | 9.6 | −5.8 | ||
| Turnout | 7,538 | 77.8 | −10.3 | ||
| Registered electors | 9,691 | ||||
| Liberal hold | Swing | −2.9 | |||
| Party | Candidate | Votes | % | ± | |
|---|---|---|---|---|---|
| Liberal | Edward Grey | 4,929 | 57.7 | +1.4 | |
| Conservative | Henry Percy | 3,613 | 42.3 | −1.4 | |
| Majority | 1,316 | 15.4 | +12.7 | ||
| Turnout | 8,542 | 88.1 | +8.1 (est) | ||
| Registered electors | 9,691 | ||||
| Liberal hold | Swing | +1.4 | |||
| Party | Candidate | Votes | % | ± | |
|---|---|---|---|---|---|
| Liberal | Hubert Jerningham | 1,046 | 66.4 | +10.1 | |
| Conservative | Henry John Trotter | 529 | 33.6 | −10.1 | |
| Majority | 517 | 32.8 | +30.1 | ||
| Turnout | 1,575 | 79.2 | −0.8 (est) | ||
| Registered electors | 1,989 | ||||
| Liberal hold | Swing | +10.1 | |||
- Caused by Marjoribanks elevation to the peerage, becoming Lord Tweedmouth.
| Party | Candidate | Votes | % | ± | |
|---|---|---|---|---|---|
| Conservative | David Milne Home | 584 | 50.1 | +6.4 | |
| Liberal | John McLaren | 582 | 49.9 | −6.4 | |
| Majority | 2 | 0.2 | N/A | ||
| Turnout | 1,166 | 80.8 | +0.8 (est) | ||
| Registered electors | 1,443 | ||||
| Conservative gain from Liberal | Swing | +6.4 | |||
- Caused by Strutt's elevation to the peerage, becoming Lord Belper.
| Party | Candidate | Votes | % | ± | |
|---|---|---|---|---|---|
| Liberal | Dudley Marjoribanks | 687 | 29.7 | −2.8 | |
| Liberal | Henry Strutt | 614 | 26.6 | +4.6 | |
| Conservative | William Macdonald Macdonald[29] | 552 | 23.9 | N/A | |
| Conservative | David Milne Home | 457 | 19.8 | −8.3 | |
| Majority | 62 | 2.7 | −1.7 | ||
| Turnout | 1,155 (est) | 80.0 (est) | −12.6 | ||
| Registered electors | 1,443 | ||||
| Liberal hold | Swing | +0.7 | |||
| Liberal gain from Conservative | Swing | +4.4 | |||
Elections from 1832 to 1880
| Party | Candidate | Votes | % | ± | |
|---|---|---|---|---|---|
| Liberal | 617 | 32.5 | N/A | ||
| Conservative | 533 | 28.1 | −14.1 | ||
| Liberal | John Stapleton | 418 | 22.0 | −5.6 | |
| Liberal | William Keppel | 330 | 17.4 | −12.9 | |
| Turnout | 1,216 (est) | 92.6 (est) | +14.5 | ||
| Registered electors | 1,313 | ||||
| Majority | 84 | 4.4 | −0.2 | ||
| Liberal hold | Swing | N/A | |||
| Majority | 115 | 6.1 | N/A | ||
| Conservative gain from Liberal | Swing | −2.1 | |||
| Party | Candidate | Votes | % | ± | |
|---|---|---|---|---|---|
| Liberal | 669 | 30.3 | +0.4 | ||
| Liberal | 609 | 27.6 | −0.1 | ||
| Conservative | George Wallace Carpenter[30][31] | 508 | 23.0 | +0.8 | |
| Conservative | Richard Hodgson[32] | 424 | 19.2 | −1.0 | |
| Majority | 101 | 4.6 | −0.8 | ||
| Turnout | 1,105 (est) | 78.1 (est) | −12.6 | ||
| Registered electors | 1,415 | ||||
| Liberal hold | Swing | −0.2 | |||
| Liberal hold | Swing | +0.5 | |||
| Party | Candidate | Votes | % | ± | |
|---|---|---|---|---|---|
| Liberal | 396 | 29.9 | +4.5 | ||
| Liberal | 367 | 27.7 | +7.9 | ||
| Conservative | William Cargill | 295 | 22.2 | −5.9 | |
| Conservative | Joseph Hubback[33] | 268 | 20.2 | −6.5 | |
| Majority | 72 | 5.4 | N/A | ||
| Turnout | 663 (est) | 90.7 (est) | +8.4 | ||
| Registered electors | 731 | ||||
| Liberal gain from Conservative | Swing | +5.4 | |||
| Liberal gain from Conservative | Swing | +7.1 | |||
| Party | Candidate | Votes | % | ± | |
|---|---|---|---|---|---|
| Conservative | 328 | 51.4 | −3.4 | ||
| Liberal | Alexander Mitchell | 310 | 48.6 | +3.4 | |
| Majority | 18 | 2.8 | +1.4 | ||
| Turnout | 638 | 79.8 | −2.5 | ||
| Registered electors | 799 | ||||
| Conservative hold | Swing | −3.4 | |||
- Caused by Gordon's death.
| Party | Candidate | Votes | % | ± | |
|---|---|---|---|---|---|
| Liberal | 305 | 50.1 | +4.9 | ||
| Conservative | Richard Hodgson[34] | 304 | 49.9 | −4.9 | |
| Majority | 1 | 0.2 | N/A | ||
| Turnout | 609 | 77.1 | −5.2 | ||
| Registered electors | 790 | ||||
| Liberal gain from Conservative | Swing | +4.9 | |||
- Caused by Earle's resignation.
| Party | Candidate | Votes | % | ± | |
|---|---|---|---|---|---|
| Conservative | 366 | 28.1 | +16.2 | ||
| Conservative | 348 | 26.7 | +14.8 | ||
| Liberal | Dudley Marjoribanks | 330 | 25.4 | +1.4 | |
| Liberal | John Stapleton | 257 | 19.8 | −10.2 | |
| Majority | 18 | 1.4 | N/A | ||
| Turnout | 651 (est) | 82.3 (est) | +12.2 | ||
| Registered electors | 790 | ||||
| Conservative gain from Liberal | Swing | +10.3 | |||
| Conservative gain from Liberal | Swing | +9.6 | |||
| Party | Candidate | Votes | % | ± | |
|---|---|---|---|---|---|
| Radical | 339 | 30.0 | +2.3 | ||
| Whig | 271 | 24.0 | N/A | ||
| Conservative | Charles William Gordon | 269 | 23.8 | −14.4 | |
| Whig | Matthew Forster | 348 | 24.0 | −10.1 | |
| Turnout | 565 (est) | 70.1 (est) | −7.2 | ||
| Registered electors | 805 | ||||
| Majority | 68 | 6.0 | −1.0 | ||
| Radical hold | Swing | +4.8 | |||
| Majority | 2 | 0.2 | −6.2 | ||
| Whig hold | Swing | N/A | |||
| Party | Candidate | Votes | % | ± | |
|---|---|---|---|---|---|
| Whig | 473 | 39.1 | +5.0 | ||
| Whig | 385 | 31.8 | +4.1 | ||
| Conservative | John Campbell Renton | 196 | 16.2 | −4.6 | |
| Conservative | Richard Hodgson | 157 | 13.0 | −4.4 | |
| Majority | 189 | 15.6 | +9.2 | ||
| Turnout | 606 (est) | 71.0 (est) | −6.3 | ||
| Registered electors | 853 | ||||
| Whig hold | Swing | +4.8 | |||
| Whig gain from Radical | Swing | +4.3 | |||
- Caused by the 1852 election being declared void on petition, due to bribery.[35]
| Party | Candidate | Votes | % | ± | |
|---|---|---|---|---|---|
| Whig | 412 | 34.1 | |||
| Radical | 335 | 27.7 | |||
| Conservative | John Campbell Renton | 251 | 20.8 | ||
| Conservative | Richard Hodgson | 210 | 17.4 | ||
| Turnout | 604 (est) | 77.3 (est) | |||
| Registered electors | 805 | ||||
| Majority | 77 | 6.4 | |||
| Whig hold | Swing | ||||
| Majority | 84 | 7.0 | N/A | ||
| Radical gain from Conservative | Swing | ||||
| Party | Candidate | Votes | % | ± | |
|---|---|---|---|---|---|
| Whig | 371 | ||||
| Whig | 357 | ||||
| Tory | Marcus Beresford | 345 | |||
| Majority | |||||
| Turnout | |||||
| Whig hold | Swing | ||||
See also
Notes and references
- Notes
- ↑ A county constituency (for the purposes of election expenses and type of returning officer)
- ↑ As with all constituencies, the first past the post system of election is used with elections at least every five years.
- ↑ MPs references to each other at least in writing, are entered by a full constituency name in Hansard
- References
- ↑ "Berwick-upon-Tweed: Usual Resident Population, 2011". Neighbourhood Statistics. Office for National Statistics. Retrieved 28 January 2015.
- ↑ "Electorate Figures – Boundary Commission for England". 2011 Electorate Figures. Boundary Commission for England. 4 March 2011. Archived from the original on 6 November 2010. Retrieved 13 March 2011.
- 1 2 3 4 5 6 "History of Parliament". Retrieved 2011-10-06.
- 1 2 3 4 5 6 7 8 9 "History of Parliament". Retrieved 2011-10-06.
- 1 2 3 Leigh Rayment's Historical List of MPs – Constituencies beginning with "B" (part 2)
- ↑ Created The Viscount Barrington (in the Peerage of Ireland), 1720
- ↑ Created The Lord Delaval (in the Peerage of Ireland), 1783
- ↑ Succeeded as The 4th Viscount Lisburne (in the Peerage of Ireland), January 1766
- ↑ Major-General 1776, Lieutenant-General 1782, knighted (KB) 1792
- ↑ On petition, Fordyce and Hall were adjudged not to have been duly elected and the election result was reversed
- ↑ Sherwood, Marika (2007). After Abolition: Britain and the Slave Trade since 1807. London: I.B. Tauris. p. 171. ISBN 9781845113650 – via Google Books.
- 1 2 3 Wickham, Michael John (2002). "Electoral Politics in Berwick-Upon-Tweed, 1832–1885" (PDF). Durham E-Theses Online. Durham University. p. 44. Retrieved 8 April 2018.
- ↑ "Berwick". Bedfordshire Times and Independent. 23 August 1859. p. 4. Retrieved 8 April 2018 – via British Newspaper Archive. (Subscription required (help)).
- ↑ "Election Data 2015". Electoral Calculus. Archived from the original on 17 October 2015. Retrieved 17 October 2015.
- ↑ http://www.northumberland.gov.uk/NorthumberlandCountyCouncil/media/Councillors-and-Democracy/Electoral%20Services/result-berwick-7-may-2015.pdf
- ↑ "Election Data 2010". Electoral Calculus. Archived from the original on 26 July 2013. Retrieved 17 October 2015.
- ↑ "BBC NEWS – Election 2010 – Berwick-Upon-Tweed". BBC News.
- 1 2 "Election Data 2005". Electoral Calculus. Archived from the original on 15 October 2011. Retrieved 18 October 2015.
- ↑ "Election Data 1997". Electoral Calculus. Archived from the original on 15 October 2011. Retrieved 18 October 2015.
- ↑ "Election Data 1992". Electoral Calculus. Archived from the original on 15 October 2011. Retrieved 18 October 2015.
- ↑ "Politics Resources". Election 1992. Politics Resources. 9 April 1992. Retrieved 2010-12-06.
- ↑ "Election Data 1987". Electoral Calculus. Archived from the original on 15 October 2011. Retrieved 18 October 2015.
- ↑ "Election Data 1983". Electoral Calculus. Archived from the original on 15 October 2011. Retrieved 18 October 2015.
- ↑ British parliamentary election results, 1885-1918 by FWS Craig
- 1 2 3 4 5 6 Craig, FWS, ed. (1974). British Parliamentary Election Results: 1885-1918. London: Macmillan Press. ISBN 9781349022984.
- ↑ Kingsley, Nick (11 April 2016). "(213) Askew of Redheugh, Pallinsburn and Ladykirk". Landed families of Britain and Ireland. Retrieved 2 November 2017.
- ↑ "Wednesdays Telegrams". The Cornishman (172). 27 October 1881. p. 5.
- 1 2 3 4 5 6 7 8 9 10 11 12 Craig, F. W. S., ed. (1977). British Parliamentary Election Results 1832-1885 (e-book)
|format=requires|url=(help) (1st ed.). London: Macmillan Press. ISBN 978-1-349-02349-3. - ↑ "Election Intelligence: Berwick". Manchester Courier and Lancashire General Advertiser. 30 Aug 1881. p. 5. Retrieved 23 November 2017.
- ↑ "Berwick". Newcastle Journal. 17 November 1868. p. 3. Retrieved 28 January 2018 – via British Newspaper Archive. (Subscription required (help)).
- ↑ "Election News". Yorkshire Post and Leeds Intelligencer. 14 August 1868. p. 3. Retrieved 28 January 2018 – via British Newspaper Archive. (Subscription required (help)).
- ↑ "Berwick Election". The Scotsman. 30 October 1868. p. 6. Retrieved 28 January 2018 – via British Newspaper Archive. (Subscription required (help)).
- ↑ "The General Election". Illustrated Berwick Journal. 30 June 1865. p. 3. Retrieved 28 January 2018 – via British Newspaper Archive. (Subscription required (help)).
- ↑ "Berwick". Bedfordshire Times and Independent. 23 August 1859. p. 4. Retrieved 8 April 2018 – via British Newspaper Archive. (Subscription required (help)).
- ↑ "The Berwick Election and Mr. Richard Hodgson". Newcastle Guardian and Tyne Mercury. 30 April 1853. p. 5. Retrieved 8 April 2018 – via British Newspaper Archive. (Subscription required (help)).
Sources
- "politics.co.uk". Berwick-upon-Tweed: Big seat, big issues. Archived from the original on 22 April 2005. Retrieved 30 April 2005.
- "bbc.co.uk". BBC NEWS – Vote 2001 – Results & Constituency – Berwick-upon-Tweed. Retrieved 30 April 2005.
- "Women in the house of commons" (PDF). House of Commons Factsheet. Archived from the original (PDF) on 18 May 2005. Retrieved 1 May 2005.
- "Burton Mail". Todd reveals his expenses claim. Retrieved 2 May 2005.
- "Constituencies in the unreformed House". David Boothroyd Page. Retrieved 8 September 2006.
- Robert Beatson, A Chronological Register of Both Houses of Parliament (London: Longman, Hurst, Res & Orme, 1807)
Northumberland Portal | |
| Unitary authorities | |
| Major settlements | |
| Topics | |