Regions of Italy
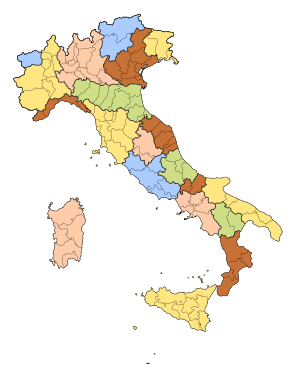
The regions of Italy (Italian: Regioni) are the first-level constituent entities of the Italian Republic, constituting its second NUTS administrative level.[1] There are 20 regions, of which five have a broader amount of autonomy than the other 15 regions. Under the Italian Constitution, each region is an autonomous entity with defined powers. With the exception of the Aosta Valley, each region is divided into a number of provinces.
| Regions Regioni (Italian) | |
|---|---|
 Friuli-
Venezia Giulia Trentino-
Alto Adige | |
| Category | Unitary state |
| Location | Italian Republic |
| Number | 20 |
| Populations | 125,666 (Aosta Valley) – 10,060,574 (Lombardy) |
| Areas | 3,261 km2 (1,259 sq mi) (Aosta Valley) – 25,832 km2 (9,974 sq mi) (Sicily) |
| Government | Regional Government, National Government |
| Subdivisions | Province |
History
During the Kingdom of Italy, regions were administrative districts of the central state. Under the Republic, they were granted a measure of political autonomy by the 1948 Italian Constitution. The original draft list comprised the Salento region (which was eventually included in the Apulia). Friuli and Venezia Giulia were separate regions, and Basilicata was named Lucania. Abruzzo and Molise were identified as separate regions in the first draft. They were later merged into Abruzzo e Molise in the final constitution of 1948. They were separated in 1963.
Implementation of regional autonomy was postponed until the first Regional elections of 1970. The ruling Christian Democracy party did not want the opposition Italian Communist Party to gain power in the regions where it was historically rooted (the red belt of Emilia-Romagna, Tuscany, Umbria and the Marches).
Regions acquired a significant level of autonomy following a constitutional reform in 2001 (brought about by a centre-left government and confirmed by popular referendum), which granted them residual policy competence. A further federalist reform was proposed by the regionalist party Lega Nord and in 2005, the centre-right government led by Silvio Berlusconi proposed a new reform that would have greatly increased the power of regions.[2]
The proposals, which had been particularly associated with Lega Nord, and seen by some as leading the way to a federal state, were rejected in the 2006 Italian constitutional referendum by 61.7% to 38.3%.[2] The results varied considerably among the regions, ranging from 55.3% in favor in Veneto to 82% against in Calabria.[2]
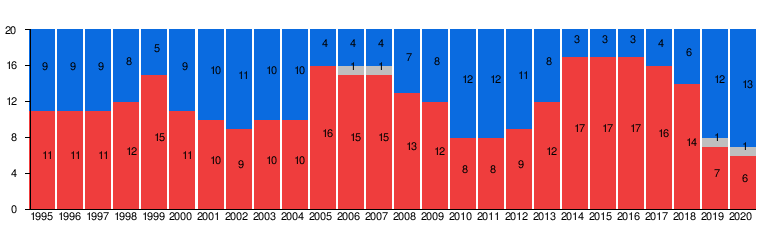
Regional administration
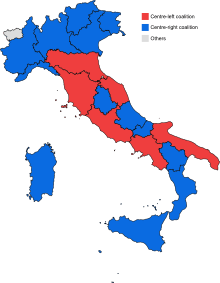
Number of regions governed by each coalition since 1995:
Regions
| Flag | Region Italian name (if different) |
Status | Population[3] January 2019 |
Area | Pop. density | HDI[4] | Capital | President | Number of comuni[5] | Prov. or metrop. cities | |||
|---|---|---|---|---|---|---|---|---|---|---|---|---|---|
| Number | % | km² | % | ||||||||||
| Abruzzo | Ordinary | 1,311,580 | 2.17% | 10,832 | 3.59% | 121 | 0.890 | L'Aquila | Marco Marsilio Brothers of Italy |
305 | 4 | ||
| Aosta Valley Valle d'Aosta |
Autonomous | 125,666 | 0.21% | 3,261 | 1.08% | 39 | 0.878 | Aosta | Antonio Fosson For Our Valley |
74 | 1 | ||
| Apulia Puglia |
Ordinary | 4,029,053 | 6.68% | 19,541 | 6.48% | 206 | 0.852 | Bari | Michele Emiliano Democratic Party |
258 | 6 | ||
| Basilicata | Ordinary | 562,869 | 0.93% | 10,073 | 3.34% | 56 | 0.857 | Potenza | Vito Bardi Forza Italia |
131 | 2 | ||
| Calabria | Ordinary | 1,947,131 | 3.23% | 15,222 | 5.04% | 128 | 0.850 | Catanzaro | Jole Santelli Forza Italia |
404 | 5 | ||
| Campania | Ordinary | 5,801,692 | 9.61% | 13,671 | 4.53% | 424 | 0.847 | Naples | Vincenzo De Luca Democratic Party |
550 | 5 | ||
| Emilia-Romagna | Ordinary | 4,459,477 | 7.39% | 22,453 | 7.44% | 199 | 0.915 | Bologna | Stefano Bonaccini Democratic Party |
328 | 9 | ||
| Friuli Venezia Giulia | Autonomous | 1,215,220 | 2.01% | 7,924 | 2.63% | 153 | 0.898 | Trieste | Massimiliano Fedriga League |
215 | 4 | ||
| Lazio | Ordinary | 5,879,082 | 9.74% | 17,232 | 5.71% | 341 | 0.909 | Rome | Nicola Zingaretti Democratic Party |
378 | 5 | ||
| Liguria | Ordinary | 1,550,640 | 2.57% | 5,416 | 1.79% | 286 | 0.896 | Genoa | Giovanni Toti Cambiamo! |
234 | 4 | ||
| Lombardy Lombardia |
Ordinary | 10,060,574 | 16.67% | 23,864 | 7.91% | 422 | 0.907 | Milan | Attilio Fontana League |
1,509 | 12 | ||
| Marche | Ordinary | 1,525,271 | 2.53% | 9,401 | 3.12% | 162 | 0.896 | Ancona | Luca Ceriscioli Democratic Party |
228 | 5 | ||
| Molise | Ordinary | 305,617 | 0.51% | 4,461 | 1.48% | 69 | 0.867 | Campobasso | Donato Toma Forza Italia |
136 | 2 | ||
| Piedmont Piemonte |
Ordinary | 4,356,406 | 7.22% | 25,387 | 8.41% | 172 | 0.892 | Turin | Alberto Cirio Forza Italia |
1,182 | 8 | ||
| Sardinia Sardegna |
Autonomous | 1,639,591 | 2.72% | 24,100 | 7.99% | 68 | 0.863 | Cagliari | Christian Solinas Sardinian Action Party |
377 | 5 | ||
| Sicily Sicilia |
Autonomous | 4,999,891 | 8.28% | 25,832 | 8.56% | 194 | 0.845 | Palermo | Nello Musumeci Diventerà Bellissima |
390 | 9 | ||
| Trentino-South Tyrol Trentino-Alto Adige |
Autonomous | 1,072,276 | 1.78% | 13,606 | 4.51% | 79 | 0.919 | Trento | Arno Kompatscher South Tyrolean People's Party |
291 | 2 | ||
| Tuscany Toscana |
Ordinary | 3,729,641 | 6.18% | 22,987 | 7.62% | 162 | 0.903 | Florence | Enrico Rossi Democratic Party |
273 | 10 | ||
| Umbria | Ordinary | 882,015 | 1.46% | 8,464 | 2.81% | 104 | 0.889 | Perugia | Donatella Tesei League |
92 | 2 | ||
| Veneto | Ordinary | 4,905,854 | 8.13% | 18,020 | 5.97% | 267 | 0.896 | Venice | Luca Zaia League |
571 | 7 | ||
| Italy Italia |
— | 60,359,546 | 100.00% | 301,747 | 100.00% | 200 | 0.887 | Rome | Sergio Mattarella Independent |
7,926 | 107 | ||
Macroregions
Macroregions are the first-level NUTS of the European Union.(it)
| Map | Macroregion Italian name |
Regions | Major city | Population January 2019 |
Area (km²) | Population density (km-2) | ||
|---|---|---|---|---|---|---|---|---|
| Number | % | km² | % | |||||
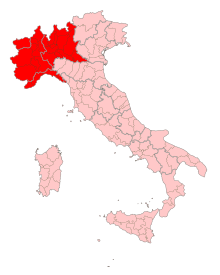 |
North-West Nord-Ovest |
Aosta Valley Liguria Lombardy Piedmont |
Milan | 16,093,286 | 26.66% | 57,928 | 19.18% | 278 |
 |
North-East Nord-Est |
Emilia-Romagna Friuli-Venezia Giulia Trentino-South Tyrol Veneto |
Bologna | 11,652,827 | 19.31% | 62,003 | 20.63% | 187 |
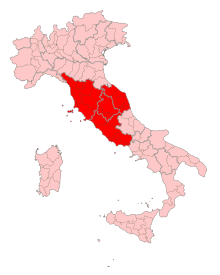 |
Centre Centro |
Lazio Marche Tuscany Umbria |
Rome | 12,016,009 | 19.91% | 58,085 | 19.23% | 208 |
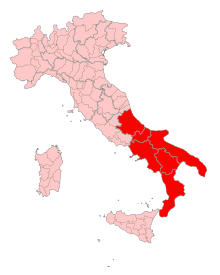 |
South Sud |
Abruzzo Apulia Basilicata Calabria Campania Molise |
Naples | 13,957,942 | 23.12% | 73,800 | 24.43% | 191 |
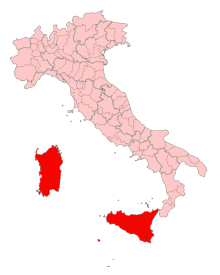 |
Islands Isole or Insulare (adj) |
Sardinia Sicily |
Palermo | 6,639,482 | 11.00% | 49,932 | 16.53% | 135 |
Status
Every region has a statute that serves as a regional constitution, determining the form of government and the fundamental principles of the organization and the functioning of the region, as prescribed by the Constitution of Italy (Article 123). Although all the regions except Tuscany define themselves in various ways as an "autonomous Region" in the first article of their Statutes,[6] fifteen regions have ordinary statutes and five have special statutes, granting them extended autonomy.
Regions with ordinary statute
These regions, whose statutes are approved by their regional councils, were created in 1970, even though the Italian Constitution dates back to 1948. Since the constitutional reform of 2001 they have had residual legislative powers. The regions have exclusive legislative power with respect to any matters not expressly reserved to state law (Article 117).[7] Yet their financial autonomy is quite modest: they just keep 20% of all levied taxes, mostly used to finance the region-based healthcare system.[8]
Autonomous regions with special statute
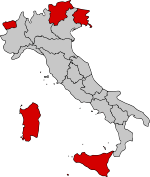
Article 116 of the Italian Constitution grants home rule to five regions, namely Sardinia, Sicily, Trentino-Alto Adige/Südtirol, Aosta Valley and Friuli-Venezia Giulia, allowing them some legislative, administrative and financial power to a varying extent, depending on their specific statute. These regions became autonomous in order to take into account cultural differences and protect linguistic minorities. Moreover, the government wanted to prevent their secession from Italy after the Second World War.[9]
Institutions
Each region has an elected parliament, called Consiglio Regionale (regional council), or Assemblea Regionale (regional assembly) in Sicily, and a government called Giunta Regionale (regional committee), headed by a governor called Presidente della Giunta Regionale (president of the regional committee) or Presidente della Regione (regional president). The latter is directly elected by the citizens of each region, with the exceptions of Aosta Valley and Trentino-Alto Adige/Südtirol, where he is chosen by the regional council.
Under the 1995 electoral law, the winning coalition receives an absolute majority of seats on the council. The president chairs the giunta, and nominates or dismisses its members, called assessori. If the directly elected president resigns, new elections are called immediately.
In Trentino-Alto Adige/Südtirol, the regional council is made up of the joint session of the two provincial councils of Trentino and of South Tyrol, and the regional governor is one of the two provincial commissioners.
Representation in the Senate
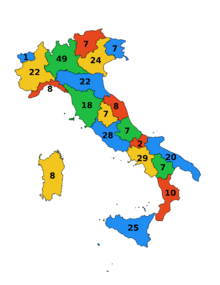
Article 57 of the Constitution of Italy establishes that the Senate of the Italian Republic is elected on a regional basis (excluding 6 senators elected by Italians residing abroad and a small number of senators for life) by Italian citizens aged 25 or older.
The 309 senators are assigned to each region proportionally according to their population. However, Article 57 of the Constitution provides that no region can have fewer than seven senators representing it, except for the Aosta Valley (which has one) and Molise (which has two).
| Region | Seats[10] | Region | Seats | Region | Seats |
|---|---|---|---|---|---|
| 7 | 7 | 8 | |||
| 1 | 28 | 25 | |||
| 20 | 8 | 7 | |||
| 7 | 49 | 18 | |||
| 10 | 8 | 7 | |||
| 29 | 2 | 24 | |||
| 22 | 22 | Overseas constituencies | 6 |
Economy of regions and macroregions
| Flag | Name | GDP 2011, million EUR[11] |
GDP per capita 2011, EUR[11] |
GDP 2011, million PPS[11] |
GDP per capita 2011, PPS[11] |
|---|---|---|---|---|---|
| Abruzzo | 30,073 | 22,400 | 29,438 | 21,900 | |
| Aosta Valley | 4,328 | 33,700 | 4,236 | 33,000 | |
| Apulia | 69,974 | 17,100 | 68,496 | 16,700 | |
| Basilicata | 10,744 | 18,300 | 10,517 | 17,900 | |
| Calabria | 33,055 | 16,400 | 32,357 | 16,100 | |
| Campania | 93,635 | 16,000 | 91,658 | 15,700 | |
| Emilia-Romagna | 142,609 | 32,100 | 139,597 | 31,400 | |
| Friuli-Venezia Giulia | 36,628 | 29,600 | 35,855 | 29,000 | |
| Lazio | 172,246 | 29,900 | 168,609 | 29,300 | |
| Liguria | 43,998 | 27,200 | 43,069 | 26,700 | |
| Lombardy | 337,161 | 33,900 | 330,042 | 33,200 | |
| Marche | 40,877 | 26,100 | 40,014 | 25,500 | |
| Molise | 6,414 | 20,100 | 6,278 | 19,700 | |
| Piedmont | 125,997 | 28,200 | 123,336 | 27,600 | |
| Sardinia | 33,075 | 19,700 | 32,377 | 19,300 | |
| Sicily | 83,956 | 16,600 | 82,183 | 16,300 | |
| Trentino-Alto Adige | 35,797 | 34,450 | 35,041 | 33,700 | |
| Tuscany | 106,013 | 28,200 | 103,775 | 27,600 | |
| Umbria | 21,533 | 23,700 | 21,078 | 23,200 | |
| Veneto | 149,527 | 30,200 | 146,369 | 29,600 | |
| Code | Name | GDP 2011, million EUR[11] |
GDP per capita 2011, EUR[11] |
GDP 2011, million PPS[11] |
GDP per capita 2011, PPS[11] |
|---|---|---|---|---|---|
| ITE | Centre | 340,669 | 28,400 | 333,475 | 27,800 |
| ITD | North-East | 364,560 | 31,200 | 356,862 | 30,600 |
| ITC | North-West | 511,484 | 31,700 | 500,683 | 31,000 |
| ITG | Islands | 117,031 | 17,400 | 114,560 | 17,000 |
| ITF | South | 243,895 | 17,200 | 238,744 | 16,800 |
| - | Extra-regio | 2,771 | – | 2,712 | – |
See also
- Italian NUTS level 1 regions
- Regional Council (Italy)
- Presidents of Regions of Italy
- List of Italian regions by GDP
- List of Italian regions by GRP per capita
- List of Italian regions by Human Development Index
- Flags of regions of Italy
- ISO 3166-2:IT
Other administrative divisions
- Provinces of Italy
- Municipalities of Italy
References
- "National structures". Eurostat. Archived from the original on 13 July 2014. Retrieved 6 December 2011.
- "Speciale Referendum 2006". la Repubblica. 26 June 2006. Retrieved 6 December 2011.
- "Population Italian Regions". tuttitalia.it.
- "Sub-national HDI - Area Database - Global Data Lab". hdi.globaldatalab.org.
- "Italian Comuni". tuttitalia.it.
- Pinto, Luciano Torrente-Paolo Strazzullo-Roberto. "Statuti Regionali - Casa Editrice: Edizioni Simone". www.simone.it.
- LL.M., Prof. Dr. Axel Tschentscher. "ICL - Italy - Constitution". servat.unibe.ch.
- Report RAI - Le regioni a statuto speciale (Italian), retrieved 21st Jan 2009 Archived 2009-03-22 at the Wayback Machine,
- Hiroko Kudo, “Autonomy and Managerial Innovation in Italian Regions after Constitutional Reform”, Chuo University, Faculty of Law and Graduate School of Public Policy (2008): p. 1. Retrieved on April 6, 2012 from http://www.med-eu.org/proceedings/MED1/Kudo.pdf Archived 2015-11-17 at the Wayback Machine.
- "senato.it - XVII Legislatura - Senatori eletti nella regione Piemonte". www.senato.it.
- "GDP per capita in the EU in 2011" (PDF). Archived from the original (PDF) on 2014-03-07.
External links
| Wikimedia Commons has media related to Regions of Italy. |
- CityMayors article
- Regional Governments of Italy on Italia.gov.it
- Regional Governments of Italy on Governo.it