Energy in Italy
Italy consumed about 185 Mtoe of primary energy in 2010.[1] This came mostly from fossil fuels. Among the most used resources are petroleum (mostly used for the transport sector), natural gas (used for electric energy production and heating), coal and renewables.
An important share of electricity comes from import, mainly from Switzerland and France. The share of primary energy dedicated to electricity production is above 35%,[2] and grew steadily since the 1970s.
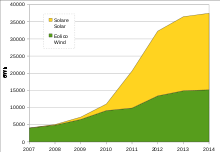
Electricity is produced mainly from natural gas, which accounts for the source of more than half of the total final electric energy produced. Another important source is hydroelectric power, which was practically the only source of electricity until 1960. Wind and solar power grew rapidly between 2010 and 2013 thanks to high incentives.
Italy has few energy resources, and most of supplies are imported.[3]
Overview
| Population million |
Prim. energy TWh |
Production TWh |
Import TWh |
Electricity TWh |
CO2-emission Mt | |
|---|---|---|---|---|---|---|
| 2004 | 58.1 | 2,145 | 351 | 1,837 | 328 | 462 |
| 2007 | 59.3 | 2,072 | 307 | 1,837 | 339 | 438 |
| 2008 | 59.9 | 2,047 | 313 | 1,810 | 339 | 430 |
| 2009 | 60.2 | 1,915 | 314 | 1,642 | 317 | 389 |
| 2012 | 60.7 | 1,947 | 367 | 1,641 | 327 | 393 |
| 2012R | 60.9 | 1,847 | 371 | 1,542 | 321 | 375 |
| 2013 | 60.7 | 1,807 | 428 | 1,433 | 311 | 338 |
| Change 2004-2009 | 3.5% | -10.8% | -10.4% | -10.6% | -3.3% | -15.8% |
| Mtoe = 11.63 TWh. Prim. energy includes energy losses
2012R = CO2 calculation criteria changed, numbers updated | ||||||
Electricity
In 2014 Italy consumed 291.083 TWh (4790 kWh/person) in electricity, consumption in household were 1057 kWh/person.[5] Italy is a net importer of electricity: the country imported 46,747.5 GWh and exported 3,031.1 GWh in 2014. Gross production in 2014 was 279.8 TWh. The main power sources are natural gas and hydroelectricity.[5]
Terna provides realtime information on the grid through their official website: https://www.terna.it/en/electric-system/transparency-report
Italy has no nuclear power since it was banished in 1987 by referendum. In Tuscany was built the first geothermal power station. In 2014 the geothermal production was 5.92 TWh. All active Italian geothermal power stations are now in Tuscany.[5]
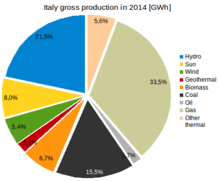
| Italian gross electricity production by sources in 2014[TWh] [5] | ||
|---|---|---|
| Hydroelectric | 60.256 | 21.5% |
| Thermal | 176.171 | - |
| of which by Geothermal | 5.919 | 2.1% |
| of which by Natural Gas | 93.637 | 33.5% |
| of which by Coal | 43.455 | 15.5% |
| of which by Oil | 4.764 | 1.7% |
| of which by Biomass | 18.732 | 6.7% |
| Wind | 15.178 | 5.4% |
| Solar | 22.306 | 8.0% |
Emissions
According to Energy Information Administration, the 2009 Italian CO2 emissions from energy consumption were 408 Mt, slightly below Indonesia 413 mt. worldwide, Italy was ranked 17th in 2009 according to this list. The Italian emissions decline of 9% in 2008–2009 was rather influenced by the European economic recession 2008–2009 than large sustainable changes in energy consumption. From 2008 to 2009 change was at a 6.9% decline in Europe and at a 7.5 increase in Asia & Oceania.[6]
Emissions of consumption could be a more significant indicator rather than national greenhouse production: many European companies have moved production from Europe to Asia the last ten years, which does not necessarily change the overall emissions of the world or the company. According to the Guardian, the most widely cited international dataset for consumption emissions is from year 2001 including the consumption emissions per capita of all greenhouse gases.[7] Italy’s footprint in 2001 was 12 ton CO2 per person (rank no 21)[8] Italy’s domestic share of greenhouse gas emissions was 62%.[9]
See also
References
- BP data
- data from Terna - Italian electric grid
- IEA Key energy statistics 2010
- IEA Key World Energy Statistics Statistics 2015, 2014 (2012R as in November 2015 + 2012 as in March 2014 is comparable to previous years statistical calculation criteria, 2013, 2012, 2011, 2010, 2009 Archived 7 October 2013 at the Wayback Machine, 2006 Archived 12 October 2009 at the Wayback Machine IEA October, crude oil p.11, coal p. 13 gas p. 15
- "TERNA statistics data". Archived from the original on 18 May 2012. Retrieved 21 September 2015.
- World carbon dioxide emissions data by country: China speeds ahead of the rest Guardian 31 January 2011
- Which nations are most responsible for climate change? Guardian 21 April 2011
- "Carbon foot print of nations". Archived from the original on 7 October 2011. Retrieved 5 May 2011.
- Carbon Footprint of Nations: A Global, Trade-Linked Analysis Archived 24 February 2012 at the Wayback Machine Environ. Sci. Technol. 2009, 43, 6414–6420
