Southampton Test (UK Parliament constituency)
Southampton Test is a constituency[n 1] represented in the House of Commons of the UK Parliament since 1997 by Alan Whitehead, a member of the Labour Party.[n 2]
| Southampton Test | |
|---|---|
| Borough constituency for the House of Commons | |
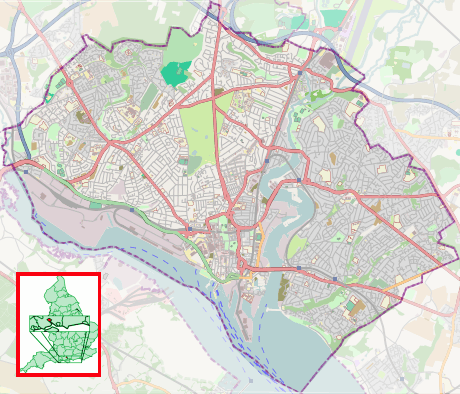
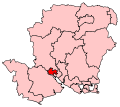 Boundary of Southampton Test in Hampshire | |
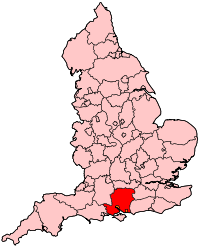 Location of Hampshire within England | |
| County | Hampshire |
| Electorate | 71,263 (December 2010)[1] |
| Major settlements | Southampton |
| Current constituency | |
| Created | 1950 |
| Member of Parliament | Alan Whitehead (Labour) |
| Number of members | One |
| Created from | Southampton |
History
The constituency was created for the 1950 general election, when the previous two-member Southampton constituency was abolished. The boundaries of the seat have changed at most of the Boundary Commissions' periodic reviews.
Horace King, after being the member in the first half of the 1950s, would later become the first Speaker of the House of Commons from the Labour Party.
Southampton Test proved to be a bellwether (mirroring the national result) from 1966 until 2010, with the exception of the minority government of Harold Wilson from February to October 1974 (see Second Wilson Ministry).
Whitehead for Labour performed better here than John Denham in Southampton Itchen, the other Southampton seat, which the party also held in the 2010 general election. The area from 2010-2015 was one of four Labour seats in South East England (a largely EU-purposes "region") and since 2017 is among two of eighteen in Hampshire won by Labour candidates.[2] Whitehead was elected in 2017 with a majority of over 10,000 votes, and in 2019 over 6,000, making Southampton Test a relatively comfortable Labour seat.
Constituency profile
The seat covers the western part of the City of Southampton and is named after the River Test, one of the city's two rivers. It covers some of the leafy northern suburbs (though the northernmost Bassett Ward ceased to form part of the constituency in 1997) and the western port areas as well as the social housing estates of the western fringes. It is traditionally the marginally more affluent of the two constituencies in the city, before 2010 having a higher number of Tory representatives than its neighbour Southampton Itchen — named after the other major river. The area includes the University of Southampton, though its halls of residence fall almost entirely within Romsey and Southampton North or Southampton Itchen. Workless claimants, registered jobseekers, were in November 2012 close to but slightly below than the national average of 3.8%, at 3.4% of the population based on a statistical compilation by The Guardian, above the average for the South East seats of 2.5% but below, for example, five seats in East Kent.[3]
The seat is home to Southampton FC's football ground at St Mary's.
Boundaries
1950–1955: The County Borough of Southampton wards of All Saints, Banister, Freemantle, Millbrook, St Nicholas, Shirley, and Town; and the (civil) Parish of Millbrook (which was then in the Romsey and Stockbridge Rural District).[4]
1955–1983: The County Borough of Southampton wards of Banister, Bargate, Bassett, Coxford, Freemantle, Millbrook, Portswood, Redbridge, and Shirley.
1983–1997: The City of Southampton wards of Bassett, Coxford, Freemantle, Millbrook, Portswood, Redbridge, and Shirley.
1997–2010: The City of Southampton wards of Coxford, Freemantle, Millbrook, Portswood, Redbridge, St Luke's, and Shirley.[5]
2010–present: The City of Southampton wards of Bevois, Coxford, Freemantle, Millbrook, Portswood, Redbridge, and Shirley.
The constituency is bounded to the east by Southampton Itchen, to the north by Romsey and Southampton North and to the west by New Forest East.
Members of Parliament
| Election | Member[6] | Party | Notes | |
|---|---|---|---|---|
| 1950 | Horace King | Labour | Speaker of the House of Commons from 1965 to 1971 | |
| 1955 | John Howard | Conservative | ||
| 1964 | John Fletcher-Cooke | Conservative | ||
| 1966 | Bob Mitchell | Labour | ||
| 1970 | James Hill | Conservative | ||
| October 1974 | Bryan Gould | Labour | Member of the Shadow Cabinet from 1986 to 1994 | |
| 1979 | James Hill | Conservative | ||
| 1997 | Alan Whitehead | Labour | ||
Elections
Elections in the 2010s
| Party | Candidate | Votes | % | ± | |
|---|---|---|---|---|---|
| Labour | Alan Whitehead | 22,256 | 49.5 | -9.2 | |
| Conservative | Steven Galton | 16,043 | 35.7 | +1.6 | |
| Liberal Democrats | Joe Richards | 3,449 | 7.7 | +3.7 | |
| Brexit Party | Philip Crook | 1,591 | 3.5 | N/A | |
| Green | Katherine Barbour | 1,433 | 3.2 | N/A | |
| Independent | Kev Barry | 222 | 0.5 | N/A | |
| Majority | 6,213 | 13.8 | -10.8 | ||
| Turnout | 44,994 | 64.2 | -2.6 | ||
| Labour hold | Swing | -5.4 | |||
| Party | Candidate | Votes | % | ± | |
|---|---|---|---|---|---|
| Labour | Alan Whitehead | 27,509 | 58.7 | +17.4 | |
| Conservative | Paul Holmes | 16,006 | 34.1 | +1.6 | |
| Liberal Democrats | Thomas Gravatt | 1,892 | 4.0 | -0.9 | |
| Southampton Independents | Andrew Pope | 816 | 1.7 | N/A | |
| Independent | Keith Morrell | 680 | 1.4 | N/A | |
| Majority | 11,508 | 24.6 | +15.9 | ||
| Turnout | 46,908 | 66.8 | +4.7 | ||
| Labour hold | Swing | +7.9 | |||
| Party | Candidate | Votes | % | ± | |
|---|---|---|---|---|---|
| Labour | Alan Whitehead | 18,017 | 41.3 | +2.8 | |
| Conservative | Jeremy Moulton | 14,207 | 32.5 | -0.5 | |
| UKIP | Pearline Hingston | 5,566 | 12.8 | +8.8 | |
| Green | Angela Mawle | 2,568 | 5.9 | +3.9 | |
| Liberal Democrats | Adrian Ford | 2,121 | 4.9 | -17.5 | |
| Independent | Chris Davis | 770 | 1.8 | N/A | |
| TUSC | Nick Chaffey | 403 | 0.9 | +0.9 | |
| Majority | 3,810 | 8.8 | +3.3 | ||
| Turnout | 43,652 | 62.1 | +0.7 | ||
| Labour hold | Swing | +1.7 | |||
| Party | Candidate | Votes | % | ± | |
|---|---|---|---|---|---|
| Labour | Alan Whitehead | 17,001 | 38.5 | -5.7 | |
| Conservative | Jeremy Moulton | 14,588 | 33.0 | +8.0 | |
| Liberal Democrats | Dave Callaghan | 9,865 | 22.3 | -1.8 | |
| UKIP | Pearline Hingston | 1,726 | 3.9 | +0.9 | |
| Green | Chris Bluemel | 881 | 2.0 | -1.6 | |
| Majority | 2,413 | 5.5 | -11.3 | ||
| Turnout | 44,187 | 61.4 | +5.4 | ||
| Labour hold | Swing | −6.9 | |||
Elections in the 2000s
| Party | Candidate | Votes | % | ± | |
|---|---|---|---|---|---|
| Labour | Alan Whitehead | 17,845 | 42.7 | −9.8 | |
| Conservative | Stephen MacLoughlin | 10,827 | 25.9 | +0.4 | |
| Liberal Democrats | Steve Sollitt | 10,368 | 24.8 | +6.7 | |
| Green | John Spottiswoode | 1,482 | 3.5 | N/A | |
| UKIP | Peter Day | 1,261 | 3.0 | +1.1 | |
| Majority | 7,018 | 16.8 | -10.2 | ||
| Turnout | 41,783 | 53.7 | −2.6 | ||
| Labour hold | Swing | −5.1 | |||
| Party | Candidate | Votes | % | ± | |
|---|---|---|---|---|---|
| Labour | Alan Whitehead | 21,824 | 52.5 | -1.7 | |
| Conservative | Richard Gueterbock | 10,617 | 25.5 | -2.5 | |
| Liberal Democrats | John Shaw | 7,522 | 18.1 | +4.4 | |
| UKIP | Garry Rankin-Moore | 792 | 1.9 | +1.5 | |
| Socialist Alliance | Mark Abel | 442 | 1.1 | N/A | |
| Socialist Labour | Paramjit Bahia | 378 | 0.9 | N/A | |
| Majority | 11,207 | 27.0 | +1.0 | ||
| Turnout | 41,575 | 56.3 | -15.4 | ||
| Labour hold | Swing | ||||
Elections in the 1990s
| Party | Candidate | Votes | % | ± | |
|---|---|---|---|---|---|
| Labour | Alan Whitehead | 28,396 | 54.1 | +11.7 | |
| Conservative | James Hill | 14,712 | 28.1 | −15.3 | |
| Liberal Democrats | Alan Dowden | 7,171 | 13.7 | +0.6 | |
| Referendum | Peter Day | 1,397 | 2.7 | ||
| Legalise Cannabis | Howard Marks | 388 | 0.7 | ||
| UKIP | Anthony McCabe | 219 | 0.4 | N/A | |
| Independent | Paul Taylor | 81 | 0.2 | N/A | |
| Natural Law | John Sinel | 77 | 0.1 | N/A | |
| Majority | 13,684 | 26.0 | |||
| Turnout | 52,441 | 71.9 | -5.5 | ||
| Labour gain from Conservative | Swing | ||||
| Party | Candidate | Votes | % | ± | |
|---|---|---|---|---|---|
| Conservative | James Hill | 24,504 | 43.4 | −2.2 | |
| Labour | Alan Whitehead | 23,919 | 42.4 | +9.1 | |
| Liberal Democrats | Diana Maddock | 7,391 | 13.1 | −8.1 | |
| Green | Jonathan M. Michaelis | 535 | 0.9 | +0.9 | |
| Natural Law | David Plummer | 101 | 0.2 | +0.2 | |
| Majority | 585 | 1.0 | −11.3 | ||
| Turnout | 56,450 | 77.4 | +1.0 | ||
| Conservative hold | Swing | −5.6 | |||
Elections in the 1980s
| Party | Candidate | Votes | % | ± | |
|---|---|---|---|---|---|
| Conservative | James Hill | 25,722 | 45.6 | +0.4 | |
| Labour | Alan Whitehead | 18,768 | 33.3 | +5.2 | |
| Liberal | V. Rayner | 11,950 | 21.2 | -5.5 | |
| Majority | 6,954 | 12.3 | -4.8 | ||
| Turnout | 76.4 | +3.3 | |||
| Conservative hold | Swing | -2.4 | |||
| Party | Candidate | Votes | % | ± | |
|---|---|---|---|---|---|
| Conservative | James Hill | 24,657 | 45.19 | ||
| Labour | Alan Whitehead | 15,311 | 28.06 | ||
| SDP | A. Vinson | 14,592 | 26.74 | ||
| Majority | 9,346 | 17.13 | |||
| Turnout | 73.07 | ||||
| Conservative hold | Swing | ||||
Elections in the 1970s
| Party | Candidate | Votes | % | ± | |
|---|---|---|---|---|---|
| Conservative | James Hill | 27,198 | 46.36 | ||
| Labour | Bryan Gould | 25,075 | 42.74 | ||
| Liberal | D. Hughes | 6,393 | 10.90 | ||
| Majority | 2,123 | 3.62 | |||
| Turnout | 76.30 | ||||
| Conservative gain from Labour | Swing | ||||
| Party | Candidate | Votes | % | ± | |
|---|---|---|---|---|---|
| Labour | Bryan Gould | 22,780 | 42.17 | ||
| Conservative | James Hill | 22,250 | 41.109 | ||
| Liberal | J.R. Wallis | 8,994 | 16.65 | ||
| Majority | 530 | 0.98 | |||
| Turnout | 73.11 | ||||
| Labour gain from Conservative | Swing | ||||
| Party | Candidate | Votes | % | ± | |
|---|---|---|---|---|---|
| Conservative | James Hill | 23,742 | 40.88 | ||
| Labour | Bryan Gould | 22,339 | 38.46 | ||
| Liberal | J.R. Wallis | 12,000 | 20.66 | ||
| Majority | 1,403 | 2.42 | |||
| Turnout | 79.21 | ||||
| Conservative hold | Swing | ||||
| Party | Candidate | Votes | % | ± | |
|---|---|---|---|---|---|
| Conservative | James Hill | 24,660 | 47.54 | ||
| Labour | Bob Mitchell | 22,858 | 44.07 | ||
| Liberal | Jack Wallis | 4,349 | 8.38 | ||
| Majority | 1,802 | 3.47 | |||
| Turnout | 73.33 | ||||
| Conservative gain from Labour | Swing | ||||
Elections in the 1960s
| Party | Candidate | Votes | % | ± | |
|---|---|---|---|---|---|
| Labour | Bob Mitchell | 24,628 | 48.37 | ||
| Conservative | John Fletcher-Cooke | 22,188 | 43.58 | ||
| Liberal | Graham Cleverley | 4,102 | 8.06 | ||
| Majority | 2,440 | 4.79 | |||
| Turnout | 78.13 | ||||
| Labour gain from Conservative | Swing | ||||
| Party | Candidate | Votes | % | ± | |
|---|---|---|---|---|---|
| Conservative | John Fletcher-Cooke | 25,700 | 50.34 | ||
| Labour | Bob Mitchell | 25,352 | 49.66 | ||
| Majority | 348 | 0.68 | |||
| Turnout | 76.69 | ||||
| Conservative hold | Swing | ||||
Elections in the 1950s
| Party | Candidate | Votes | % | ± | |
|---|---|---|---|---|---|
| Conservative | John Howard | 30,176 | 56.31 | ||
| Labour | Shirley Williams | 23,410 | 43.69 | ||
| Majority | 6,766 | 12.63 | |||
| Turnout | 79.88 | ||||
| Conservative hold | Swing | ||||
| Party | Candidate | Votes | % | ± | |
|---|---|---|---|---|---|
| Conservative | John Howard | 26,707 | 51.21 | ||
| Labour | Anthony Crosland | 22,865 | 43.84 | ||
| Liberal | Stanley Little | 2,583 | 4.95 | ||
| Majority | 3,842 | 7.37 | |||
| Turnout | 78.72 | ||||
| Conservative gain from Labour | Swing | ||||
| Party | Candidate | Votes | % | ± | |
|---|---|---|---|---|---|
| Labour | Horace King | 26,430 | 50.44 | ||
| Conservative and National Liberal | John Paul | 25,965 | 49.56 | ||
| Majority | 465 | 0.89 | |||
| Turnout | 83.52 | ||||
| Labour hold | Swing | ||||
| Party | Candidate | Votes | % | ± | |
|---|---|---|---|---|---|
| Labour | Horace King | 25,052 | 47.08 | ||
| National Liberal and Conservative | P. Brembridge | 23,663 | 45.15 | ||
| Liberal | Stephen Fry | 3,697 | 7.05 | ||
| Majority | 1,389 | 2.65 | |||
| Turnout | 84.39 | ||||
| Labour hold | Swing | ||||
Notes and references
- Notes
- A borough constituency (for the purposes of election expenses and type of returning officer)
- As with all constituencies, the constituency elects one Member of Parliament (MP) by the first past the post system of election at least every five years.
- References
- "Electorate Figures – Boundary Commission for England". 2011 Electorate Figures. Boundary Commission for England. 4 March 2011. Archived from the original on 6 November 2010. Retrieved 13 March 2011.
- "South East Results after 84 of 84". BBC News.
- Unemployment claimants by constituency The Guardian
- Representation of the People Act 1948, Sch. 1.
- The Parliamentary Constituencies (England) Order 1995, SI 1995 No 1626
- Leigh Rayment's Historical List of MPs – Constituencies beginning with "T" (part 1)
- "Southampton Test Parliamentary constituency". BBC News. BBC. Retrieved 27 November 2019.
- "Election Data 2015". Electoral Calculus. Archived from the original on 17 October 2015. Retrieved 17 October 2015.
- "BBC NEWS – Election 2015 – Southampton Test". BBC News.
- "Election Data 2010". Electoral Calculus. Archived from the original on 26 July 2013. Retrieved 17 October 2015.
- "BBC NEWS – Election 2010 – Southampton Test". BBC News.
- "Election Data 2005". Electoral Calculus. Archived from the original on 15 October 2011. Retrieved 18 October 2015.
- "Election Data 2001". Electoral Calculus. Archived from the original on 15 October 2011. Retrieved 18 October 2015.
- "Election Data 1997". Electoral Calculus. Archived from the original on 15 October 2011. Retrieved 18 October 2015.
- "Election Data 1992". Electoral Calculus. Archived from the original on 15 October 2011. Retrieved 18 October 2015.
- "Politics Resources". Election 1992. Politics Resources. 9 April 1992. Retrieved 6 December 2010.
- This was an unusual election, where an incumbent was challenged by two people who later became MPs.
- "Election Data 1987". Electoral Calculus. Archived from the original on 15 October 2011. Retrieved 18 October 2015.
- "Election Data 1983". Electoral Calculus. Archived from the original on 15 October 2011. Retrieved 18 October 2015.
- The Times' Guide to the House of Commons. 1970.
- The Times' Guide to the House of Commons. 1966.
- The Times' Guide to the House of Commons. 1964.
- The Times' Guide to the House of Commons. 1959.
- The Times' Guide to the House of Commons. 1955.
- The Times' Guide to the House of Commons. 1951.
- The Times' Guide to the House of Commons. 1950.
Areas and suburbs of Southampton | |||||||
|---|---|---|---|---|---|---|---|
| |||||||
| Southampton Itchen |
| ||||||
| Southampton Test | |||||||
| Romsey and Southampton North | |||||||
| |||||||
| |||||||