Khanpur, Rahim Yar Khan
Khanpur (Urdu خانپور) is a city and capital of Khanpur Tehsil of the Rahim Yar Khan District, Bahawalpur Division, in the Punjab province of Pakistan. It is the 45th largest city of Pakistan by population according to the 2017 census.
Khanpur خانپور | |
|---|---|
 Khanpur 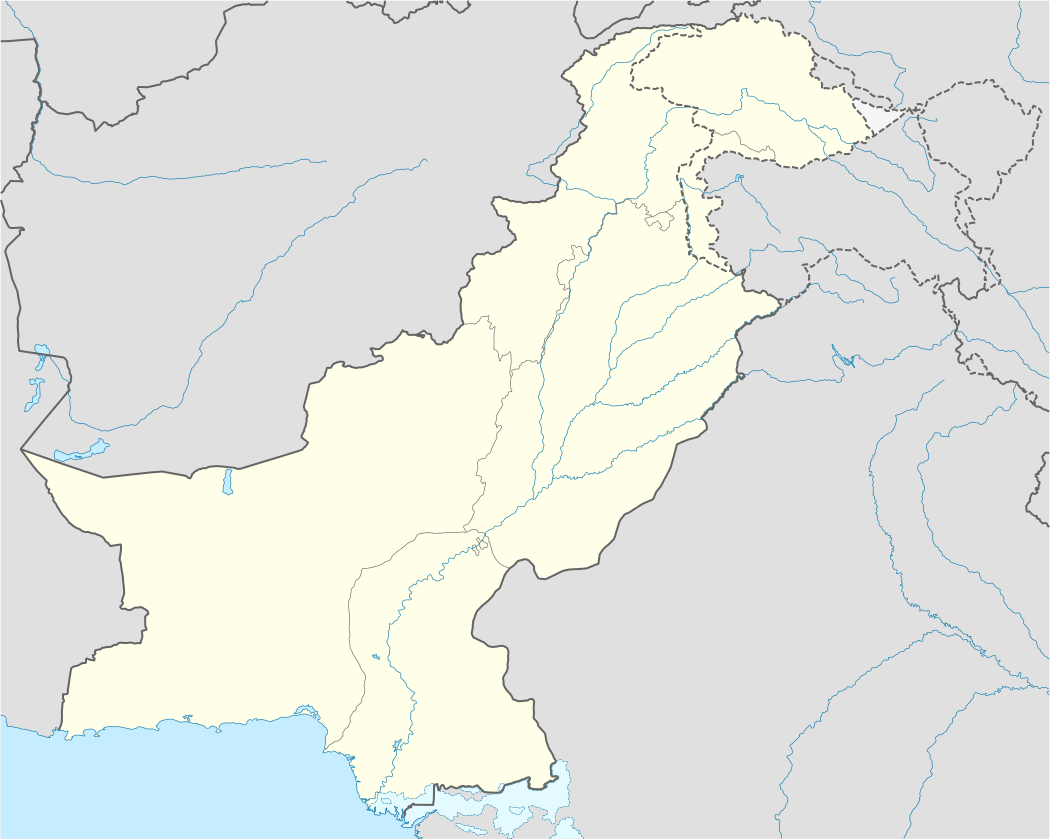 Khanpur | |
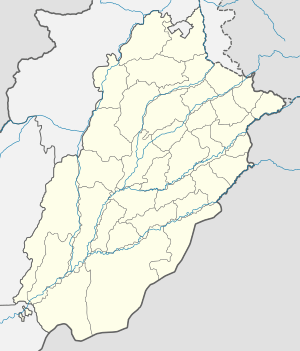
| Coordinates: 28.650°N 70.680°E | |
| Country | |
| Province | |
| District | Rahim Yar Khan |
| Government | |
| Area | |
| • Metro | 3,065 km2 (1,183 sq mi) |
| Population | |
| • City | 184,793 |
| • Rank | 45th, Pakistan |
| Time zone | UTC+5 (PST) |
| Calling code | 06855 |
Demography
According to the census of 1998, the city population was 117,764 with an annual growth rate of 2.6%. As of 2009, the recorded population of Khanpur was 156,152 And According to 2017 Census Report the total population of Khanpur Tehsil is 983,415.[2]
Climate
Khanpur has a hot desert climate (Köppen climate classification BWh) with hot summers and mild winters. Rainfall is low, but some rain does fall in the monsoon season from July to September.
| Climate data for Khanpur | |||||||||||||
|---|---|---|---|---|---|---|---|---|---|---|---|---|---|
| Month | Jan | Feb | Mar | Apr | May | Jun | Jul | Aug | Sep | Oct | Nov | Dec | Year |
| Record high °C (°F) | 29.4 (84.9) |
32.8 (91.0) |
40.6 (105.1) |
45.6 (114.1) |
47.8 (118.0) |
48.0 (118.4) |
46.7 (116.1) |
43.3 (109.9) |
42.2 (108.0) |
41.1 (106.0) |
37.0 (98.6) |
32.0 (89.6) |
48.0 (118.4) |
| Average high °C (°F) | 21.8 (71.2) |
24.4 (75.9) |
30.2 (86.4) |
37.0 (98.6) |
41.3 (106.3) |
42.5 (108.5) |
39.9 (103.8) |
38.4 (101.1) |
37.0 (98.6) |
34.8 (94.6) |
29.4 (84.9) |
23.5 (74.3) |
33.4 (92.0) |
| Daily mean °C (°F) | 13.1 (55.6) |
15.9 (60.6) |
21.5 (70.7) |
27.7 (81.9) |
32.5 (90.5) |
34.8 (94.6) |
33.6 (92.5) |
32.4 (90.3) |
30.1 (86.2) |
25.6 (78.1) |
19.7 (67.5) |
14.4 (57.9) |
25.1 (77.2) |
| Average low °C (°F) | 4.4 (39.9) |
7.3 (45.1) |
12.8 (55.0) |
18.5 (65.3) |
23.6 (74.5) |
27.2 (81.0) |
27.3 (81.1) |
26.3 (79.3) |
23.1 (73.6) |
16.3 (61.3) |
10.1 (50.2) |
5.3 (41.5) |
16.9 (62.3) |
| Record low °C (°F) | −3.3 (26.1) |
−2.8 (27.0) |
2.0 (35.6) |
6.5 (43.7) |
11.0 (51.8) |
13.0 (55.4) |
17.0 (62.6) |
18.0 (64.4) |
14.8 (58.6) |
5.0 (41.0) |
0.6 (33.1) |
−4.3 (24.3) |
−4.3 (24.3) |
| Average precipitation mm (inches) | 4.4 (0.17) |
5.4 (0.21) |
5.6 (0.22) |
2.8 (0.11) |
5.1 (0.20) |
2.8 (0.11) |
27.5 (1.08) |
23.0 (0.91) |
15.5 (0.61) |
1.2 (0.05) |
0.7 (0.03) |
3.3 (0.13) |
97.3 (3.83) |
| Mean monthly sunshine hours | 261.3 | 244.3 | 269.9 | 287.1 | 310.4 | 283.5 | 274.9 | 293.8 | 289.7 | 307.2 | 287.9 | 260.5 | 3,370.5 |
| Source: NOAA (1961–1990)[3] | |||||||||||||
See also
- Sipra
- Gujjar
- Punjabi people
- Liaquat Pur
- Firoza
- Rahim yar Khan
- Bahawalpur
- Bahawalpur (princely state)
- Rajput
References
- "Pakistan: Provinces and Major Cities - Population Statistics, Maps, Charts, Weather and Web Information". www.citypopulation.de. Retrieved 17 March 2020.
- "Pakistan: largest cities and towns and statistics of their population". Archived from the original on 17 October 2013.
- "Khanpur Climate Normals 1961–1990". National Oceanic and Atmospheric Administration. Retrieved 17 January 2013.
Neighbourhoods of Rahim Yar Khan | ||
|---|---|---|
Administrations: Rahim Yar Khan District | ||
| Tehsils |  | |
| Cities |
| |
| Towns and councils |
| |
| Villages |
| |
| Bahawalpur |
| ||||||||||||
|---|---|---|---|---|---|---|---|---|---|---|---|---|---|
| Dera Ghazi Khan |
| ||||||||||||
| Faisalabad |
| ||||||||||||
| Gujranwala |
| ||||||||||||
| Lahore |
| ||||||||||||
| Multan |
| ||||||||||||
| Rawalpindi |
| ||||||||||||
| Sahiwal |
| ||||||||||||
| Sargodha |
| ||||||||||||
This article is issued from Wikipedia. The text is licensed under Creative Commons - Attribution - Sharealike. Additional terms may apply for the media files.