Energy in California
Energy in California is a major area of the economy of California. Per capita consumption is some of the lowest in the United States as a result of a long term policy of energy efficiency. California is the state with the largest population and the largest economy in the United States. However, it is second in energy consumption after Texas.

Energy consumption in California is dominated by transportation, due to high number of motor vehicles and long commutes. California also is responsible for about 20% of total jet fuel consumption in the United States. The second largest energy sector is industry. Energy consumption of the state's residential sector per capita is lower than that of any other state except Hawaii thanks to relatively mild climate.[2]
California has large energy resources, being among the top producers of oil, hydroelectricity, solar, biomass, and geothermal energy in the United States.
Electricity
Natural gas-fired power plants typically account for almost one-half of in-state electricity generation. California is one of the largest hydroelectric power producers in the United States, and with adequate rainfall, hydroelectric power typically accounts for close to one-fifth of State electricity generation. Due to strict emission laws no coal-fired power plants operate in California.
California's peak electricity demand occurred on July 24, 2006, at 2:44 pm, with 50,270 megawatts. Since then measures to reduce peak load have resulted in decreased peak demand, even as the state's population has continued to grow.[3] In 2017, the peak load was 50,116 MW, on September 1.[4]
Although California's population increased by 13% during the 1990s, the state did not build any new major power plants during that time, although existing in-state power plants were expanded and power output was increased nearly 30% from 1990 to 2001. However, between 2000 and 2015, California built nearly 500 new power plants to supplement the 700 operating in 2000, boosting power supplies by 43%.[5]
In 2016, CPUC announced new rules for connecting coming generation sources to grid. Connection costs must be estimated by the utility, and the developer is limited to paying within ±25% change of the estimate. CPUC expects the rules to lower overall costs for ratepayers.[6][7][8] California requires 1.8 GW of utility storage[9] and studies long duration bulk energy storage. The state allocates US$83 million per year during 2017-2019 for behind-the-meter storage.[10] The plan was amended in 2020 to a combined $613 million by 2024.[11]
California's electricity rates are among the highest in the United States as a result of the changing energy mix within the state, including aggressive construction of new natural gas power plants.[5] As of 2016 California's electricity costs were 17.4 cents per kWh for residential customers and 14.8 cents per kWh for commercial.[12] Due to high electricity demand, California imports more electricity than any other state, primarily wind and hydroelectric power from states in the Pacific Northwest (via Path 15 and Path 66) and nuclear, coal-, and natural gas-fired production from the desert Southwest via Path 46.[13] Imported coal-fired electricity is expected to decline as power agreements expire and the city of Los Angeles phases out its use of such electricity by 2025.[14][15]
Grid
The electric grid is made of up electric transmission and electric distribution, with electric production by itself averaging about 44% of the cost nationally.[16] California was historically a leader in high-voltage transmission, which has led to increased wildfire risks.[17] As of 2019, transmission costs are the fastest-growing part of the bill, and Transmission Access Charges (TAC) are applied regardless of how far electricity travels across the grid.[18]
California is part of the Western Interconnection, with transmission lines from the Pacific Northwest including the California Oregon Intertie (Path 15 and Path 66) and to the east Pacific DC Intertie.
Transmission lines under construction as of 2019 include the TransWest Express, which would connect Wyoming to Nevada, which is already connected to Southern California via Path 46.
Renewables
California leads the nation in electricity generation from non-hydroelectric renewable energy sources, including geothermal power, wind power, and solar power. California has some of the most aggressive renewable energy goals in the United States.[19] The state is required to obtain at least 33% of its electricity from renewable resources by 2020, and 50% by 2030, excluding large hydro.[20][21] On May 13, 2017, the California Independent System Operator (ISO) reported that the state had broken a new instantaneous renewable energy record, with non-hydro renewables providing 67.2% of the total electricity on the ISO's grid, with another 13.5% being provided by hydro.[22] Intermittent renewables have led to a peak demand and peak production imbalance creating a "duck curve".
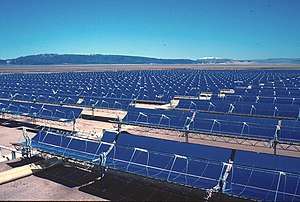
Solar Energy Generating Systems (SEGS) is the name given to nine solar power plants in the Mojave Desert which were built in the 1980s. These plants have a combined capacity of 354 megawatts (MW) making them at one time the largest solar power installation in the world.[23] Other large solar plants in the Mojave Desert include the 392 MW Ivanpah Solar Power Facility,[24] opened in 2014, and the 550 MW Desert Sunlight Solar Farm and 579 MW Solar Star, both completed in 2015. The Beacon Solar Project, which generates 250 MW for the LADWP, was completed in 2017 in the northwestern Mojave Desert.[25]
The Alta Wind Energy Center in the Tehachapi Mountains is the largest wind power plant in the United States with 1,548 MW installed capacity.[26] A facility known as "The Geysers," located in the Mayacamas Mountains north of San Francisco, is the largest group of geothermal power plants in the world, with more than 750 MW of installed capacity. California's hydroelectric power potential ranks second in the United States (behind Washington State), and substantial geothermal and wind power resources are found along the coastal mountain ranges and the eastern border with Nevada. High solar power potential is found in southeastern California's deserts.
Nuclear
California's single remaining operational nuclear power plant, Diablo Canyon Power Plant, accounts for less than one-tenth of total generation. California used to have multiple other nuclear power plants, including the Rancho Seco Nuclear Generating Station, the San Onofre Nuclear Generating Station, the Vallecitos Nuclear Center,[27] and the Humboldt Bay Nuclear Power Plant,[28] in addition to various other smaller experimental or prototype reactors which intermittently supplied power to the grid, such as the Sodium Reactor Experiment. However all of these reactors have been shut down due to both economic[29] and social[30] factors. Currently, the owner of the Diablo Canyon plant, Pacific Gas & Electric, has plans to shut down the two reactors at the site in 2025.[31] The plant produces about 18 TWh per year. Between 2014 and 2018, the increase of solar power electricity in California was about the same amount, from 12.8 TWh to 31.6 TWh per year including imports from other states, or from 10.6 TWh to 27.3 TWh per year for in-state generation.[32][33]
Energy storage
Bill 2514 directed the California Public Utilities Commission (CPUC) to adopt an energy storage program and procurement target.[34] As a result, the CPUC established an energy storage target of 1,325 MW by 2020.[35]
Regulatory policy
The California Energy Commission is the primary energy policy and planning agency. As of 2017, California is a deregulated electricity market.[36] It has a number of electric load-serving entities, including as of 2015 six investor-owned utilities (IOU), 46 publicly owned utilities, 4 electric cooperatives, 3 community choice aggregators, and 22 electric service providers.[36] Major investor-owned utilities, regulated by the California Public Utilities Commission, include Southern California Edison, Pacific Gas & Electric, and San Diego Gas & Electric.[37] The remaining 3 IOUs are Pacificorp, Bear Valley Electric, and Liberty Utilities.[38]
California has a regional transmission organization called CAISO covering its state, but is not merged with the rest of the Western United States; merging has been a major policy discussion with proposals considered in 2017 and 2018.[39]
California's investor-owned utilities were transitioning to time-of-use pricing, with SD&E slated to roll it out in 2019 and the others rolling it out in 2020.[40]
Electricity system data
As of 2018, 31.7% of electricity was imported out of which 33.2% was of unspecified origin and 29.2% were renewables.
| Year | Wind | Solar | Small hydro | Geothermal | Biomass | Large hydro | Coal | Nuclear | Natural gas | Unspecified | Renewable |
|---|---|---|---|---|---|---|---|---|---|---|---|
| 2009 | 3.1% | 0.3% | 1.7% | 4.6% | 2.3% | 9.1% | 8.1% | 13.1% | 42.0% | 15.7% | 12.0% |
| 2010 | 4.7% | 0.3% | 1.9% | 4.6% | 2.4% | 10.5% | 7.7% | 13.9% | 41.9% | 12.0% | 13.9% |
| 2011 | 5.0% | 0.4% | 2.1% | 4.5% | 2.1% | 13.0% | 8.2% | 15.2% | 35.3% | 14.2% | 14.1% |
| 2012 | 6.3% | 0.9% | 1.5% | 4.4% | 2.3% | 8.3% | 7.5% | 9.0% | 43.4% | 16.4% | 15.4% |
| 2013 | 8.6% | 1.8% | 1.3% | 4.5% | 2.7% | 7.8% | 7.8% | 8.8% | 44.3% | 12.5% | 18.8% |
| 2014 | 8.1% | 4.2% | 0.9% | 4.4% | 2.5% | 5.5% | 6.4% | 8.5% | 44.5% | 15.0% | 20.1% |
| 2015 | 8.2% | 6.0% | 0.9% | 4.4% | 2.6% | 5.4% | 6.0% | 9.2% | 44.0% | 13.5% | 21.9% |
| 2016 | 9.1% | 8.1% | 1.7% | 4.4% | 2.3% | 10.2% | 4.1% | 9.2% | 36.5% | 14.4% | 25.5% |
| 2017 | 9.4% | 10.2% | 2.7% | 4.4% | 2.4% | 14.7% | 4.1% | 9.1% | 33.7% | 9.3% | 29.0% |
| 2018 | 11.4% | 11.4% | 1.6% | 4.5% | 2.3% | 10.7% | 3.3% | 9.0% | 34.9% | 10.5% | 31.3% |
| Year | Wind | Solar | Small hydro | Geothermal | Biomass | Large hydro | Coal | Nuclear | Natural gas | Renewable |
|---|---|---|---|---|---|---|---|---|---|---|
| 2009 | 3.0% | 0.4% | 2.0% | 6.2% | 2.9% | 12.1% | 1.8% | 15.2% | 56.3% | 14.5% |
| 2010 | 3.0% | 0.4% | 2.4% | 6.2% | 2.8% | 14.3% | 1.7% | 15.7% | 53.4% | 14.9% |
| 2011 | 3.8% | 0.5% | 3.1% | 6.3% | 2.9% | 18.2% | 1.6% | 18.2% | 45.4% | 16.6% |
| 2012 | 4.6% | 0.9% | 2.1% | 6.4% | 3.0% | 11.7% | 0.8% | 9.3% | 61.1% | 17.1% |
| 2013 | 6.4% | 2.2% | 1.7% | 6.3% | 3.2% | 10.4% | 0.5% | 9.0% | 60.5% | 19.6% |
| 2014 | 6.5% | 5.3% | 1.2% | 6.1% | 3.4% | 7.1% | 0.5% | 8.6% | 61.3% | 22.8% |
| 2015 | 6.2% | 7.7% | 1.2% | 6.1% | 3.2% | 5.9% | 0.3% | 9.5% | 59.9% | 24.5% |
| 2016 | 6.8% | 10.0% | 2.3% | 5.8% | 3.0% | 12.3% | 0.2% | 9.6% | 49.9% | 27.9% |
| 2017 | 6.2% | 11.8% | 3.1% | 5.7% | 2.8% | 17.9% | 0.2% | 8.7% | 43.4% | 29.7% |
| 2018 | 7.2% | 14% | 2.1% | 5.9% | 3.0% | 11.3% | 0.15% | 9.4% | 46.5% | 32.3% |
| Year | Wind | Solar | Small hydro | Geothermal | Biomass | Large hydro | Coal | Nuclear | Natural gas | Total |
|---|---|---|---|---|---|---|---|---|---|---|
| 2002 | 3.5 | 0.9 | 4.4 | 13.9 | 7.1 | 26.9 | 27.6 | 34.4 | 90.9 | 209.7 |
| 2003 | 3.5 | 0.8 | 5.1 | 13.8 | 5.6 | 30.9 | 27.2 | 35.6 | 92.4 | 214.8 |
| 2004 | 4.3 | 0.7 | 4.7 | 14.0 | 5.9 | 29.7 | 28.6 | 30.2 | 105.0 | 223.1 |
| 2005 | 4.4 | 0.7 | 5.4 | 14.4 | 6.0 | 34.5 | 28.1 | 36.2 | 96.1 | 225.8 |
| 2006 | 4.9 | 0.6 | 5.8 | 13.5 | 5.7 | 43.1 | 17.6 | 32.0 | 107.0 | 230.1 |
| 2007 | 5.7 | 0.7 | 3.7 | 13.0 | 5.4 | 23.3 | 4.2 | 35.7 | 118.3 | 209.9 |
| 2008 | 5.7 | 0.7 | 3.7 | 12.9 | 5.7 | 21.0 | 4.0 | 32.5 | 122.2 | 208.5 |
| 2009 | 6.3 | 0.9 | 4.0 | 12.9 | 5.9 | 25.1 | 3.7 | 31.5 | 116.7 | 207.2 |
| 2010 | 6.2 | 0.9 | 5.0 | 12.7 | 5.8 | 29.3 | 3.4 | 32.2 | 109.8 | 205.4 |
| 2011 | 7.6 | 1.1 | 6.1 | 12.7 | 5.8 | 36.6 | 3.1 | 36.7 | 91.2 | 200.9 |
| 2012 | 9.2 | 1.8 | 4.3 | 12.7 | 6.0 | 23.2 | 1.6 | 18.5 | 121.7 | 199.1 |
| 2013 | 12.7 | 4.3 | 3.3 | 12.5 | 6.4 | 20.8 | 1.0 | 17.9 | 120.9 | 199.8 |
| 2014 | 13.1 | 10.6 | 2.7 | 12.2 | 6.8 | 13.7 | 1.0 | 17.0 | 122.0 | 199.2 |
| 2015 | 12.2 | 15.0 | 2.4 | 12.0 | 6.4 | 11.6 | 0.5 | 18.5 | 117.5 | 196.5 |
| 2016 | 13.5 | 19.8 | 4.6 | 11.6 | 5.9 | 24.2 | 0.3 | 18.9 | 98.8 | 198.2 |
| 2017 | 12.9 | 24.3 | 6.4 | 11.7 | 5.8 | 36.9 | 0.3 | 17.9 | 89.6 | 206.3 |
| 2018 | 14.0 | 27.3 | 4.2 | 11.5 | 5.9 | 22.1 | 0.3 | 18.3 | 90.7 | 194.8 |
Petroleum production
| Year | Gallons | m3 | Change |
|---|---|---|---|
| 2000 | 14,544,627,116 | 55.1×10⁶ | |
| 2001 | 15,117,143,010 | 57.2×10⁶ | +3.9% |
| 2002 | 15,513,415,849 | 58.7×10⁶ | +2.6% |
| 2003 | 15,661,671,712 | 59.3×10⁶ | +1.0% |
| 2004 | 15,908,278,251 | 60.2×10⁶ | +1.6% |
| 2005 | 15,937,855,020 | 60.3×10⁶ | +0.2% |
| 2006 | 15,825,386,719 | 59.9×10⁶ | −0.7% |
| 2007 | 15,672,334,029 | 59.3×10⁶ | −1.0% |
| 2008 | 15,032,229,963 | 56.9×10⁶ | −4.1% |
| 2009 | 14,811,281,527 | 56.1×10⁶ | −1.5% |
| 2010 | 14,868,892,787 | 56.3×10⁶ | +0.4% |
| 2011 | 14,600,133,763 | 55.3×10⁶ | −1.8% |
| 2012 | 14,504,794,174 | 54.9×10⁶ | −0.7% |
| 2013 | 14,532,944,431 | 55.0×10⁶ | +0.2% |
| 2014 | 14,702,632,422 | 55.7×10⁶ | +1.2% |
| 2015 | 15,105,348,840 | 57.2×10⁶ | +2.7% |
| 2016 | 15,487,956,872 | 58.6×10⁶ | +2.5% |
California's crude oil and natural gas deposits are located in six geological basins in the Central Valley and along the coast. California has more than a dozen of the United States' largest oil fields, including the Midway-Sunset Oil Field, the second largest oil field in the contiguous United States.
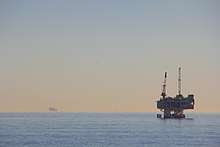
As of 2012, California's crude oil output accounted for about 8.3% of total U.S. production.[44] Drilling operations are concentrated primarily in Kern County and the Los Angeles basin.[44] Although there is also substantial offshore oil and gas production, there is a permanent moratorium on new offshore oil and gas leasing in California waters and a deferral of leasing in Federal waters.
California ranks third in the United States in petroleum refining capacity, behind Texas and Louisiana, and accounts for about 11% of total U.S. capacity, as of 2012.[44] In addition to oil from California, California's refineries process crude oil from Alaska and foreign suppliers. The refineries are configured to produce cleaner fuels, including reformulated motor gasoline and low-sulfur diesel, to meet strict Federal and State environmental regulations. As of 2017, California has 18 refineries with a capacity to process nearly 2,000,000 US barrels (240,000 m3) per day.[45][46]
Transportation
Transportation is a major use of energy, driven in part by long commuting distances.[47] In 2017, transportation accounted for 40% of total energy use,[48] and in 2015, transportation was estimated to be the largest source of greenhouse gas emissions.[49]
Gasoline consumption fluctuates with economic conditions and gas prices, but has generally remained flat since 2000, despite increasing population.[50] In 2017, Texas surpassed California in gasoline consumption, despite California having 6 million more vehicles.[51] Most California motorists are required to use a special motor gasoline blend called California Clean Burning Gasoline (CA CBG).[52] By 2004, California completed a transition from methyl tertiary butyl-ether (MTBE) to ethanol as a gasoline oxygenate additive, making California the largest ethanol fuel market in the United States. There are four ethanol production plants in central and southern California, but most of California's ethanol supply is transported from other states or abroad.
As of 2018, California is a leader in the United States in electric vehicles.[53] The Alternative and Renewable Fuel and Vehicle Technology Program,[54] also called the Clean Transportation Program, arose out of 2007 law and is intended to drive growth in electric vehicles.[55] California faces a potential shortage in charging stations,[56] and setup California Electric Vehicle Infrastructure Project (CALeVIP) program to build more chargers.[57]
Building energy
Buildings use energy for lighting, heating, ventilation, and air conditioning (HVAC) systems, and water heating. In addition, municipalities pump water which requires energy; by one estimate, about 19% of electricity is used to treat, pump, and discharge water.[58]
The California Building Standards Code has targeted residential energy efficiency since 1978;[59] Part 11 of the code is the California Green Building Standards Code.
Natural gas
California natural gas production typically is less than 2 percent of total annual U.S. production and satisfies less than one-sixth of state demand.[60][61] California receives most of its natural gas by pipeline from production regions in the Rocky Mountains, the Southwest, and western Canada.[61] Some of this is seasonally stored in the Aliso Canyon Oil Field, and its 2015 leak caused California to install grid batteries to compensate.[62]
Sustainable
California has led the United States from 2010 to 2013 with its sustainable energy plans (also known as "clean energy"), with Clean Edge's Clean Energy Index for 2013 rating it at 91.7, with the second ranked state being Massachusetts, at 77.8, and Mississippi the lowest at 4.2. California is the only state with extensive deployment of wind, solar, and geothermal energy. California's venture capital investments in sustainable energy are greater than the other 49 states combined, at $2.2 billion in 2012.[63] In August 2018, California's legislature passed legislation that mandates completely carbon-free electricity generation by 2045.[64][65]
Energy-efficient lighting regulations
In September 2019, the Energy Department announced the reversal of a 2014 regulation that would have taken effect on January 1, 2020 and implemented the last round of energy-saving light bulb regulations outlined by the Energy Independence and Security Act of 2007.[66][67] The ruling would allow some types of incandescent bulbs to remain in service. California, along with Colorado, Nevada, Washington, and Vermont, adopted its own energy standards.[68] The California regulations were challenged in court by light bulb manufacturers but a judge ruled it was proper under the congressional exemption previously granted.[69]
See also
- Solar power in California
- Wind power in California
- Offshore oil and gas in California
- California oil and gas industry
- California independent system operator
- List of power stations in California
- California Electricity Crisis
- List of articles associated with nuclear issues in California
References
- U.S. Energy Information Administration, Electric Power Monthly, February 2018
- "California, State Energy Profile". Official Energy Statistics from the U.S. Government. Energy Information Administration. Archived from the original on 2010-12-29. Retrieved 2007-10-02.
- Martinez, Sierra (November 1, 2011). "California Is Making History by Eliminating Its Growth in Peak Demand". Natural Resources Defense Council.
- "California ISO Peak Load History" (PDF). Caiso.com. Retrieved 22 June 2018.
- Penn, Ivan; Menezes, Ryan (February 5, 2017). "A runaway energy industry is costing California billions". Los Angeles Times.
- "New California Interconnection Ruling Increases Transparency and Limits Costs". Greentechmedia.com. Retrieved 14 August 2016.
- "How California Created a New System for Determining the Costs of Grid Connection". Greentechmedia.com. Retrieved 14 August 2016.
- "Archived copy" (PDF). Archived from the original (PDF) on 2016-08-28. Retrieved 2016-08-14.CS1 maint: archived copy as title (link)
- "AB-2868 Energy storage. (2015-2016)". Leginfo.legislaturte.ca.gov. Retrieved 14 October 2016.
- California Ramps Up Energy Storage Plans with Enactment of Four New Bills September 28, 2016
- John, Jeff St (21 January 2020). "California Finalizes Plan Shifting Key Energy Storage Incentive Toward Blackout Resilience". www.greentechmedia.com.
- The Opportunity of Energy Group-Buying EnPowered, April 18, 2016,
- "California - State Energy Profile Overview - U.S. Energy Information Administration (EIA)". Tonto.eia.doe.gov. Archived from the original on 29 December 2010. Retrieved 6 November 2017.
- Peterson, Molly (February 26, 2013). "Los Angeles to end use of coal by 2025, says Mayor Antonio Villaraigosa". Southern California Public Radio.
- "Current and Expected Energy From Coal for California" (PDF). California Energy Commission. November 3, 2016.
- Murray, Brian. "The Paradox of Declining Renewable Costs and Rising Electricity Prices". Forbes. Retrieved 2019-10-14.
- "Op-Ed: California is uniquely fire-prone thanks to its long romance with high-voltage power lines". Los Angeles Times. 2019-01-28. Retrieved 2019-10-14.
- "How to protect California ratepayers, expand clean local energy and avoid bailing out PG&E". Utility Dive. Retrieved 2019-10-14.
- California OKs new transmission for renewables Reuters, December 17, 2009.
- "California ISO - Clean, green grid". Caiso.com.
- "California Renewables Portfolio Standard". California Public Utilities Commission.
- Fracassa, Dominic (May 18, 2017). "California grid sets record, with 67% of power from renewables". San Francisco Chronicle.
- SunLab (1998).Solar Trough Systems Retrieved December 18, 2008.
- Sacrificing the desert to save the Earth LA Times February 5, 2012.
- https://www.energy.ca.gov/sitingcases/beacon/Description.pdf
- "California Clean Energy Tour: Alta Wind Farm Powers Homes". California Energy Commission.
- SchdyInventTech (15 January 2013). "Vallecitos Boiling Water Reactor - 1958". YouTube.
- "NRC: Humboldt Bay". Nrc.gov. Retrieved 6 November 2017.
- "SCE Publishes 3,200 Pages of Documentation on Faulty SONGS Steam Generators - News - Nuclear Power News - Nuclear Street - Nuclear Power Plant News, Jobs, and Careers". Nuclearstreet.com.
- "Voters, in a First, Shut Down Nuclear Reactor". The New York Times. 8 June 1989.
- "PG&E To Close Diablo Canyon In 2025 - News - Nuclear Power News - Nuclear Street - Nuclear Power Plant News, Jobs, and Careers". Nuclearstreet.com. Retrieved 6 November 2017.
- "California Solar Energy Statistics and Data(Section: Solar PV and Solar Thermal Electricity Production)". Retrieved January 24, 2020.
- "Total System Electric Generation". California Energy Commission. 2019-06-24. Retrieved 6 June 2020.
- "AB 2514 - Energy Storage System Procurement Targets from Publicly Owned Utilities". California Public Utilities Commission.
- "California Energy Storage Showcase". California Public Utilities Commission.
- "Energy policy in California". Ballotpedia. Retrieved 2019-08-23.
- "California is set to hit its green-energy goals a decade early". Engadget. Retrieved 2019-08-23.
- "Electric Utilities in California". ww2.energy.ca.gov. Retrieved 2020-05-16.
- Roberts, David (2018-07-31). "California's huge energy decision: link its grid to its neighbors, or stay autonomous?". Vox. Retrieved 2019-10-06.
- "California utilities prep nation's biggest time-of-use rate rollout". Utility Dive. Retrieved 2019-10-14.
- "California Electrical Energy Generation". California Energy Commission. Archived from the original on 23 June 2018. Retrieved 22 June 2018.
- "Net Taxable Gasoline Gallons" (PDF). California Board of Equalization. 2000–2009. Archived from the original (PDF) on April 2, 2010.
- "Net Taxable Gasoline Gallons" (PDF). California Board of Equalization. 2010–2016. Archived from the original (PDF) on June 13, 2017.
- "Oil and Gas in California: The Industry and Its Economic Contribution in 2012" (PDF). Western States Petroleum Association. Los Angeles County Economic Development Corporation. Archived from the original (PDF) on 2017-05-25. Retrieved 2017-01-23.
- "California Number and Capacity of Petroleum Refineries". U.S. Energy Information Administration. January 1, 2017.
- "California's Oil Refineries". California Energy Commission.
- "California Profile". www.eia.gov. Retrieved 2019-10-06.
- "California - State Energy Profile Overview - U.S. Energy Information Administration (EIA)". www.eia.gov. Retrieved 2019-10-06.
- Roberts, David (2017-08-22). "California has a climate problem, and its name is cars". Vox. Retrieved 2019-10-06.
- "Economic Perspective" (PDF). California Board of Equalization. February 2013.
- Kohlman, Matt (March 31, 2017). "Pickup vs. Prius: Texas passes California as gasoline consumption king". S&P Global Platts.
- Board, California Air Resources. "Cleaner-Burning Gasoline: An Update". Arb.ca.gov. Retrieved 2017-02-16.
- "The continued transition to electric vehicles in U.S. cities | International Council on Clean Transportation". theicct.org. Retrieved 2019-10-13.
- "ARTICLE 2. Alternative and Renewable Fuel and Vehicle Technology Program [44272 - 44273]". leginfo.legislature.ca.gov. Retrieved 2019-10-13.
- "Alternative and Renewable Fuel and Vehicle Technology Program Proceedings". ww2.energy.ca.gov. Retrieved 2019-10-13.
- "Quantifying the electric vehicle charging infrastructure gap across U.S. markets | International Council on Clean Transportation". theicct.org. Retrieved 2019-10-13.
- "California Electric Vehicle Infrastructure Project | Center for Sustainable Energy". energycenter.org. Retrieved 2019-10-13.
- "Energy-Water Nexus: The Water Sector's Energy Use" (PDF). Congressional Research Service.
- Levinson, Arik (2016). "How Much Energy Do Building Energy Codes Save? Evidence from California Houses". The American Economic Review. 106 (10): 2867–2894. doi:10.1257/aer.20150102. ISSN 0002-8282. JSTOR 43956938.
- "Natural Gas Annual 2006" (PDF). US Department of Energy. October 2007. pp. 1, 70. Archived from the original (PDF) on 2009-01-14. Retrieved 2009-01-11.
- "Overview of Natural Gas in California". Energy Almanac. California Energy Commission. Archived from the original on 2009-04-30. Retrieved 2009-01-11.
- "Tesla, Greensmith, AES Deploy Aliso Canyon Battery Storage in Record Time". GTM. 31 January 2017. Retrieved 6 February 2017.
- "Archived copy". Archived from the original on 2013-09-01. Retrieved 2015-08-03.CS1 maint: archived copy as title (link)
- Ailworth, Erin; Lazo, Alejandro (2018-08-29). "California Lawmakers Vote to Mandate Carbon-Free Electricity Generation". Wall Street Journal. ISSN 0099-9660. Retrieved 2018-08-29.
- "California Lawmakers Set Goal for Carbon-Free Energy by 2045". Retrieved 2018-08-29.
- Energy Conservation Program: Energy Conservation Standards for General Service Incandescent Lamps 10 CFR Part 430, EERE-2019-BT-STD-0022, RIN 1904-AE76
- Mufson, Steven. "Energy Department to prolong the lives of incandescent lightbulbs". The Washington Post. Retrieved October 10, 2019.
- Eilperin, Juliet; Mufson, Steven (December 20, 2019). "The Trump administration just overturned a ban on old-fashioned lightbulbs". Washington Post. Retrieved January 2, 2020.
- "Judge allows California's shift to energy saving light bulbs". Associated Press. 2020-01-02. Retrieved 2020-01-02 – via KSBY.
External links
- Today's Outlook, California ISO
- Yesterday's Renewables Production, California ISO
- Energy Flow Chart (2000)
- Grid maps: South, Central, North