Coal power in the United States
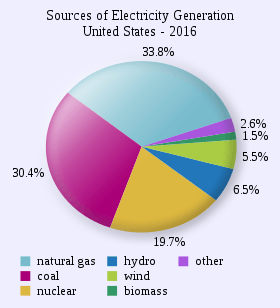
Coal power in the United States accounted for 39% of the country's electricity production at utility-scale facilities in 2014, 33% in 2015, 30.4% in 2016, 30.0% in 2017, 27.4% in 2018, and 23.5% in 2019.[2] Coal supplied 12.6 quadrillion Btu (3,700 TWh) of primary energy to electric power plants in 2017, which made up 91% of coal's contribution to US energy supply.[3] Utilities buy more than 90% of the coal consumed in the United States.[4]
Coal has been used to generate electricity in the United States since an Edison plant was built in New York City in 1882.[5] The first AC power station was opened by General Electric in Ehrenfeld, Pennsylvania in 1902, servicing the Webster Coal and Coke Company.[5] By the mid-20th century, coal had become the leading fuel for generating electricity in the US. The long, steady rise of coal-fired generation of electricity shifted to a decline after 2007. The decline has been linked to the increased availability of natural gas, decreased consumption,[6] renewable power, and more stringent environmental regulations. The Environmental Protection Agency has advanced restrictions on coal plants to counteract mercury pollution, smog, and global warming.
Trends, comparisons, and forecasts
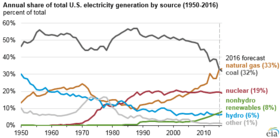
The average share of electricity generated from coal in the US has dropped from 52.8% in 1997 to 27.4% in 2018.[7] In 2017, there were 359 coal-powered units at the electrical utilities across the US, with a total nominal capacity of 256 GW[8] (compared to 1024 units at nominal 278 GW in 2000).[9] The actual average generated power from coal in 2006 was 227.1 GW (1991 TWh per year),[10] the highest in the world and still slightly ahead of China (1950 TWh per year) at that time.[11] In 2000, the US average production of electricity from coal was 224.3 GW (1966 TWh for the year).[10] In 2006, US electrical generation consumed 1,027 million short tons (932 million metric tons) or 92.3% of the coal mined in the US.[12]
.png)
Due to emergence of shale gas, coal consumption declined from 2009.[13][6] In the first quarter of 2012, the use of coal for electricity generation declined substantially more, 21% from 2011 levels. According to the U.S. Energy Information Administration, 27 gigawatts of capacity from coal-fired generators is to be retired from 175 coal-fired power plants between 2012 and 2016.[14] Natural gas showed a corresponding increase, increasing by a third over 2011.[15] Coal's share of electricity generation dropped to just over 36%.[15] Coal use continues to decline rapidly through November 2015 with its share around 33.6%.[1]
The coal plants are mostly base-load plants with typical utilisation rates of 50% to 60% (relating to full load hours).
As of July 7, 2011, utility companies will shut down and retire aging coal-fired power plants following the Environmental Protection Agency's (EPA) announcement of the Cross-State Air Pollution Rule (CSAP).[16] The extent of shutdowns and reduction in utilization will depend on factors such as future price of natural gas and cost of installation of pollution control equipment; however, as of 2013, the future of coal-fired power plants in the United States did not appear promising.[17][18] Recent estimates gauge that an additional 40 gigawatts (GW) of coal-fired capacity will retire by 2020 (in addition to the nearly 20GW that have retired as of 2014). This is driven most strongly by inexpensive natural gas competing with coal, and EPA's Mercury and Air Toxics Standards (MATS), which require significant reductions in emissions of mercury, acid gases, and toxic metals, scheduled to take effect in April 2015.[19] Over 13 GW of coal power plants built between 1950-70 were retired in 2015, averaging 133 MW per plant.[20] In Texas, the price drop of natural gas has reduced the capacity factor in 7 of the state's coal plants (max. output 8 GW), and they contribute about a quarter of the state's electricity.[21]
The cost of transporting coal may be around $20/ton for trains, or $5–6/ton for barge and truck.[22][23] A 2015 study by a consortium of environmental organizations concluded that US Government subsidies for coal production are around $8/ton for the Powder River Basin.[24]
In 2018, 16 of the 50 Federal States of the US had either no coal power in their power production for the public power supply (California, Idaho, Massachusetts, Rhode Island and Vermont), less than 5% coal in power production (Connecticut, Maine, New Hampshire, New Jersey, New York, Delaware) or between 5 and 10% (Alaska, Nevada, Mississippi, Oregon and Washington State) [25] [26]
Environmental impacts
In the United States, three coal-fired power plants reported the largest toxic air releases in 2001:[27]
- Duke Energy Roxboro Steam Electric Plant in Semora, North Carolina. The four-unit, 2,462 megawatt facility is one of the largest power plants in the United States.
- Reliant Energy's Keystone Power Plant in Shelocta, Pennsylvania.
- Georgia Power Bowen Steam Electric Generating Plant in Cartersville, Georgia.
The Environmental Protection Agency classified the 44 sites as potential hazards to communities, which means the waste sites could cause death and significant property damage if an event such as a storm or a structural failure caused a spill. They estimate that about 300 dry landfills and wet storage ponds are used around the country to store ash from coal-fired power plants. The storage facilities hold the noncombustible ingredients of coal and the ash trapped by equipment designed to reduce air pollution.[28]
Acid rain
Byproducts of coal plants have been linked to acid rain.
Sulfur dioxide emissions
86 coal powered plants have a capacity of 107.1 GW, or 9.9% of total U.S. electric capacity, they emitted 5,389,592 tons of SO2 in 2006 – which represents 28.6% of U.S. SO2 emissions from all sources.[29]
Carbon footprint: CO2 emissions
Emissions from electricity generation account for the largest share of U.S. greenhouse gases, 38.9% of U.S. production of carbon dioxide in 2006 (with transportation emissions close behind, at 31%). Although coal power only accounted for 49% of the U.S. electricity production in 2006, it was responsible for 83% of CO2 emissions caused by electricity generation that year, or 1,970 million metric ton of CO2 emissions. Further 130 million metric ton of CO2 were released by other industrial coal-burning applications.[30]
Click Here to see a graph displaying CO2 emissions from coal powered plants.
Mercury pollution
U.S. coal-fired electricity-generating power plants owned by utilities emitted an estimated 48 tons of mercury in 1999, the largest source of man-made mercury pollution in the U.S.[31] In 1995–96, this accounted for 32.6% of all mercury emitted into the air by human activity in the U.S. In addition, 13.1% was emitted by coal-fired industrial and mixed-use commercial boilers, and 0.3% by coal-fired residential boilers, bringing the total U.S. mercury pollution due to coal combustion to 46% of the U.S. man-made mercury sources.[32] In contrast, China's coal-fired power plants emitted an estimated 200 ± 90 tons of mercury in 1999, which was about 38% of Chinese human-generated mercury emissions (45% being emitted from non-ferrous metals smelting).[33] Mercury in emissions from power plants can be reduced by the use of activated carbon.
Public debate
Advocates
In 2007 an advertising campaign was launched to improve public opinion on coal power titled America's Power. This was done by the American Coalition for Clean Coal Electricity (then known as Americans for Balanced Energy Choices), a pro-coal organization started in 2000.
Opposition
In the face of increasing electricity demand through the 2000s, the US has seen a "Growing Trend Against Coal-Fired Power Plants". In 2005 the 790 MW Mohave Power Station closed rather than implement court ordered pollution controls. In 2006 through 2007 there was first a bullish market attitude towards coal with the expectation of a new wave of plants, but political barriers and pollution concerns escalated exponentially, which is likely to damage plans for new generation and put pressure on older plants.[34] In 2007, 59 proposed coal plants were cancelled, abandoned, or placed on hold by sponsors as a result of financing obstacles, regulatory decisions, judicial rulings, and new global warming legislation.[35][36]
The Stop Coal campaign has called for a moratorium on the construction of any new coal plants and for the phase out of all existing plants, citing concern for global warming.[37] Others have called for a carbon tax and a requirement of carbon sequestration for all coal power plants.[38]
The creation in January 2009 of a Presidential task force (to look at ways to alter the energy direction of the United States energy providers) favors the trend away from coal-fired power plants.
See also
References
- http://www.eia.gov/electricity/monthly Electric power monthly Feb. 2017
- "What is U.S. electricity generation by energy source? - FAQ - U.S. Energy Information Administration (EIA)".
- US Energy Information Administration, Table 2.13, Table 1.7, accessed 21 June 2018.
- "Archived copy". Archived from the original on 2008-09-11. Retrieved 2008-09-09.CS1 maint: archived copy as title (link)
- Speight, James G. (2012-09-04). The Chemistry and Technology of Coal, Third Edition. CRC Press. p. 13. ISBN 9781439836460.
- Trevor Houser, Jason Bordoff and Peter Marsters (April 25, 2017). "Can Coal Make a Comeback?". energypolicy.columbia.edu. Center on Global Energy Policy, School of International and Public Affairs, Columbia University. Retrieved 15 May 2017.
Increased competition from cheap natural gas is responsible for 49 percent of the decline in domestic U.S. coal consumption. Lower-than-expected demand is responsible for 26 percent, and the growth in renewable energy is responsible for 18 percent.
- "Electric Power Monthly - U.S. Energy Information Administration". www.eia.gov.
- "Existing Electric Generating Units in the United States". Energy Information Administration. 2009. Retrieved 2010-07-27.
- "Inventory of Electric Utility Power Plants in the United States 2000". Energy Information Administration. March 2002. Retrieved 2008-06-19.
- "Electric Power Annual with data for 2006". Energy Information Administration. October 2007. Retrieved 2008-06-19.
- See Wikipedia article on Chinese economy
- "U.S. Coal Consumption by End-Use Sector". Energy Information Administration. July 25, 2008. Retrieved 2008-08-29.
- Liam Denning. "Trump can’t make both coal and fracking great again" 2016-05-29. Quote: "The trend of gas taking market share from coal began in earnest in 2009 — which just happens to be when the cost of gas to produce electricity collapsed"
- Gerhardt, Tina (1 November 2012). "Record Number of Coal Power Plants Retire". E-Magazine. Archived from the original on 1 November 2012.
- Electric Power Monthly, March 2011 (released May 2012), U.S. Energy Information Administration
- "EPA finalizes rules for cross-state air pollution - The Hill's E2-Wire". Archived from the original on 2011-08-09. Retrieved 2011-08-06.
- Brad Plumer (April 8, 2013). "Study: The coal industry is in far more trouble than anyone realizes". The Washington Post. Retrieved April 8, 2013.
- Lincoln F. Pratson; Drew Haerer; Dalia Patiño-Echeverri (March 15, 2013). "Fuel Prices, Emission Standards, and Generation Costs for Coal vs Natural Gas Power Plants". Environmental Science & Technology. 47 (9): 4926–4933. doi:10.1021/es4001642. PMID 23496173.
- "AEO2014 projects more coal-fired power plant retirements by 2016 than have been scheduled". Today in Energy. U.S Energy Information Administration. Retrieved July 25, 2014.
- "Coal made up more than 80% of retired electricity generating capacity in 2015". EIA. Archived from the original on 20 August 2016. Retrieved 31 August 2016.
- "5 Charts That Show How Coal Is Getting Killed in Texas". 2016-10-17. Retrieved October 19, 2016.
- http://www.eia.gov/coal/transportationrates/pdf/table1.pdf
- "Rail Coal Transportation Rates".
- "Assessing Thermal Coal Production Subsidies".
- EIA, Utility Scale Facility Net Generation from Coal, , 20. Nov. 2018
- for Jan.-Oct. 2018 see EIA, Utility Scale Facility Net Generation , 20. Nov. 2018
- "Coal and Oil Power Plants Top North American Polluter List". www.ens-newswire.com.
- "Associated Press - June 2009".
- "Technology Transfer Network: State Emission Index". U.S. Environmental Protection Agency. Archived from the original on 2008-12-04. Retrieved May 2008. Check date values in:
|accessdate=(help) - "Inventory of U.S. greenhouse gas emissions and sinks: 1990–2006" (PDF). U.S. EPA. April 15, 2008. Retrieved 2008-08-29.
- "Mercury emissions control R&D". U.S. Dept. of Energy. 2006-01-18. Archived from the original on 2007-12-22. Retrieved 2008-01-27.
- "Mercury study: Report to Congress (EPA-452/R-97-004)" (PDF). 2. United States Environmental Protection Agency. December 1997. Retrieved 2008-07-31. Cite journal requires
|journal=(help) - Streets D. G.; Hao J.; Wu Y.; et al. (2005). "Anthropogenic mercury emissions in China". Atmos. Environ. 39 (40): 7789–7806. doi:10.1016/j.atmosenv.2005.08.029.
- "Palang Thai: The Growing Trend Against Coal-Fired Power Plants (USA)". Archived from the original on 2007-12-22. Retrieved 2007-12-19.
- "59 Coal Plants Cancelled, Abandoned, or Put on Hold in 2007," Lowbagger.org, 1/22/08
- "Victories 2007," CoalSwarm
- Want to stop global warming? STOP COAL!
- "Cap-&-Trade and Carbon Tax Legislation". Archived from the original on 2007-10-15. Retrieved 2007-11-13.