Solar power in Massachusetts
Solar power in Massachusetts has been increasing rapidly, due to Section 1603 grants for installations that began before December 31, 2011,[2] and the sale of SRECs for $0.30/kWh,[3] which allows payback for the system within 5 or 6 years, and generates income for the life of the system. For systems installed after December 31, 2011, and before December 31, 2016, the 30% tax grant becomes a 30% tax credit. There has been an appeal to the Congress to extend the 1603 program, the grant program, for an additional year.[4][5]

Net metering is available with no aggregate limit for systems less than 10 kW, or three phase connected systems less than 25 kW. Larger systems are limited to 3% of total peak load.[6] Approximately 40 municipalities are exempt from net metering. Of these, most choose not to offer it.
The first solar park in the country is the 100 kW array installed in 1981 at Beverly High School.[7] The largest campus to have a solar program is Harvard's 555 kW array.[8][9]
Massachusetts' largest privately owned solar array is the 7.1 MW Happy Hollow Community Solar and Storage Farm, completed in March 2019.[10] The town of Harvard, Massachusetts has the most solar installations with 75 planned, of which 21 have been installed.[11] Holyoke is home to two arrays which total 4.5 MW which were completed on December 20, 2011.[12] A 1.8 MW solar farm in Pittsfield was completed in 2010. A 5.75 MW solar park in Canton was completed in 2012.[13][14] Two 6 MW solar parks are being built, one in Berkley, and the other in Carver.[15] As of August 2012, a total of 129 MW has been installed in the state.[16]
State officials had set a target of installing 250 MW of solar PV statewide by 2017 and in May 2013 upped the target to 1,600 MW by 2020 as the 250 MW goal had been met four years ahead of schedule.[17] Exceeding projections again, cumulative solar PV capacity in the state reached over 2 GW (2,000 MW) at the end of 2017.[18] The American Solar Energy Industries Association forecasts that another ~1.5 GW of solar PV will be installed in the state over the next four years (2018-2021).[19]
The U.S. Energy Information Administration meanwhile reports that solar power, including both utility-scale and small-scale projects, accounted for 7.7% of the electricity generated in Massachusetts in 2017 - the 5th highest percentage nationwide among the 50 states.[20][21][22]
Charlie Baker administration (2015–Present)
In July 2015, the administration of Massachusetts Governor Charlie Baker announced that Baker would file legislation to raise net metering caps on solar energy, with officials stating that "The administration looks forward to filing legislation that builds upon the success and continued growth of Massachusetts' solar industry while ensuring a long-term, sustainable solar program that facilitates industry growth, minimizes ratepayer impact and achieves our goal of 1,600 megawatts by 2020".[23] The administration submitted the legislation the following month,[24] and on April 11, 2016, Baker signed the legislation into law.[25] The cap increase prompted a subsequent overhaul the following year of the state's solar incentive program that cut the cost of solar installations to ratepayers in half.[26]
In December 2015, Baker's administration launched a $30 million residential solar loan program to increase direct ownership of solar electricity by lowering fixed interest rates to homeowners purchasing solar panels, with Baker himself stating "Massachusetts is a national leader in solar energy, and this program provides another way for residents to access solar energy while diversifying the Commonwealth's energy portfolio and reducing our overall carbon footprint".[27] In January 2018, when President Trump imposed tariffs on solar panels manufactured outside the United States,[28] Baker's administration criticized the decision, stating that it was "disappointed" but "remains committed to supporting solar energy as an important component of the Commonwealth's diverse energy portfolio and source of clean energy jobs."[29] In February 2018, Baker's administration announced that solar capacity in Massachusetts had increased to 2,000 megawatts.[30]
Statistics
Potential generation
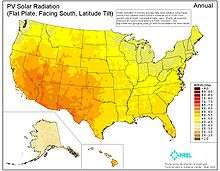
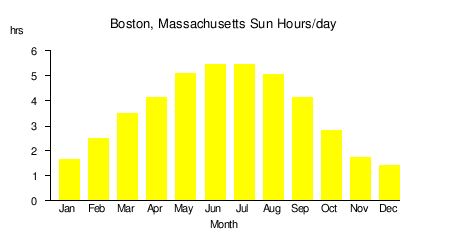
The average insolation in Massachusetts is about 4 sun hours per day, and ranges from less than 2 in the winter to over 5 in the summer.[31]
Massachusetts electricity consumption in 2015 was 54,621 million kWh (54.6 TWh). The state is a net importer of electricity, having only generated 32,086 million kWh (32.0 TWh) that year.[33] Massachusetts has the potential for generating 799,344 million kWh/year (799.3 TWh/y) from 184,076 MW (0.184 TW) of offshore wind farms and 82,205 million kWh (82.2 TWh) from 51,568 MW (0.052 TW) of photovoltaic solar farms, and 26,000 million kWh (26 TWh) (47% of consumption) from 22,500 MW (0.023 TW) of rooftop photovoltaics.[34][35]
Installed capacity
In 2016, the net metering limits were reached in all utility areas, causing over 240 MW in over 550 projects to be delayed.[36] On April 11, 2016, Massachusetts Governor Charlie Baker signed a bill increasing caps on net metering for private projects from 4% of the utility's load to 7%. Government project caps are 1% higher. The value of net metering credits paid was reduced, with remuneration for large projects set closer to the wholesale electricity price, while smaller projects stay closer to the retail price. Utilities will be able to charge a minimum fee to pay for maintaining the grid.[37]
| Massachusetts Grid-Connected PV Capacity (MW)[38][39][40][41][42][43] | ||||||||||||
|---|---|---|---|---|---|---|---|---|---|---|---|---|
| Year | Capacity | Change | % Change | |||||||||
| 2003 | 0.15 | 0.03 | 25% | |||||||||
| 2004 | 0.21 | 0.06 | 40% | |||||||||
| 2005 | 0.28 | 0.07 | 33% | |||||||||
| 2006 | 2.18 | 1.90 | 679% | |||||||||
| 2007 | 3.83 | 1.67 | 76% | |||||||||
| 2008 | 7.36 | 3.53 | 92% | |||||||||
| 2009 | 16.95 | 9.59 | 130% | |||||||||
| 2010 | 40.07 | 23.12 | 136% | |||||||||
| 2011 | 74.6 | 36.4 | 86% | |||||||||
| 2012 | 207.3 | 123.2 | 165% | |||||||||
| 2013 | 445.0 | 237.7 | 115% | |||||||||
| 2014 | 734 | 289 | 65% | |||||||||
| 2015 | 1,020 | 286 | 39% | |||||||||
| 2016 | 1,360 | 340 | 33% | |||||||||
| 2017 | 1,699 | 304 | 22% | |||||||||
| 2018 | 2,465 | 766 | 45% | |||||||||
| 2019 | 2,767.68 | 302.68 | ||||||||||
See also
References
- Solar house
- 1603 Treasury Program
- "Massachusetts Announces Change to SREC Program - Brightstar Solar". Brightstar Solar. 2011-01-31. Retrieved 2018-03-20.
- Cardwell, Diane (2012). "Clean Energy Projects Face Waning Subsidies". The New York Times. ISSN 0362-4331. Retrieved 2018-03-20.
- Overview and Status Update of the 1603 Program
- Massachusetts Net Metering Archived 2012-10-30 at the Wayback Machine
- Solar-panel grant keeps Beverly High going green Archived 2012-09-09 at Archive.today
- Harvard is Hot on Solar Panels, But Why Aren’t Other Boston Universities as Charged Up?
- "Sunviewer.net™ Harvard Science Center". www.sunviewer.net. Retrieved 2018-03-20.
- "Worcester Business Journal". March 11, 2019. Retrieved June 8, 2019.
- Solararize Harvard Archived 2016-03-03 at the Wayback Machine
- "Holyoke solar power project, among largest in New England, starts up". masslive.com. Retrieved 2018-03-20.
- Old Massachusetts Landfill Will be Home to New England's Largest Solar Array Archived 2012-05-21 at the Wayback Machine
- Lazar, Kay (2011-01-31). "Canton dump may soon be a solar powerhouse". Boston.com. Retrieved 2018-03-20.
- Nichols, Christopher. "Solar power soars to new heights in Berkley". The Taunton Daily Gazette, Taunton, MA. Retrieved 2018-03-20.
- Massachusetts Clean Energy Installations Archived 2012-08-31 at the Wayback Machine
- FOX 6 Springfield (2013-05-02). "Massachusetts Sets New Goal for Solar Power". WGGB-DT2. Retrieved 2013-05-02.
- Betsy Lillian (2018-02-18). "Massachusetts Reaches Significant Solar Milestone". Solar Industry Mag. Retrieved 2018-03-08.
- "Solar Spotlight - Massachusetts, 2017Q3" (PDF). Solar Energy Industries Association. 2018-01-09. Retrieved 2018-03-08.
- "Electric Power Monthly - Table 1.17.B. Net Generation from Solar Photovoltaic by State, by Sector, Year-to-Date through December 2017 and 2016". U.S. Energy Information Administration. 2018-02-27. Retrieved 2018-03-08.
- "Electric Power Monthly - Table 1.3.B. Utility Scale Facility Net Generation by State, by Sector, Year-to-Date through December 2017 and 2016". U.S. Energy Information Administration. 2018-02-27. Retrieved 2018-03-08.
- "Solar State By State". Solar Energy Industries Association. 2018. Retrieved 2018-03-08.
- Young, Colin A. (July 30, 2015). "Gov. Charlie Baker plans to propose solar energy legislation". MassLive.com. Advance Publications. Retrieved March 11, 2018.
- "Baker-Polito Administration Files Solar Legislation to Raise Net Metering Caps, Continue Industry Growth". www.mass.gov. August 7, 2018. Retrieved March 11, 2018.
- Schoenberg, Shira (April 11, 2016). "Massachusetts Gov. Charlie Baker signs solar net metering bill". MassLive.com. Advance Publications. Retrieved March 11, 2018.
- Schoenberg, Shira (January 31, 2017). "Massachusetts energy officials overhaul solar incentive program, cutting cost to ratepayers in half". MassLive.com. Advance Publications. Retrieved March 11, 2018.
- "Baker-Polito Administration Launches $30 Million Residential Solar Loan Program". www.mass.gov. December 17, 2015. Retrieved March 11, 2018.
- Gonzales, Richard (January 22, 2018). "Trump Slaps Tariffs On Imported Solar Panels And Washing Machines". WBUR. Retrieved March 11, 2018.
- "Solar Installers, Gov. Baker Criticize Trump's New Tariff". WBUR. January 23, 2018. Retrieved March 11, 2018.
- Serreze, Mary C. (February 8, 2018). "Baker: Massachusetts now has 2 gigawatts of solar capacity". MassLive.com. Advance Publications. Retrieved March 11, 2018.
- Solar Insolation Levels In North America
- Installed Solar Capacity in Massachusetts
- EIA (2017-01-17). "State Electricity Profiles". United States Department of Energy. Retrieved 2017-07-10.
- Renewable Energy Technical Potential Archived 2012-09-15 at the Wayback Machine
- Rooftop Solar Photovoltaic Technical Potential in the United States: A Detailed Assessment
- Stalled Solar Projects in Massachusetts
- Shallenberger (April 2016). "Massachusetts Gov. Baker signs bill lifting solar cap, lowering net metering rates". Utility Drive. Retrieved 2017-03-24.
- Sherwood, Larry (July 2014). "U.S. Solar Market Trends 2013" (PDF). Interstate Renewable Energy Council (IREC). Retrieved 2014-07-16.
- Sherwood, Larry (July 2013). "U.S. Solar Market Trends 2012" (PDF). Interstate Renewable Energy Council (IREC). p. 16. Retrieved 2013-10-11.
- Sherwood, Larry (June 2011). "U.S. Solar Market Trends 2010" (PDF). Interstate Renewable Energy Council (IREC). Retrieved 2011-06-29.
- Sherwood, Larry (July 2010). "U.S. Solar Market Trends 2009" (PDF). Interstate Renewable Energy Council (IREC). Archived from the original (PDF) on 2010-09-25. Retrieved 2010-07-28.
- Sherwood, Larry (July 2009). "U.S. Solar Market Trends 2008" (PDF). Interstate Renewable Energy Council (IREC). p. 16. Archived from the original (PDF) on 2009-11-23. Retrieved 2010-07-24.
- "Massachusetts Solar". Solar Energy Industries Association (IREC). Q4 2019. Retrieved 2020-05-05. Check date values in:
|date=(help)
External links
| Wikimedia Commons has media related to Solar power in Massachusetts. |
- Incentives and policies
- Renew Boston Solar Map
- Cambridge Solar Map by Mapdwell
- Boston Solar Map by Mapdwell
- 2012 Solar Installer Awards