Solar power in Vermont
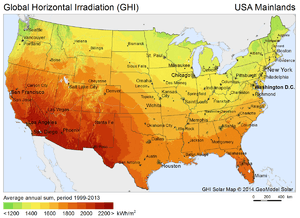
Solar power in Vermont provides almost 11% of the state's electricity as of 2018.[1] A 2009 study indicated that distributed solar on rooftops can provide 18% of all electricity used in Vermont.[2] A 2012 estimate suggests that a typical 5 kW system costing $25,000 before credits and utility savings will pay for itself in 10 years, and generate a profit of $34,956 over the rest of its 25-year life.[3]

Net metering is available for up to at least 500 kW generation, but is capped at 15% of utilities peak demand. Excess generation is rolled over each month but is lost once each year. Group net metering is also allowed.[4] Vermont is given an A for net metering and a C for interconnection.[5] A feed-in tariff was created in 2009, but is limited to 50 MW and is fully subscribed. The cap increases by 5 to 10 MW/year starting in 2013 until it reaches 127.5 MW in 2022. It is available for solar, wind, methane, and biomass.[6][7] Seven solar projects are receiving payments, of $0.30/kWh, for 25 years.[8]
Vermont has five solar arrays of at least 1 MW, the 2.2 MW SunGen Sharon 1 in Sharon completed in July 2012,[9] the 2.1 MW concentrating photovoltaics array installed in July 2011 in South Burlington,[10][11] the 1.5 MW photovoltaic array also in South Burlington installed in October 2011,[12] the 1 MW photovoltaic array in Ferrisburgh,[13] and the 2 MW Williamstown Solar Project.[14]
A proposed 20 MW solar farm in Ludlow is opposed by Green Mountain Power and the governor. The power company claims that there is no need for any utility-scale solar in the state.[15]
Installed capacity

|
| Grid-Connected PV Capacity (MW)[17][18][19][20][21][22][23][24][25][26] | ||||||||||||
|---|---|---|---|---|---|---|---|---|---|---|---|---|
| Year | Capacity | Change | % Change | |||||||||
| 2007 | 0.7 | 0.2 | 40% | |||||||||
| 2008 | 1.1 | 0.4 | 57% | |||||||||
| 2009 | 1.7 | 0.6 | 55% | |||||||||
| 2010 | 3.9 | 2.2 | 129% | |||||||||
| 2011 | 11.7 | 7.8 | 200% | |||||||||
| 2012 | 28.0 | 16.3 | 139% | |||||||||
| 2013 | 41.5 | 13.6 | 49% | |||||||||
| 2014 | 64 | 22.5 | 54% | |||||||||
| 2015 | 107 | 43 | 67% | |||||||||
| 2016 | 185 | 78 | ||||||||||
| 2017 | 220 | 35 | ||||||||||
| 2018 | 302 | 82 | ||||||||||
| 2019 | 355 | 53 | ||||||||||
Generation
Using data available from the U.S. Energy Information Agency's Electric Power Annual 2017[27] and "Electric Power Monthly Data Browser",[28][29][30][31] the following table summarizes Vermonts’s solar energy posture.
Capacity factor for each year was computed from the end-of-year summer capacity. 2017 data is from Electric Power Monthly and is subject to change.
| Year | Facilities | Summer capacity (MW) | Electric energy (GWh or M kWh) | Capacity factor | Yearly growth of generating capacity | Yearly growth of produced energy | % of VT renewable electric energy | % of VT generated electric energy | % of U.S. Solar electric energy |
|---|---|---|---|---|---|---|---|---|---|
| 2018 | 34 | 98.7 | 143 | 0.165 | 33% | 44.4% | 6.09% | 6.07% | 0.27% |
| 2017 | 31 | 74.2 | 99 | 0.152 | 13% | 67.8% | 4.64% | 4.62% | 0.19% |
| 2016 | 65.7 | 59 | 0.103 | 118% | 23% | 3.10% | 3.08% | 0.16% | |
| 2015 | 32.4 | 48 | 0.169 | 7% | 100% | 2.4% | 2.42% | 0.19% | |
| 2014 | 30.2 | 24 | .091 | 41% | 2.10% | 0.34% | 0.13% | ||
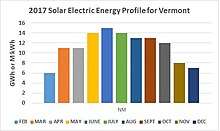
A small scale 15KW installation at a homestead in middle Vermont generated 19,480 kWh of electrical energy at a Capacity Factor of 0.15. The homestead was sending energy to the utility when it was produced and taking energy from the utility when needed. Overall, the homestead consumed 80% of its generation and sold the remaining 20% to the utility. The generation profile is shown in the chart.

Beginning with the 2014 data year, the Energy Information Administration (EIA) has estimated the distributed solar-photovoltaic generation and distributed solar-photovoltaic capacity.[32] These non-utility-scale appraisals evaluate that Vermont generated the following amounts of additional solar energy:
| Year | Summer capacity (MW) | Electric energy (GWh or M kWh) |
|---|---|---|
| 2018 | 102.3 | 130 |
| 2017 | 90.3 | 111 |
| 2016 | 59.8 | 76 |
| 2015 | 49.9 | 48 |
| 2014 | 27.9 | 33 |
Specific solar farm data follows:
| Year | January | February | March | April | May | June | July | August | September | October | November | December | Total |
|---|---|---|---|---|---|---|---|---|---|---|---|---|---|
| 2014 | 2,283 | 34,522 | 36,805 | ||||||||||
| 2015 | 42,153 | 18,082 | 233,572 | 267,032 | 372,320 | 354,479 | 380,525 | 351,880 | 326,723 | 210,548 | 138,288 | 59,410 | 2,755,012 |
| 2016 | 53,732 | 101,948 | 251,409 | 407,089 | |||||||||
| Total | 3,198,906 | ||||||||||||
| Year | January | February | March | April | May | June | July | August | September | October | November | December | Total |
|---|---|---|---|---|---|---|---|---|---|---|---|---|---|
| 2015 | 108,347 | 249,021 | 360,222 | 265,585 | 200,987 | 98,580 | 1,282,742 | ||||||
| 2016 | 77,601 | 122,304 | 281,687 | 481,592 | |||||||||
| Total | 1,764,334 | ||||||||||||
| Year | January | February | March | April | May | June | July | August | September | October | November | December | Total |
|---|---|---|---|---|---|---|---|---|---|---|---|---|---|
| 2014 | 57,759 | 57,759 | |||||||||||
| 2015 | 42,315 | 16,759 | 209,274 | 264,691 | 240,143 | 283,030 | 325,057 | 321,341 | 280,149 | 230,717 | 175,196 | 83,384 | 2,472,056 |
| 2016 | 123,410 | 148,742 | 253,174 | 525,326 | |||||||||
| Total | 3,055,141 | ||||||||||||
| Year | January | February | March | April | May | June | July | August | September | October | November | December | Total |
|---|---|---|---|---|---|---|---|---|---|---|---|---|---|
| 2014 | 130,850 | 103,416 | 234,266 | ||||||||||
| 2015 | 152,048 | 165,820 | 332,192 | 366,615 | 446,376 | 418,882 | 455,352 | 414,911 | 367,641 | 251,605 | 194,385 | 78,083 | 3,643,910 |
| 2016 | 147,394 | 170,433 | 309,100 | 626,927 | |||||||||
| Total | 4,505,103 | ||||||||||||
| Year | January | February | March | April | May | June | July | August | September | October | November | December | Total |
|---|---|---|---|---|---|---|---|---|---|---|---|---|---|
| 2014 | 301,303 | 335,058 | 306,499 | 178,405 | 122,241 | 83,373 | 1,326,879 | ||||||
| 2015 | 96,300 | 97,945 | 270,681 | 278,804 | 354,004 | 328,733 | 361,781 | 359,061 | 323,554 | 240,268 | 197,673 | 104,831 | 3,013,635 |
| 2016 | 149,878 | 143,090 | 266,066 | 559,034 | |||||||||
| Total | 4,899,548 | ||||||||||||
| Year | January | February | March | April | May | June | July | August | September | October | November | December | Total |
|---|---|---|---|---|---|---|---|---|---|---|---|---|---|
| 2014 | 330,116 | 202,364 | 89,553 | 60,542 | 682,575 | ||||||||
| 2015 | 72,032 | 4,848 | 178,931 | 317,191 | 387,374 | 359,905 | 392,978 | 366,215 | 350,035 | 248,943 | 155,426 | 71,027 | 2,904,905 |
| 2016 | 84,779 | 140,603 | 266,066 | 491,448 | |||||||||
| Total | 4,078,928 | ||||||||||||
| Year | January | February | March | April | May | June | July | August | September | October | November | December | Total |
|---|---|---|---|---|---|---|---|---|---|---|---|---|---|
| 2010 | 25,234 | 25,234 | |||||||||||
| 2011 | 33,369 | 56,396 | 134,873 | 115,728 | 126,312 | 141,528 | 168,590 | 136,755 | 127,040 | 89,381 | 75,377 | 64,207 | 1,269,556 |
| 2012 | 54,200 | 99,123 | 124,243 | 141,875 | 149,987 | 159,116 | 172,179 | 157,429 | 125,141 | 76,049 | 81,109 | 38,388 | 1,378,839 |
| 2013 | 49,832 | 71,062 | 103,822 | 142,788 | 155,750 | 133,042 | 151,457 | 151,357 | 138,927 | 94,205 | 81,126 | 25,208 | 1,298,576 |
| 2014 | 62,535 | 80,093 | 122,697 | 135,764 | 144,689 | 149,194 | 155,393 | 150,523 | 140,847 | 84,005 | 63,143 | 47,421 | 1,336,304 |
| 2015 | 67,304 | 57,224 | 129,006 | 138,137 | 164,962 | 147,367 | 164,337 | 160,370 | 142,472 | 110,303 | 80,006 | 40,178 | 1,401,666 |
| 2016 | 56,057 | 74,093 | 116,415 | 246,565 | |||||||||
| Total | 6,956,740 | ||||||||||||
| Year | January | February | March | April | May | June | July | August | September | October | November | December | Total |
|---|---|---|---|---|---|---|---|---|---|---|---|---|---|
| 2014 | 143,283 | 302,752 | 349,450 | 408,968 | 415,763 | 417,116 | 400,982 | 367,301 | 206,457 | 129,759 | 104,784 | 3,246,615 | |
| 2015 | 173,705 | 89,761 | 344,700 | 356,793 | 423,377 | 402,312 | 431,826 | 399,128 | 369,191 | 265,299 | 188,618 | 98,782 | 3,543,492 |
| 2016 | 157,178 | 142,184 | 314,958 | 614,320 | |||||||||
| Total | 7,404,427 | ||||||||||||
| Year | January | February | March | April | May | June | July | August | September | October | November | December | Total |
|---|---|---|---|---|---|---|---|---|---|---|---|---|---|
| 2013 | 163,563 | 106,354 | 46,225 | 316,142 | |||||||||
| 2014 | 96,439 | 177,357 | 252,833 | 282,338 | 247,703 | 327,458 | 307,030 | 297,535 | 289,377 | 170,249 | 110,910 | 74,394 | 2,633,623 |
| 2015 | 68,947 | 106,711 | 281,187 | 279,562 | 340,301 | 331,230 | 347,405 | 349,903 | 309,172 | 215,892 | 139,514 | 58,729 | 2,828,553 |
| 2016 | 86,921 | 111,006 | 266,421 | 464,348 | |||||||||
| Total | 6,242,666 | ||||||||||||
| Year | January | February | March | April | May | June | July | August | September | October | November | December | Total |
|---|---|---|---|---|---|---|---|---|---|---|---|---|---|
| 2011 | 244,684 | 446,839 | 355,547 | 298,142 | 200,576 | 163,960 | 121,541 | 1,831,289 | |||||
| 2012 | 88,165 | 223,306 | 311,089 | 327,782 | 376,112 | 427,720 | 470,300 | 398,723 | 342,073 | 177,785 | 171,268 | 73,913 | 3,388,236 |
| 2013 | 110,132 | 158,350 | 259,135 | 323,186 | 398,593 | 342,079 | 398,939 | 384,244 | 311,970 | 213,894 | 154,758 | 65,348 | 3,120,628 |
| 2014 | 148,701 | 212,791 | 282,233 | 314,116 | 379,219 | 422,849 | 400,390 | 360,539 | 325,255 | 173,608 | 120,763 | 87,096 | 3,227,560 |
| 2015 | 144,288 | 188,949 | 322,022 | 335,103 | 404,573 | 376,422 | 421,317 | 378,240 | 331,775 | 227,702 | 173,307 | 69,819 | 3,373,517 |
| 2016 | 136,367 | 155,539 | 292,557 | 584,463 | |||||||||
| Total | 15,525,693 | ||||||||||||
| Year | January | February | March | April | May | June | July | August | September | October | November | December | Total |
|---|---|---|---|---|---|---|---|---|---|---|---|---|---|
| 2012 | 84,161 | 84,161 | |||||||||||
| 2013 | 159,783 | 173,281 | 227,341 | 304,241 | 323,422 | 297,834 | 319,004 | 296,161 | 306,550 | 221,959 | 189,433 | 76,128 | 2,895,137 |
| 2014 | 157,092 | 152,204 | 265,162 | 248,732 | 294,583 | 290,899 | 338,331 | 315,905 | 311,017 | 170,226 | 122,108 | 78,523 | 2,744,782 |
| 2015 | 131,006 | 182,363 | 272,022 | 253,885 | 334,770 | 307,140 | 355,227 | 364,144 | 322,860 | 244,182 | 198,686 | 101,695 | 3,067,980 |
| 2016 | 166,388 | 195,836 | 298,828 | 661,052 | |||||||||
| Total | 9,453,112 | ||||||||||||
| Year | January | February | March | April | May | June | July | August | September | October | November | December | Total |
|---|---|---|---|---|---|---|---|---|---|---|---|---|---|
| 2013 | 76,225 | 43,347 | 119,572 | ||||||||||
| 2014 | 78,820 | 95,318 | 247,998 | 298,935 | 367,216 | 391,940 | 386,239 | 363,182 | 315,772 | 179,754 | 101,528 | 52,788 | 2,879,490 |
| 2015 | 48,378 | 15,652 | 295,229 | 314,182 | 384,267 | 373,847 | 391,216 | 386,599 | 339,096 | 223,144 | 119,906 | 45,598 | 2,937,114 |
| 2016 | 73,767 | 82,744 | 283,832 | 440,343 | |||||||||
| Total | 6,376,519 | ||||||||||||
| Year | January | February | March | April | May | June | July | August | September | October | November | December | Total |
|---|---|---|---|---|---|---|---|---|---|---|---|---|---|
| 2012 | 291,536 | 251,252 | 141,742 | 146,717 | 59,795 | 891,042 | |||||||
| 2013 | 81,010 | 103,008 | 208,807 | 257,346 | 288,636 | 281,957 | 304,840 | 309,871 | 354,830 | 173,428 | 157,957 | 44,817 | 2,566,507 |
| 2014 | 119,447 | 106,083 | 208,960 | 337,259 | 336,858 | 368,353 | 375,237 | 341,780 | 293,615 | 179,531 | 106,704 | 51,449 | 2,825,276 |
| 2015 | 95,989 | 54,009 | 260,840 | 296,375 | 360,884 | 349,691 | 382,944 | 364,598 | 293,377 | 224,871 | 184,715 | 88,653 | 2,956,946 |
| 2016 | 112,867 | 149,618 | 260,544 | 523,029 | |||||||||
| Total | 9,762,800 | ||||||||||||
| Year | January | February | March | April | May | June | July | August | September | October | November | December | Total |
|---|---|---|---|---|---|---|---|---|---|---|---|---|---|
| 2014 | 73,650 | 181,716 | 126,734 | 95,293 | 477,393 | ||||||||
| 2015 | 26,577 | 3,826 | 254,844 | 296,799 | 403,213 | 339,704 | 375,881 | 360,579 | 304,769 | 233,311 | 162,018 | 76,542 | 2,838,063 |
| 2016 | 145,346 | 174,998 | 303,787 | 624,131 | |||||||||
| Total | 3,939,587 | ||||||||||||
| Year | January | February | March | April | May | June | July | August | September | October | November | December | Total |
|---|---|---|---|---|---|---|---|---|---|---|---|---|---|
| 2014 | 17,657 | 131,350 | 90,146 | 239,153 | |||||||||
| 2015 | 84,114 | 65,460 | 371,751 | 409,124 | 446,622 | 459,223 | 506,489 | 473,532 | 419,565 | 299,021 | 211,618 | 89,414 | 3,835,933 |
| 2016 | 94,938 | 158,824 | 350,141 | 603,903 | |||||||||
| Total | 4,678,989 | ||||||||||||
| Year | January | February | March | April | May | June | July | August | September | October | November | December | Total |
|---|---|---|---|---|---|---|---|---|---|---|---|---|---|
| 2012 | 79,857 | 198,037 | 93,176 | 371,070 | |||||||||
| 2013 | 117,776 | 172,621 | 263,185 | 349,969 | 366,581 | 335,279 | 356,356 | 368,425 | 326,301 | 227,760 | 192,711 | 66,500 | 3,143,464 |
| 2014 | 171,235 | 175,112 | 281,547 | 344,922 | 342,107 | 377,409 | 373,716 | 363,257 | 319,198 | 205,203 | 144,504 | 99,129 | 3,197,339 |
| 2015 | 158,081 | 123,034 | 317,280 | 316,782 | 397,837 | 349,473 | 377,662 | 370,192 | 328,015 | 256,058 | 219,090 | 100,342 | 3,313,846 |
| 2016 | 169,381 | 208,070 | 296,739 | 674,190 | |||||||||
| Total | 10,699,909 | ||||||||||||
| Year | January | February | March | April | May | June | July | August | September | October | November | December | Total |
|---|---|---|---|---|---|---|---|---|---|---|---|---|---|
| 2012 | 43,159 | 43,159 | |||||||||||
| 2013 | 46,254 | 28,541 | 195,539 | 283,670 | 340,484 | 286,397 | 331,462 | 350,358 | 310,678 | 216,175 | 127,224 | 44,522 | 2,561,304 |
| 2014 | 80,023 | 49,408 | 168,005 | 290,858 | 236,033 | 289,530 | 307,128 | 315,700 | 292,625 | 181,512 | 88,252 | 43,952 | 2,343,026 |
| 2015 | 21,296 | 1,791 | 217,432 | 271,501 | 358,738 | 296,162 | 368,317 | 346,472 | 322,967 | 240,280 | 162,739 | 87,279 | 2,694,974 |
| 2016 | 67,449 | 114,092 | 258,083 | 439,624 | |||||||||
| Total | 8,082,087 | ||||||||||||
See also
References
- "Solar Spotlight - Vermont" (PDF). www.seia.org. June 2019. Retrieved August 11, 2019.
- Witkin, Jim (2009-10-30). "Report Argues for a Decentralized System of Renewable Power Generation". Green Blog.
- "Guide to Vermont Home Solar Incentives, Rebates, and Tax Credits". Solar Power Rocks.
- Vermont Net Metering Archived 2012-05-10 at the Wayback Machine
- Freeing the grid Archived 2012-06-16 at the Wayback Machine
- Standard Offer Program Archived 2012-07-27 at the Wayback Machine
- Standard Offer for Qualifying SPEED Resources Archived 2012-05-27 at the Wayback Machine
- Monthly Production Archived 2012-07-27 at the Wayback Machine
- "Talmage Solar Engineering, Inc. Unveils Largest Smart Array in North America". Business Wire. 2012-07-31.
- Griset, Todd (2011-07-28). "Vermont's largest solar array compared to California's". Energy Policy Update.
- "Site #316 Production Report | AllEarth Renewables Energy Production Report". www.allearthrenewables.com.
- Military Invests in Solar at Vermont National Guard Base Archived 2012-07-26 at the Wayback Machine
- Ferrisburgh Solar Farm
- "Williamstown solar array to be among state's biggest". Rutland Herald. 2012-07-31. Archived from the original on 2013-04-11.
- Polhamus, Mike (2015-12-06). "20-megawatt solar project needed, developers' report says". VTDigger.
- "PV Watts". NREL. Retrieved 23 July 2012.
- Sherwood, Larry (August 2012). "U.S. Solar Market Trends 2011" (PDF). Interstate Renewable Energy Council (IREC). Archived from the original (PDF) on 2012-09-06. Retrieved 2012-08-16.
- Sherwood, Larry (June 2011). "U.S. Solar Market Trends 2010" (PDF). Interstate Renewable Energy Council (IREC). Retrieved 2011-06-29.
- Sherwood, Larry (July 2010). "U.S. Solar Market Trends 2009" (PDF). Interstate Renewable Energy Council (IREC). Archived from the original (PDF) on 2010-09-25. Retrieved 2010-07-28.
- Sherwood, Larry (July 2009). "U.S. Solar Market Trends 2008" (PDF). Interstate Renewable Energy Council (IREC). Archived from the original (PDF) on 2009-11-23. Retrieved 2010-07-24.
- Sherwood, Larry (August 2008). "U.S. Solar Market Trends 2007" (PDF). Interstate Renewable Energy Council (IREC). Retrieved 2010-07-24.
- US Solar Market Insight Report Archived 2012-04-18 at the Wayback Machine
- Sherwood, Larry (July 2009). "U.S. Solar Market Trends 2008" (PDF). Interstate Renewable Energy Council (IREC). p. 16. Archived from the original (PDF) on 2009-11-23. Retrieved 2010-07-24.
- Sherwood, Larry (July 2012). "U.S. Solar Market Trends 2012" (PDF). Interstate Renewable Energy Council (IREC). p. 16. Retrieved 2013-10-11.
- Sherwood, Larry (July 2014). "U.S. Solar Market Trends 2013" (PDF). Interstate Renewable Energy Council (IREC). Retrieved 2014-09-26.
- Vermont Solar
- "Electric Power Annual State Data" 1990-2017 Existing Name Plate and Summer Capacity by Energy Source and State retrieved 2019-3-17
- "Electric Power Monthly Data Browser" Table 1.17B retrieved 2019-3-15
- "Electric Power Monthly Data Browser " Report 1.14 retrieved 2017-6-17
- "Electric Power Monthly Data Browser " Report 1.13 retrieved 2019-3-17
- "Electric Power Monthly Data Browser " Report 1.6 retrieved 2019-3-17
- "Electric Power Annual" retrieved 2017 6 17
- "Electric Power Monthly" |title=Electric Power Monthly (February 2018 with data for December 2017) - Table 1.17.B. Net Generation from Solar Photovoltaic retrieved 2018 5 29
- "Electric Power Monthly" |title=Electric Power Monthly (February 2018 with data for December 2017) - Table 6.2.B. Net Capacity from Solar Photovoltaic retrieved 2018 7 27
- Ferrisburgh Solar Farm Archived 2016-06-03 at the Wayback Machine
- "Vermont's largest solar array installed in Essex Jct | Vermont Business Magazine". www.vermontbiz.com. 2015-01-25.
External links
| Wikimedia Commons has media related to Solar power in Vermont. |