Wind power in California
Wind power in California had initiative and early development during Governor Jerry Brown's first two terms in the late 1970s and early 1980s.[1][2] The state's wind power capacity has grown by nearly 350% since 2001, when it was less than 1,700 MW.[3][4] In 2016, wind energy (including that supplied by other states) supplied about 6.9% of California's total electricity needs, or enough to power more than 1.3 million households.[5] Most of California's wind generation is found in the Tehachapi area of Kern County, California, with some large projects in Solano, Contra Costa and Riverside counties as well. California is among the states with the largest amount of installed wind power capacity.[3] In recent years, California has lagged behind other states when it comes to the installation of wind power. It was ranked 4th overall for wind power electrical generation at the end of 2016 behind Texas, Iowa, and Oklahoma.[6][7] As of 2019, California had 5,973 megawatts (MW) of wind power generating capacity installed.[8]

History
California was the first U.S. state where large wind farms were developed, beginning in the early 1980s.[9] By 1995, California produced 30 percent of the entire world's wind-generated electricity.[10] Wind power in Texas surpassed the production in California to become the leader in the United States.
Historically, most of California's wind power output has been in three primary regions: Altamont Pass wind farm (east of San Francisco); Tehachapi Pass wind farm (south east of Bakersfield) and San Gorgonio Pass wind farm (near Palm Springs, east of Los Angeles).[10] A fourth area, the Montezuma Hills of Solano County, was developed in 2005–2009, with the large Shiloh wind power plant.
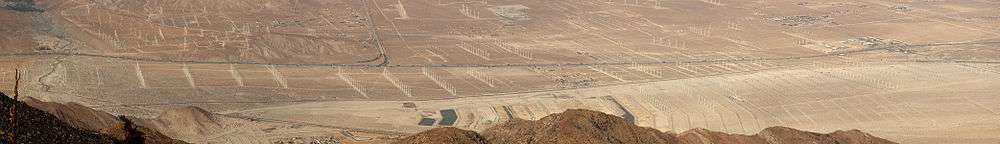
The Alta Wind Energy Center is a wind farm located in Tehachapi Pass in Kern County.[11] Kern County is reviewing a number of other proposed wind projects that would generate a combined 4,600 megawatts of renewable energy if approved.[12]
|
 Ocotillo wind energy project California wind farms
|
Growth
 |
| Gigawatt-hours generated per year, 2001-2018[4][18][19] |
California had a total of 5,662 megawatts of installed wind generation capacity at the end of 2015,[20] increasing to 5,973 at the end of 2019. Wind energy supplied about 6.9% of California's total electricity needs in 2017 (including power supplied from other states in this case),[5] and 7.35% in 2019.
In 2011, 921.3 megawatts of new production was installed. Most of that activity occurred in the Tehachapi area of Kern County, with some big projects in Solano, Contra Costa and Riverside counties as well.[21][22][23] After leading the country for many years, California now ranks fourth nationwide in terms of capacity, behind Texas, Iowa, and Oklahoma.[20] Due to higher average winds in the plains area of the U.S., California ranks fifth in wind generation.[24]
In January 2018, the Tule Wind Project came online. Located in eastern San Diego County, the facility has 57 wind turbines which collectively generate 131.1 megawatts of electricity. There are plans to expand this project by an additional 24 turbines in the future.[17] In its current configuration, the installation is able to power an estimated 40,000 homes.[25] CAISO tested the wind farm's synchronverter in 2018, and found it could perform some of the grid services similar or better than traditional generators.[26][27]
In February 2018, Scout Clean Energy of Colorado won the rights to modernize the Gonzaga Ridge wind farm which is located in Pacheco State Park. Rated at 16.5 megawatts, the Gonzaga Ridge facility currently uses 1980s era wind turbines which are smaller, less cost-effective, and overall far less efficient at generating energy than those which currently being produced. The electrical output of Gonzaga Ridge after modernization is projected to be between 65 MW and 80 MW.[28]
In 2016, California used about 285,700 GWh[29] and generated 13,500 GWh of wind energy in state.[30]
Offshore wind potential
A 2009 Stanford University study of California offshore wind potential identified a site off Cape Mendocino that could provide uninterrupted year-round power from a 1500 MW wind farm that would produce an average of 790 MW. Three types of offshore wind power were studied, with the conclusion that from 12,300 to 19,700 GWh/yr could be delivered from 1,997 to 3,331 MW of monopile wind turbines installed in up to 20 meter deep water, from 38,200 to 73,000 GWh/yr could be delivered from 6,202 to 12,374 MW of multi-leg wind turbines in 20 to 50 meter deep water, and from 462,100 to 568,200 GWh/yr from 73,025 to 91,707 MW of floating turbine foundation wind turbines in from 50 to 200 meter deep water,[31] such as those being studied for use off the coast of Maine by the Ocean Energy Institute and the DeepCwind Consortium.[32]
In April 2018, several power development companies joined with Redwood Coast Energy Authority to explore the idea of creating a large-scale wind farm off of the Northern California coast. One problem that has hindered any prior development in the area off the coast of Humboldt County is the deep water, making the traditionally fixed turbines very difficult proposition. The group decided to propose the use floating turbines instead. RCEA and the development companies intend to file a lease with the Bureau of Ocean Energy Management in the summer of 2018 for the 120-150 MW project.[33] The Humboldt Project will be located just over 20 miles west of Eureka, California and estimates have the date of completion to be sometime in 2024.[34]
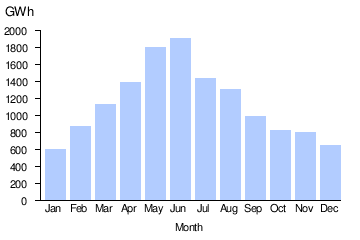
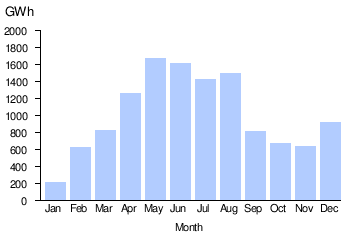
Wind generation

| California wind generation (GWh) | |||||||||||||
|---|---|---|---|---|---|---|---|---|---|---|---|---|---|
| Year | Total | Jan | Feb | Mar | Apr | May | Jun | Jul | Aug | Sep | Oct | Nov | Dec |
| 2015 | 12,228 | 187 | 619 | 826 | 1,262 | 1,681 | 1,668 | 1,445 | 1,523 | 815 | 667 | 617 | 917 |
| 2016 | 13,698 | 721 | 577 | 1,333 | 1,337 | 1,602 | 1,651 | 1,700 | 1,450 | 1,000 | 963 | 564 | 799 |
| 2017 | 13,090 | 740 | 940 | 1,194 | 1,621 | 1,614 | 1,397 | 1,618 | 1,199 | 840 | 498 | 358 | 1074 |
| 2018 | 13,650 | 1,139 | 1,122 | 1,427 | 1,505 | 1,531 | 1,511 | 1,002 | 669 | 773 | 1,003 | 981 | 987 |
| 2019 | 14,970 | ||||||||||||
|
|
|
See also
References
- "U.S. wind energy grows in California, then stagnates nationwide in the 1980s". American Wind Energy Association. Retrieved April 9, 2018.
- Hochschild, David (March 21, 2017). "Don't let wind energy stall". Sacramento Bee. Retrieved April 8, 2018.
- "WINDExchange: Installed Wind Capacity". energy.gov. U.S. Department of Energy. February 17, 2016. Retrieved January 24, 2017.
- "AWEA 4th quarter 2012 Public Market Report" (PDF). American Wind Energy Association (AWEA). January 2013. Retrieved January 30, 2013.
- "California Wind Energy" (PDF). U.S. Wind Energy State Facts. American Wind Energy Association. Retrieved December 27, 2017.
- "Wind Energy Facilities Installed Capacity Ranked by State/Territory". Official Nebraska Government Website. 2016. Retrieved April 9, 2018.
- Osborn-Mills, Danielle (May 22, 2017). "California is falling behind in producing wind power". Sacramento Bee. Retrieved April 9, 2018.
- "Wind Energy in California" (pdf). WINDExchange. Retrieved May 6, 2020.
- "Wind Energy in California" (PDF). American Wind Energy Association. Retrieved May 1, 2018.
- "Overview of Wind Energy in California". California Energy Commission. Archived from the original on January 18, 2017.
- "World's Largest Wind Project is Underway". RenewableEnergyWorld.com. July 29, 2010. Retrieved April 14, 2018.
- "California's largest wind power projects has been approved by Kern County". REVE. December 17, 2009. Retrieved April 14, 2018.
- "U.S. Wind Energy Projects – California". American Wind Energy Association. July 2010. Retrieved July 28, 2010.
- "Alta Wind Energy Center is the nation's largest wind facility". CA.gov. Retrieved April 10, 2018.
- "Ocotillo Express Wind Energy Project". U.S. Department of the Interior Bureau of Land Management. September 10, 2012. Retrieved January 6, 2013.
- "Shiloh I Wind". EDF Renewable Energy. Retrieved April 10, 2018.
- Nikolewski, Rob (January 25, 2018). "Tule Wind Farm now producing electricity". San Diego Union Tribune. Retrieved February 7, 2018.
- "Energy Information Administration, Electricity Data Browser". U.S. Energy Information Administration. Retrieved April 3, 2019.
- "Wind Energy in California" (pdf). WINDExchange. Retrieved May 6, 2020.
- "AWEA Fourth Quarter 2016 Market Report Public Version" (pdf). American Wind Energy Association. Retrieved March 9, 2017.
- "Five Percent of California's Energy Supply Now Comes From Wind" (pdf). California Wind Energy Assn. Retrieved February 2, 2012.
- Dickerson, Marla (January 31, 2012). "Wind power blowing up in California". Los Angeles Times. Retrieved April 14, 2018.
- 2012 Third Quarter Market Report, American Wind Energy Association
- "EIA - Electricity Data". www.eia.gov. Retrieved May 1, 2018.
- Gibbins, John (2018). "East county wind farm going strong". San Diego Union Tribune. Retrieved February 7, 2018.
- Balaraman, Kavya (March 13, 2020). "Wind plants can provide grid services similar to gas, hydro, easing renewables integration: CAISO". Utility Dive.
- Tuel Wind Power Plant Test Results CAISO, 2019
- Froese, Michelle (February 5, 2018). "Quinbrook to repower California wind farm". Windpower Engineering and Development.
- "Electricity Consumption by County". California Energy Commission.
- "Total System Electric Generation". California Energy Commission.
- California offshore wind energy potential
- "Ocean Energy Institute". 2008. Retrieved December 15, 2008.
- Editorial, Reuters. "Group pursuing floating wind farm off California coast". U.S. Retrieved April 4, 2018.
- "California Chooses Floating Offshore Wind Technology". The Marine Executive. Retrieved April 6, 2018.
- EIA (July 27, 2012). "Electric Power Monthly Table 1.17.A." United States Department of Energy. Retrieved August 15, 2012.
- EIA (July 27, 2012). "Electric Power Monthly Table 1.17.B." United States Department of Energy. Retrieved February 28, 2013.
- EIA (December 20, 2013). "Electric Power Monthly Table 1.17.A." United States Department of Energy. Retrieved January 18, 2014.
External links
| Wikimedia Commons has media related to Wind power in California. |