Divided government in the United States
In the United States, divided government describes a situation in which one party controls the executive branch while another party controls one or both houses of the legislative branch.
Divided government is seen by different groups as a benefit or as an undesirable product of the model of governance used in the U.S. political system. Under said model, known as the separation of powers, the state is divided into different branches. Each branch has separate and independent powers and areas of responsibility so that the powers of one branch are not in conflict with the powers associated with the others. However, the degree to which the president of the United States has control of Congress often determines his political strength - such as the ability to pass sponsored legislation, ratify treaties, and have Cabinet members and judges approved.
The model can be contrasted with the fusion of powers in a parliamentary system where the executive and legislature (and sometimes parts of the judiciary) are unified. Those in favor of divided government believe that such separations encourage more policing of those in power by the opposition, as well as limiting spending and the expansion of undesirable laws.[1] Opponents, however, argue that divided governments become lethargic, leading to many gridlocks. In the late 1980s, Terry M. Moe, a professor of political science at Stanford University, examined the issue.[2] He concluded that divided governments lead to compromise which can be seen as beneficial, but he also noticed that divided governments subvert performance and politicize the decisions of executive agencies.
Early in the 20th century, divided government was rare, but since the 1970s it has become increasingly common.
Party control of legislative and executive branches since 1861
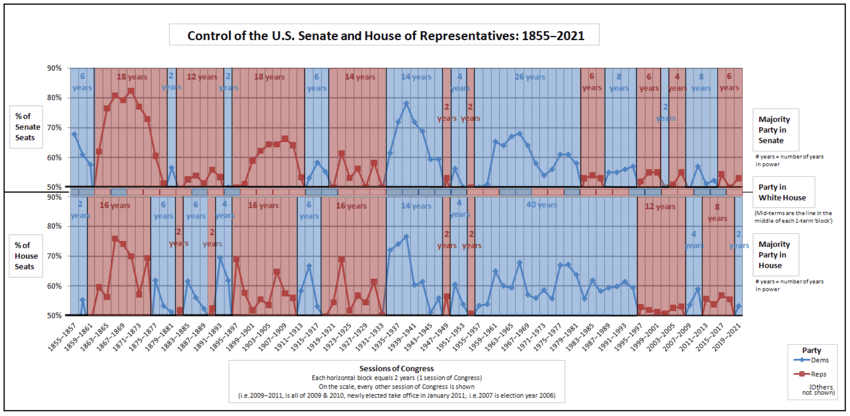
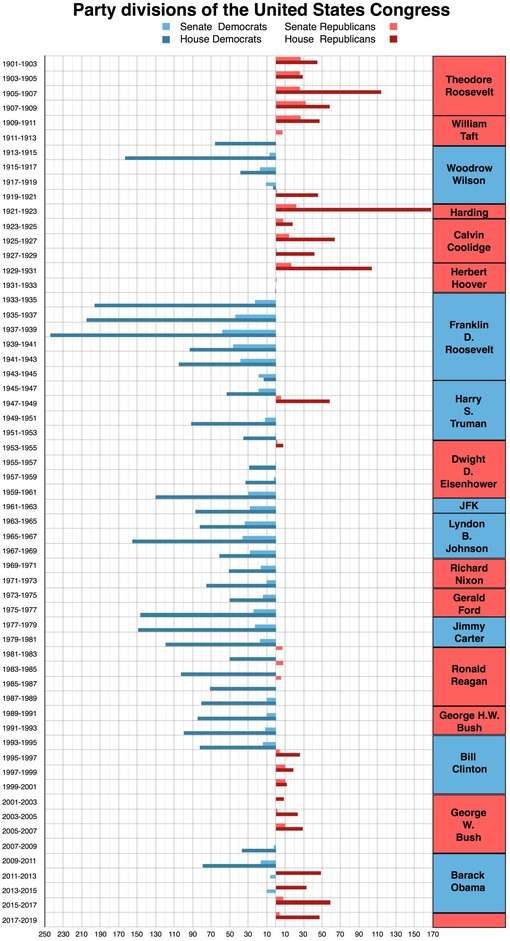
D denotes the Democratic Party and R denotes the Republican Party
| Year | President | Senate | House |
|---|---|---|---|
| 1861–1863 | R | R | R |
| 1863–1865 | R | R | R |
| 1865-1867 | D | R | R |
| 1867-1869 | D | R | R |
| 1869–1871 | R | R | R |
| 1871–1873 | R | R | R |
| 1873–1875 | R | R | R |
| 1875-1877 | R | R | D |
| 1877-1879 | R | R | D |
| 1879-1881 | R | D | D |
| 1881–1883 | R | R | R |
| 1883-1885 | R | R | D |
| 1885-1887 | D | R | D |
| 1887-1889 | D | R | D |
| 1889–1891 | R | R | R |
| 1891-1893 | R | R | D |
| 1893–1895 | D | D | D |
| 1895-1897 | D | R | R |
| 1897–1899 | R | R | R |
| 1899–1901 | R | R | R |
| 1901–1903 | R | R | R |
| 1903–1905 | R | R | R |
| 1905–1907 | R | R | R |
| 1907–1909 | R | R | R |
| 1909–1911 | R | R | R |
| 1911-1913 | R | R | D |
| 1913–1915 | D | D | D |
| 1915–1917 | D | D | D |
| 1917–1919 | D | D | D |
| 1919-1921 | D | R | R |
| 1921–1923 | R | R | R |
| 1923–1925 | R | R | R |
| 1925–1927 | R | R | R |
| 1927–1929 | R | R | R |
| 1929–1931 | R | R | R |
| 1931-1933 | R | R | D |
| 1933–1935 | D | D | D |
| 1935–1937 | D | D | D |
| 1937–1939 | D | D | D |
| 1939–1941 | D | D | D |
| 1941–1943 | D | D | D |
| 1943–1945 | D | D | D |
| 1945–1947 | D | D | D |
| 1947-1949 | D | R | R |
| 1949–1951 | D | D | D |
| 1951–1953 | D | D | D |
| 1953–1955 | R | R | R |
| 1955-1957 | R | D | D |
| 1957-1959 | R | D | D |
| 1959-1961 | R | D | D |
| 1961–1963 | D | D | D |
| 1963–1965 | D | D | D |
| 1965–1967 | D | D | D |
| 1967–1969 | D | D | D |
| 1969-1971 | R | D | D |
| 1971-1973 | R | D | D |
| 1973-1975 | R | D | D |
| 1975-1977 | R | D | D |
| 1977–1979 | D | D | D |
| 1979–1981 | D | D | D |
| 1981-1983 | R | R | D |
| 1983-1985 | R | R | D |
| 1985-1987 | R | R | D |
| 1987-1989 | R | D | D |
| 1989-1991 | R | D | D |
| 1991-1993 | R | D | D |
| 1993–1995 | D | D | D |
| 1995-1997 | D | R | R |
| 1997-1999 | D | R | R |
| 1999-2001 | D | R | R |
| 2001-2003 | R | D* | R |
| 2003–2005 | R | R | R |
| 2005–2007 | R | R | R |
| 2007-2009 | R | D | D |
| 2009–2011 | D | D | D |
| 2011-2013 | D | D | R |
| 2013-2015 | D | D | R |
| 2015-2017 | D | R | R |
| 2017-2019 | R | R | R |
| 2019-2021 | R | R | D |
*The 2000 election resulted in a 50–50 tie in the Senate, and the Constitution gives tie-breaking power to the vice president. The vice president was Democrat Al Gore from January 3, 2001 until the inauguration of Republican Richard Cheney on January 20. Then on May 24, Republican Senator Jim Jeffords of Vermont left the Republican Party to caucus with the Democrats as an independent, resulting in another shift of control.
Presidential impact
Many presidents' elections produced what is known as a coattail effect, in which the success of a presidential candidate also leads to electoral success for other members of his or her party. In fact, all newly elected presidents except Zachary Taylor, Richard Nixon, and George H. W. Bush were accompanied by control of at least one house of Congress.
Presidents by congressional control and terms won/served
| No. | President | President's Party | Senate with | Senate opposed | House with | House opposed | Congress with | Congress opposed | Congress divided | Years served | Elections won | |
|---|---|---|---|---|---|---|---|---|---|---|---|---|
| 1 | George Washington | None | 8 | 0 | 4 | 4 | 4 | 0 | 4 | 8 | 2 | |
| 2 | John Adams | Federalist | 4 | 0 | 4 | 0 | 4 | 0 | 0 | 4 | 1 | |
| 3 | Thomas Jefferson | Democratic-Republican | 8 | 0 | 8 | 0 | 8 | 0 | 0 | 8 | 2 | |
| 4 | James Madison | Democratic-Republican | 8 | 0 | 8 | 0 | 8 | 0 | 0 | 8 | 2 | |
| 5 | James Monroe | Democratic-Republican | 8 | 0 | 8 | 0 | 8 | 0 | 0 | 8 | 2 | |
| 6 | John Quincy Adams | Democratic-Republican | 0 | 4 | 2 | 2 | 0 | 2 | 2 | 4 | 1 | |
| 7 | Andrew Jackson | Democratic | 6 | 2 | 8 | 0 | 6 | 0 | 2 | 8 | 2 | |
| 8 | Martin Van Buren | Democratic | 4 | 0 | 4 | 0 | 4 | 0 | 0 | 4 | 1 | |
| 9 | William Harrison | Whig | 0.1 | 0 | 0.1 | 0 | 0.1 | 0 | 0 | 0.1 | 1 | |
| 10 | John Tyler | Whig | Independent | 3.9 | 0 | 1.9 | 2 | 1.9 | 0 | 2 | 3.9 | 0 |
| 11 | James Polk | Democratic | 4 | 0 | 2 | 2 | 2 | 0 | 2 | 4 | 1 | |
| 12 | Zachary Taylor | Whig | 0 | 1 | 0 | 1 | 0 | 1 | 0 | 1 | 1 | |
| 13 | Millard Fillmore | Whig | 0 | 3 | 0 | 3 | 0 | 3 | 0 | 3 | 0 | |
| 14 | Franklin Pierce | Democratic | 4 | 0 | 2 | 2 | 2 | 0 | 2 | 4 | 1 | |
| 15 | James Buchanan | Democratic | 4 | 0 | 2 | 2 | 2 | 0 | 2 | 4 | 1 | |
| 16 | Abraham Lincoln | Republican | National Union | 4 | 0 | 4 | 0 | 4 | 0 | 0 | 4 | 2 |
| 17 | Andrew Johnson | National Union | 0 | 4 | 0 | 4 | 0 | 4 | 0 | 4 | 0 | |
| 18 | Ulysses Grant | Republican | 8 | 0 | 6 | 2 | 6 | 0 | 2 | 8 | 2 | |
| 19 | Rutherford Hayes | Republican | 2 | 2 | 0 | 4 | 0 | 2 | 2 | 4 | 1 | |
| 20 | James Garfield | Republican | 0 | 0.5 | 0.5 | 0 | 0 | 0 | 0.5 | 0.5 | 1 | |
| 21 | Chester Arthur | Republican | 3.5 | 0 | 1.5 | 2 | 1.5 | 0 | 2 | 3.5 | 0 | |
| 22 | Grover Cleveland | Democratic | 0 | 4 | 4 | 0 | 0 | 0 | 4 | 4 | 1 | |
| 23 | Benjamin Harrison | Republican | 4 | 0 | 2 | 2 | 2 | 0 | 2 | 4 | 1 | |
| 24 | Grover Cleveland | Democratic | 2 | 2 | 2 | 2 | 2 | 2 | 0 | 4 | 1 | |
| 25 | William McKinley | Republican | 4.5 | 0 | 4.5 | 0 | 4.5 | 0 | 0 | 4.5 | 2 | |
| 26 | Theodore Roosevelt | Republican | 7.5 | 0 | 7.5 | 0 | 7.5 | 0 | 0 | 7.5 | 1 | |
| 27 | William Taft | Republican | 4 | 0 | 2 | 2 | 2 | 0 | 2 | 4 | 1 | |
| 28 | Woodrow Wilson | Democratic | 6 | 2 | 6 | 2 | 6 | 2 | 0 | 8 | 2 | |
| 29 | Warren Harding | Republican | 2.4 | 0 | 2.4 | 0 | 2.4 | 0 | 0 | 2.4 | 1 | |
| 30 | Calvin Coolidge | Republican | 5.6 | 0 | 5.6 | 0 | 5.6 | 0 | 0 | 5.6 | 1 | |
| 31 | Herbert Hoover | Republican | 4 | 0 | 2 | 2 | 2 | 0 | 2 | 4 | 1 | |
| 32 | Franklin Roosevelt | Democratic | 12.2 | 0 | 12.2 | 0 | 12.2 | 0 | 0 | 12.2 | 4 | |
| 33 | Harry Truman | Democratic | 5.8 | 2 | 5.8 | 2 | 5.8 | 2 | 0 | 7.8 | 1 | |
| 34 | Dwight Eisenhower | Republican | 2 | 6 | 2 | 6 | 2 | 6 | 0 | 8 | 2 | |
| 35 | John Kennedy | Democratic | 2.8 | 0 | 2.8 | 0 | 2.8 | 0 | 0 | 2.8 | 1 | |
| 36 | Lyndon Johnson | Democratic | 5.2 | 0 | 5.2 | 0 | 5.2 | 0 | 0 | 5.2 | 1 | |
| 37 | Richard Nixon | Republican | 0 | 5.6 | 0 | 5.6 | 0 | 5.6 | 0 | 5.6 | 2 | |
| 38 | Gerald Ford | Republican | 0 | 2.4 | 0 | 2.4 | 0 | 2.4 | 0 | 2.4 | 0 | |
| 39 | Jimmy Carter | Democratic | 4 | 0 | 4 | 0 | 4 | 0 | 0 | 4 | 1 | |
| 40 | Ronald Reagan | Republican | 6 | 2 | 0 | 8 | 0 | 2 | 6 | 8 | 2 | |
| 41 | George H. W. Bush | Republican | 0 | 4 | 0 | 4 | 0 | 4 | 0 | 4 | 1 | |
| 42 | Bill Clinton | Democratic | 2[6] | 6 | 2 | 6 | 2 | 6 | 0 | 8 | 2 | |
| 43 | George W. Bush | Republican | 4.5 | 3.5 | 6 | 2 | 4.5 | 2 | 1.5 | 8 | 2 | |
| 44 | Barack Obama | Democratic | 6 | 2 | 2 | 6 | 2 | 2 | 4 | 8 | 2 | |
| 45 | Donald Trump | Republican | 3 | 0 | 2 | 1 | 2 | 0 | 1 | 3 | 1 | |
| No. | President | President's Party | Senate with | Senate opposed | House with | House opposed | Congress with | Congress opposed | Congress divided | Years served | Elections won | |
See also
References
- "Would Divided Government Be Better?". Cato Institute. Archived from the original on 30 June 2011. Retrieved 20 September 2015.
- Moe, Terry (1989). "The Politics of Bureaucratic Structure". Retrieved 2016-05-04.
- "Party In Power - Congress and Presidency - A Visual Guide To The Balance of Power In Congress, 1945-2008". Uspolitics.about.com. Archived from the original on November 1, 2012. Retrieved September 17, 2012.
- "Chart of Presidents of the United States". Filibustercartoons.com. Retrieved September 17, 2012.
- "Composition of Congress by Party 1855–2013". Infoplease.com. Retrieved September 17, 2012.
- Clinton served the last 17 days of his 2nd term with a 50-50 majority in the senate with Al Gore being the tie breaker for the democrats after they won control in the 2000 elections until Republican Vice president Dick Cheney was sworn in and broke the tie in favor of the republicans.
Further reading
- Ansolabehere, S., Palmer, M., & Schneer, B. (2018). Divided Government and Significant Legislation: A History of Congress from 1789 to 2010. Social Science History, 42(1), 81-108.
- Morris Fiorina, Divided Government, 1996.
- David R. Mayhew, Divided We Govern, 1991.
| Presidents | |
|---|---|
| Professional careers | |
| Personal life | |
| Vice presidents | |
| Succession | |
| Elections | |
| Candidates |
|
| Families | |
| Namesakes, honors | |
| In fiction | |
| |