United States presidential approval rating
In the United States, presidential job approval ratings were introduced by George Gallup in the late 1930s (estimated to be 1937) to gauge public support for the president of the United States during their term. An approval rating is a percentage determined by a polling which indicates the percentage of respondents to an opinion poll who approve of a particular person or program. Typically, an approval rating is given to a politician based on responses to a poll in which a sample of people are asked whether they approve or disapprove of that particular political figure. A question might ask:
- Do you approve or disapprove of the way Donald Trump is handling his job as president?[1]
Like most surveys that measure opinions, individual poll results may be inaccurate. Many unscientific approval rating systems exist that show inaccurate statistics. Examples that self select, such as online questions are of this type. However, the aggregate approval rating is generally accepted by statisticians, as a statistically valid indicator of the comparative changes in the popular United States mood regarding a president.
President Donald Trump in 2018 had a job approval of approximately 81-91% with Republicans, 50-65% with Independents, and 43-56% with Democrats.[1] Gallup polling has found that, as of 2019, 47% of Americans are either "Democrats or Democratic leaners" while 42% are either "Republicans or Republican leaners".[2]
President Donald Trump
Most recent polls for President Donald Trump[3][4][5]
| Polling group | Date | Approval | Disapproval | Unsure | Net +/− | Sample size[5] | Population[5][6] |
|---|---|---|---|---|---|---|---|
| YouGov[7] | June 24–25, 2020 | 41% | 52% | 6% | –11% | 1,507 | All adults |
| Rasmussen Reports [lower-alpha 1][10] | June 23–25, 2020 | 44% | 53% | 3% | –9% | 1,500 | Likely voters |
| NPR/PBS NewsHour/Marist[11] | June 22–24, 2020 | 40% | 58% | 2% | –18% | 1,640 | All adults |
| Reuters/Ipsos | June 22–23, 2020 | 39% | 57% | 4% | –18% | 1,115 | All adults |
| CNBC/Hart Research/Pulse Opinion Research[12] | June 19–22, 2020 | 39% | 52% | 9% | –13% | 800 | Registered voters |
| The New York Times/Siena College[13] | June 17–22, 2020 | 41% | 56% | 3% | –15% | 1,337 | Registered voters |
| Politico/Morning Consult[14] | June 19–21, 2020 | 39% | 58% | 3% | –19% | 1,988 | Registered voters |
| Public Policy Polling (D)[15] | June 19–20, 2020 | 41% | 54% | 6% | –13% | 1,013 | Registered voters |
| American Research Group[16] | June 17–20, 2020 | 38% | 58% | 4% | –20% | 1,100 | All adults |
| Harris Poll[17] | June 17–18, 2020 | 43% | 57% | 0% | –14% | 1,886 | Registered voters |
| Fox News[lower-alpha 2][18] | June 13–16, 2020 | 44% | 55% | 1% | –11% | 1,343 | Registered voters |
| Quinnipiac University[19] | June 11–15, 2020 | 42% | 55% | 3% | –13% | 1,332 | Registered voters |
| Kaiser Family Foundation[lower-alpha 3][20] | June 8–14, 2020 | 40% | 56% | 3% | −16% | 1,296 | All adults |
| CNN[lower-alpha 4][21] | June 2–5, 2020 | 38% | 57% | 5% | −19% | 1,259 | All adults |
| Gallup Poll[lower-alpha 5][22] | May 28–June 4, 2020 | 39% | 57% | 4% | −18% | 1,034 | All adults |
| CBS News[lower-alpha 3][23] | May 29–June 2, 2020 | 40% | 54% | 6% | −14% | 1,309 | All adults |
| NBC News/Wall Street Journal[lower-alpha 6][24] | May 28–June 2, 2020 | 45% | 53% | 2% | −8% | 1,000 | Registered voters |
| Monmouth University[25] | May 28–June 1, 2020 | 42% | 54% | 4% | −12% | 807 | All adults |
Historical comparison
Historical Gallup Poll approval highs and lows for each president since 1937[26][27][28][lower-alpha 7]
| Order | President | Highest approval | Lowest approval | High – Low |
Highest disapproval | Highest margin | Lowest margin | Final poll | Approval average[26] |
Polls per year |
|---|---|---|---|---|---|---|---|---|---|---|
| 45[29][30][31][32] | Trump | 49 (2020-01-29, 2020-02-16, 2020-03-22, 2020-04-28, 2020-05-13)[29] | 35 (2017-8-27, 2017-10-29, 2017-12-03, 2017-12-17)[29] | 14 | 60 (2017-8-27, 2017-10-29, 2017-12-17, 2018-11-25) [29] | 4 (2020-03-22) [29] | −25 (2017-10-29, 2017-12-01) [29] | 39 (2020-06-04)[29] | 40 [29] | 40 |
| 44[33][34] | Obama | 67 (2009-01-25) | 40 (2014-09-05)[lower-alpha 8] | 27 | 55 (2014-06-22, 2014-10-12) | 26 (2009-01-23, 2009-01-24) | −18 (2014-10-10) | 59 (2017-01-19) | 47.9 | 48.4 |
| 43[35] | G. W. Bush | 90 (2001-9-21) | 25 (2008-10-05, 2008-10-12, 2008-11-02) | 65 | 71 (2008-10-10) | 83 (2001-09-22) | −46 (2008-10-12) | 34 (2009-01-11) | 49.4 | 33.7 |
| 42[36] | Clinton | 73 (1998-12-19) | 37 (1993-06-06) | 36 | 54 (1994-09-07) | 45 (2000-12-17) | −14 (1994-09-07) | 66 (2001-01-14) | 55.1 | 28.5 |
| 41[37] | G. H. W. Bush | 89 (1991-02-28) | 29 (1992-08-02, 1992-10-13) | 60 | 60 (1992-07-31) | 82 (1991-03-03) | −30 (1992-08-02, 1992-10-13) | 56 (1993-01-11) | 60.9 | 39.5 |
| 40[38] | Reagan | 71 (1986-01-30) | 35 (1983-01-31) | 36 | 56 (1983-01-28) | 52 (1986-01-30) | −21(1983-01-31) | 63 (1988-12-29) | 52.8 | 37.0 |
| 39[39] | Carter | 74 (1977-03-15) | 28 (1979-06-26, 1979-10-02) | 46 | 59 (1979-06-26) | 66 (1977-03-15) | −31 (1979-06-26) | 34 (1980-12-08) | 45.5 | 22.7 |
| 38[40] | Ford | 70 (1974-08-13) | 36 (1975-03-25) | 34 | 46 (1975-04-15, 1975-11-18) | 67 (1974-08-13) | −7 (1975-02-25, 1975-03-25, 1975-04-15) | 53 (1976-12-13) | 47.2 | 14.7 |
| 37[41] | Nixon | 66 (1973-01-23) | 24 (1974-01-02) | 42 | 66 (1974-08-05) | 57 (1969-03-17) | −42 (1974-08-05) | 24 (1974-08-05) | 49.1 | 17.7 |
| 36[42] | Johnson | 79 (1964-03-05) | 34 (1968-08-12) | 45 | 52 (1968-08-12) | 75 (1963-12-10) | −18 (1968-08-12) | 49 (1969-01-06) | 55.1 | 15.3 |
| 35[43] | Kennedy | 83 (1962-03-05) | 56 (1963-09-10) | 27 | 30 (1963-09-12, 1963-11-08) | 78 (1962-03-05) | 27 (1963-09-10) | 58 (1963-11-13) | 70.1 | 13.7 |
| 34[44] | Eisenhower | 77 (1955-11-22, 1956-12-19) | 47 (1958-03-25) | 30 | 36 (1958-03-25) | 66 (1953-04-02, 1956-12-19) | 12 (1958-03-25) | 59 (1960-12-13) | 65.0 | 14.4 |
| 33[45] | Truman | 91 (1945-08-22) | 22 (1951-11-16, 1952-02-14) | 69 | 67 (1952-01-06) | 85 (1945-08-22) | −43 (1952-01-04) | 32 (1952-12-16) | 45.4 | 8.4 |
| 32[46] | F. D. Roosevelt | 83 (1942-01-23) | 48 (1939-08-18) | 35 | 46 (1938-05-22, 1938-05-29, 1938-11-07) | 73 (1942-01-23) | 65 (1943-12-15) | 63 | 8 |
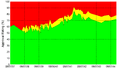
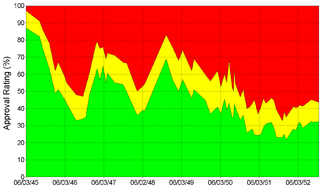
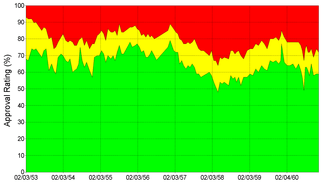
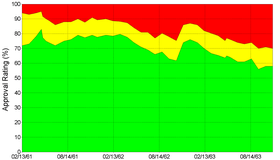
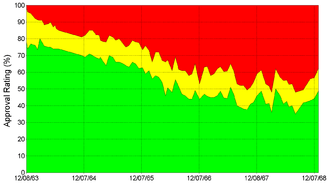
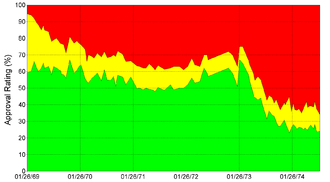
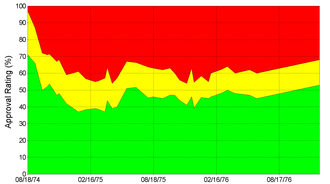
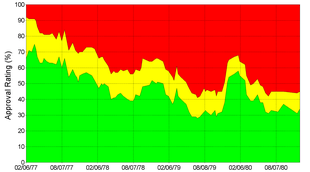
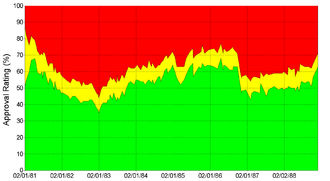
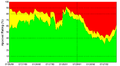
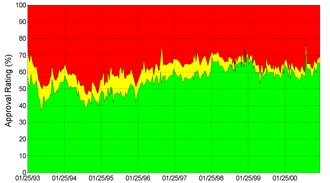
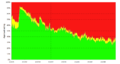
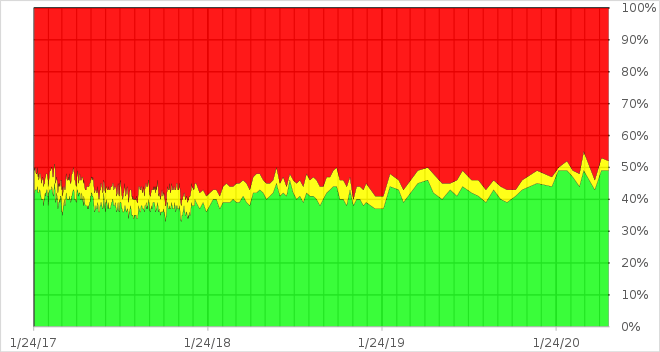
Graphs
| Gallup Poll graphs of approval ratings for presidents of the United States |

See also
- Historical rankings of Presidents of the United States
- Opinion polling on the Donald Trump administration
Notes
- Polls with a notable pro-Trump/Republican bias.[8][9]
- Conducted by Beacon Research (D) and Shaw & Company Research (R).
- Conducted by SSRS of Glen Mills, Pennsylvania.
- Conducted by SSRS.
- Monthly averages.
- Conducted by Hart Research Associates (D) and Public Opinion Strategies (R).
- Only the results of Gallup polls are included as no other poll results exist for presidents before President Clinton.
- Last of eight, sometimes overlapping, 3-day averages.
References
- "Presidential Approval Ratings – Donald Trump". Gallup. Retrieved February 13, 2017.
- Jeffrey M. Jones (January 7, 2020). "U.S. Party Preferences Steady During Trump Era". Gallup. Retrieved January 23, 2020.
- "President Trump: Job Ratings". PollingReport.com. Retrieved August 23, 2019.
- "President Trump Job Approval". RealClearPolitics. Retrieved December 26, 2018.
- "How (un)popular is Donald Trump?". fivethirtyeight.com. Retrieved December 26, 2018.
- Kennedy, Courtney; Deane, Claudia (February 16, 2017). "A basic question when reading a poll: Does it include or exclude nonvoters?". Pew Research Center.
- "Yahoo! News Race and Politics" (PDF). June 26, 2020.
- Blake, Aaron (September 17, 2012). "Rasmussen: The GOP's Cure for the Common Poll". The Washington Post.
- "Pollster: Rasmussen Research Has a pro-GOP Bias". The Hill. September 10, 2018.
- "Trump Approval Index History". June 21, 2020.
- "NPR/PBS NewsHour/Marist Poll" (PDF). June 24, 2020.
- "Standard Questionnaire Template" (PDF). June 19–22, 2020.
- "US0620 Crosstabs062420.xlsx" (PDF). June 17–22, 2020.
- "National tracking Poll #2006102". June 19–21, 2020.
- "National POC Memo Results, June 2020" (PDF). June 23, 2020.
- "Trump Job Approval Unchanged". June 22, 2020.
- "Harvard Caps: Harris Poll" (PDF). June 17–18, 2020.
- "Fox News Poll" (PDF). June 19, 2020.
- "Biden Ahead Of Trump By 8 Points In Presidential Race, Quinnipiac University National Poll Finds, Nearly 6 In 10 Support Vote By Mail In November". June 18, 2020.
- "KFF Health Tracking Poll – June 2020" (PDF). June 26, 2020.
- "CNN June 2020" (PDF). June 8, 2020.
- "Trump Job Approval". Retrieved January 10, 2018.
- "Americans' views shift on racial discrimination". June 4, 2020.
- "NBC News/Wall Street Journal Survey" (PDF). June 7, 2020.
- "Protestors' Anger Justified Even If Actions May Not Be". June 2, 2020.
- "Presidential Approval Ratings – Gallup Historical Statistics and Trends". Gallup. Retrieved August 16, 2011.
- Lydia Saad (March 29, 2017). "Trump's Approval Rating Unusually Low, Unusually Early". Gallup. Retrieved April 1, 2017.
- The American Presidency Project at UC Santa Barbara.
- "Gallup Daily: Trump Job Approval". Gallup. Retrieved January 27, 2017.
- "Trump Job Approval (Weekly)". Gallup. Retrieved January 22, 2018.
- "Presidential Approval Ratings -- Donald Trump". Gallup. Retrieved October 9, 2018.
- Jeffrey M. Jones (April 24, 2018). "Trump's Fifth-Quarter Job Approval Up; Still Historically Low". Gallup.
- Graphical display and numbers of Gallup "daily tracking" polls
- "Presidential Approval Ratings -- Barack Obama".
- "Gallup.com". Gallup.com. Retrieved August 16, 2011.
- "Presidential Approval Ratings -- Bill Clinton". gallup.com. Retrieved January 26, 2017.
- "Presidential Job Approval for George H. W. Bush". American Presidency Project.
- "Presidential Job Approval for Ronald Reagan". American Presidency Project.
- "Presidential Job Approval for Jimmy Carter". American Presidency Project.
- "Presidential Job Approval for Gerald Ford". American Presidency Project.
- "Presidential Job Approval for Richard Nixon". American Presidency Project.
- "Presidential Job Approval for Lyndon B. Johnson". American Presidency Project.
- "Presidential Job Approval for John F. Kennedy". American Presidency Project.
- Presidential Job Approval for "Dwight D. Eisenhower". American Presidency Project.
- "Presidential Job Approval for Harry S. Truman". American Presidency Project.
- "Presidential Job Approval for Franklin D. Roosevelt". American Presidency Project.
External links
- "Historical Presidential Job Performance Ratings". Roper Center.
- "Trump approval ratings". FiveThirtyEight.
- "Midterm Presidential Approval Ratings". Data360.
- "President Job Approval Ratings". PresidentPollsUSA.
- "Historical Presidential Approval Ratings 1945–2009". The Wall Street Journal.
- "President Obama's Ongoing Job Approval". (CongressRatings)
| Presidents | |
|---|---|
| Professional careers | |
| Personal life | |
| Vice presidents | |
| Succession | |
| Elections | |
| Candidates |
|
| Families | |
| Namesakes, honors | |
| In fiction | |
| |