List of United States presidential elections by popular vote margin
In a United States presidential election, the popular vote is the total number or percentage of votes cast for a candidate by voters in the 50 states and Washington, D.C.; the candidate who gets the most votes nationwide is said to have won the popular vote. However, the popular vote is not used to determine who is elected as the nation's president or vice president. Thus it is possible for the winner of the popular vote to end up losing the election, an outcome that has occurred on five occasions, most recently in the 2016 election. This is because presidential elections are indirect elections; the votes cast on Election Day are not cast directly for a candidate, but for members of the Electoral College. The Electoral College's electors then formally elect the president and vice president.[2][3] The Twelfth Amendment to the United States Constitution provides the procedure by which the president and vice president are elected.
List
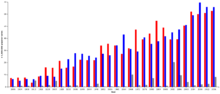
The table below is a list of United States presidential elections by popular vote margin. It is sorted to display elections by their presidential term / year of election, name, margin by percentage in popular vote, popular vote, margin in popular vote by number, and the runner up in the Electoral College.
| Election | Winner & party | Electoral College | Popular vote | Runner-up & party | Turnout[4] | |||||||
|---|---|---|---|---|---|---|---|---|---|---|---|---|
| Votes | % | % | Margin | Votes | Margin | |||||||
|
Democratic-Republican
Democratic
Republican
Whig
Progressive
Liberal Republican
National Republican
Federalist
Independent
| ||||||||||||
| 1 | 1788-89 | George Washington | Ind. | 69/69 | 100.00% | 100.00% | 100.00% | 43,782 | 43,782 | No candidate | None | 11.6% |
| 2 | 1792 | George Washington | Ind. | 132/132 | 100.00% | 100.00% | 100.00% | 28,579 | 28,579 | No candidate | None | 6.3% |
| 3 | 1796 | John Adams | Fed. | 71/138 | 51.45% | 53.45% | 6.90% | 35,726 | 4,611 | Thomas Jefferson | D.-R. | 20.1% |
| 4 | 1800 | Thomas Jefferson | D.-R. | 73/138 | 52.90% | 61.43% | 22.86% | 41,330 | 15,378 | John Adams | Fed. | 32.3% |
| 5 | 1804 | Thomas Jefferson | D.-R. | 162/176 | 92.05% | 72.79% | 45.58% | 104,110 | 65,191 | Charles C. Pinckney | Fed. | 23.8% |
| 6 | 1808 | James Madison | D.-R. | 122/175 | 69.72% | 64.73% | 32.33% | 124,732 | 62,301 | Charles C. Pinckney | Fed. | 36.8% |
| 7 | 1812 | James Madison | D.-R. | 128/217 | 58.99% | 50.37% | 2.74% | 140,431 | 7,650 | DeWitt Clinton | D.-R.[Note 1] | 40.4% |
| 8 | 1816 | James Monroe | D.-R. | 183/217 | 84.33% | 68.16% | 37.24% | 76,592 | 41,852 | Rufus King | Fed. | 23.5% |
| 9 | 1820 | James Monroe | D.-R. | 231/232 | 99.57% | 80.61% | 64.69% | 87,343 | 69,878 | No candidate | Fed. | 10.1% |
| 10 | 1824 | John Quincy Adams | D.-R. | 84/261 | 32.18% | 30.92% | −10.44% | 113,142 | −38,221 | Andrew Jackson | D.-R. | 26.9% |
| 23 | 1876 | Rutherford Hayes | Rep. | 185/369 | 50.14% | 47.92% | −3.00% | 4,034,142 | −252,666 | Samuel Tilden | Dem. | 82.6% |
| 58 | 2016 | Donald Trump | Rep. | 304/538 | 56.50% | 46.09% | −2.09% | 62,984,828 | −2,868,686 | Hillary Clinton | Dem. | 60.2% |
| 26 | 1888 | Benjamin Harrison | Rep. | 233/401 | 58.10% | 47.80% | −0.83% | 5,443,892 | −90,596 | Grover Cleveland | Dem. | 80.5% |
| 54 | 2000 | George W. Bush | Rep. | 271/538 | 50.37% | 47.87% | −0.51% | 50,460,110 | −543,816 | Al Gore | Dem. | 54.2% |
| 24 | 1880 | James Garfield | Rep. | 214/369 | 57.99% | 48.31% | 0.09% | 4,453,337 | 1,898 | Winfield Scott Hancock | Dem. | 80.5% |
| 44 | 1960 | John Kennedy | Dem. | 303/537 | 56.42% | 49.72% | 0.17% | 34,220,984 | 112,827 | Richard Nixon | Rep. | 63.8% |
| 25 | 1884 | Grover Cleveland | Dem. | 219/401 | 54.61% | 48.85% | 0.57% | 4,914,482 | 57,579 | James Blaine | Rep. | 78.2% |
| 46 | 1968 | Richard Nixon | Rep. | 301/538 | 55.95% | 43.42% | 0.70% | 31,783,783 | 511,944 | Hubert Humphrey | Dem. | 62.5% |
| 15 | 1844 | James Polk | Dem. | 170/275 | 61.82% | 49.54% | 1.45% | 1,339,570 | 39,413 | Henry Clay | Whig | 79.2% |
| 48 | 1976 | Jimmy Carter | Dem. | 297/538 | 55.20% | 50.08% | 2.06% | 40,831,881 | 1,683,247 | Gerald Ford | Rep. | 54.8% |
| 55 | 2004 | George W. Bush | Rep. | 286/538 | 53.16% | 50.73% | 2.46% | 62,040,610 | 3,012,171 | John Kerry | Dem. | 60.1% |
| 27 | 1892 | Grover Cleveland | Dem. | 277/444 | 62.39% | 46.02% | 3.01% | 5,553,898 | 363,099 | Benjamin Harrison | Rep. | 75.8% |
| 33 | 1916 | Woodrow Wilson | Dem. | 277/531 | 52.17% | 49.24% | 3.12% | 9,126,868 | 578,140 | Charles Evans Hughes | Rep. | 61.8% |
| 57 | 2012 | Barack Obama | Dem. | 332/538 | 61.71% | 51.06% | 3.86% | 65,915,795 | 4,982,291 | Mitt Romney | Rep. | 58.6% |
| 28 | 1896 | William McKinley | Rep. | 271/447 | 60.63% | 51.02% | 4.31% | 7,112,138 | 601,331 | William Jennings Bryan | Dem. | 79.6% |
| 41 | 1948 | Harry Truman | Dem. | 303/531 | 57.06% | 49.55% | 4.48% | 24,179,347 | 2,188,055 | Thomas Dewey | Rep. | 52.2% |
| 16 | 1848 | Zachary Taylor | Whig | 163/290 | 56.21% | 47.28% | 4.79% | 1,360,235 | 137,882 | Lewis Cass | Dem. | 72.8% |
| 21 | 1868 | Ulysses Grant | Rep. | 214/294 | 72.79% | 52.66% | 5.32% | 3,013,790 | 304,810 | Horatio Seymour | Dem. | 80.9% |
| 52 | 1992 | Bill Clinton | Dem. | 370/538 | 68.77% | 43.01% | 5.56% | 44,909,806 | 5,805,256 | George H. W. Bush | Rep. | 58.1% |
| 14 | 1840 | William Henry Harrison | Whig | 234/294 | 79.59% | 52.87% | 6.05% | 1,275,583 | 145,938 | Martin Van Buren | Dem. | 80.3% |
| 29 | 1900 | William McKinley | Rep. | 292/447 | 65.23% | 51.64% | 6.12% | 7,228,864 | 857,932 | William Jennings Bryan | Dem. | 73.7% |
| 17 | 1852 | Franklin Pierce | Dem. | 254/296 | 85.81% | 50.83% | 6.95% | 1,605,943 | 219,525 | Winfield Scott | Whig | 69.5% |
| 56 | 2008 | Barack Obama | Dem. | 365/538 | 67.84% | 52.93% | 7.27% | 69,498,516 | 9,550,193 | John McCain | Rep. | 61.6% |
| 40 | 1944 | Franklin Roosevelt | Dem. | 432/531 | 81.36% | 53.39% | 7.50% | 25,612,916 | 3,594,987 | Thomas Dewey | Rep. | 55.9% |
| 51 | 1988 | George H. W. Bush | Rep. | 426/538 | 79.18% | 53.37% | 7.72% | 48,886,597 | 7,077,121 | Michael Dukakis | Dem. | 52.8% |
| 53 | 1996 | Bill Clinton | Dem. | 379/538 | 70.45% | 49.23% | 8.51% | 47,400,125 | 8,201,370 | Bob Dole | Rep. | 51.7% |
| 31 | 1908 | William Taft | Rep. | 321/483 | 66.46% | 51.57% | 8.53% | 7,678,335 | 1,269,356 | William Jennings Bryan | Dem. | 65.7% |
| 49 | 1980 | Ronald Reagan | Rep. | 489/538 | 90.89% | 50.75% | 9.74% | 43,903,230 | 8,423,115 | Jimmy Carter | Dem. | 54.2% |
| 39 | 1940 | Franklin Roosevelt | Dem. | 449/531 | 84.56% | 54.74% | 9.96% | 27,313,945 | 4,966,201 | Wendell Willkie | Rep. | 62.4% |
| 20 | 1864 | Abraham Lincoln | Rep. | 212/233 | 90.99% | 55.03% | 10.08% | 2,211,317 | 405,090 | George McClellan | Dem. | 76.3% |
| 19 | 1860 | Abraham Lincoln | Rep. | 180/303 | 59.41% | 39.65% | 10.13% | 1,855,993 | 474,049 | John Breckinridge | Dem. | 81.8% |
| 42 | 1952 | Dwight Eisenhower | Rep. | 442/531 | 83.24% | 55.18% | 10.85% | 34,075,529 | 6,700,439 | Adlai Stevenson | Dem. | 62.3% |
| 22 | 1872 | Ulysses Grant | Rep. | 286/352 | 81.25% | 55.58% | 11.80% | 3,597,439 | 763,729 | Horace Greeley | L. R. | 72.1% |
| 18 | 1856 | James Buchanan | Dem. | 174/296 | 58.78% | 45.29% | 12.20% | 1,835,140 | 494,472 | John Frémont | Rep. | 79.4% |
| 11 | 1828 | Andrew Jackson | Dem. | 178/261 | 68.20% | 55.93% | 12.25% | 642,806 | 140,839 | John Quincy Adams | N. R. | 57.3% |
| 13 | 1836 | Martin Van Buren | Dem. | 170/294 | 57.82% | 50.79% | 14.20% | 763,291 | 213,384 | William Henry Harrison | Whig | 56.5% |
| 32 | 1912 | Woodrow Wilson | Dem. | 435/531 | 81.92% | 41.84% | 14.44% | 6,296,284 | 2,173,563 | Theodore Roosevelt | Prog. | 59.0% |
| 43 | 1956 | Dwight Eisenhower | Rep. | 457/531 | 86.06% | 57.37% | 15.40% | 35,579,180 | 9,551,152 | Adlai Stevenson | Dem. | 60.2% |
| 36 | 1928 | Herbert Hoover | Rep. | 444/531 | 83.62% | 58.21% | 17.41% | 21,427,123 | 6,411,659 | Al Smith | Dem. | 56.9% |
| 37 | 1932 | Franklin Roosevelt | Dem. | 472/531 | 88.89% | 57.41% | 17.76% | 22,821,277 | 7,060,023 | Herbert Hoover | Rep. | 56.9% |
| 12 | 1832 | Andrew Jackson | Dem. | 219/286 | 76.57% | 54.74% | 17.81% | 702,735 | 228,628 | Henry Clay | N. R. | 57.0% |
| 50 | 1984 | Ronald Reagan | Rep. | 525/538 | 97.58% | 58.77% | 18.21% | 54,455,472 | 16,878,120 | Walter Mondale | Dem. | 55.2% |
| 30 | 1904 | Theodore Roosevelt | Rep. | 336/476 | 70.59% | 56.42% | 18.83% | 7,630,557 | 2,546,677 | Alton Brooks Parker | Dem. | 65.5% |
| 45 | 1964 | Lyndon Johnson | Dem. | 486/538 | 90.33% | 61.05% | 22.58% | 43,127,041 | 15,951,287 | Barry Goldwater | Rep. | 62.8% |
| 47 | 1972 | Richard Nixon | Rep. | 520/538 | 96.65% | 60.67% | 23.15% | 47,168,710 | 17,995,488 | George McGovern | Dem. | 56.2% |
| 38 | 1936 | Franklin Roosevelt | Dem. | 523/531 | 98.49% | 60.80% | 24.26% | 27,752,648 | 11,070,786 | Alf Landon | Rep. | 61.0% |
| 35 | 1924 | Calvin Coolidge | Rep. | 382/531 | 71.94% | 54.04% | 25.22% | 15,723,789 | 7,337,547 | John Davis | Dem. | 48.9% |
| 34 | 1920 | Warren Harding | Rep. | 404/531 | 76.08% | 60.32% | 26.17% | 16,144,093 | 7,004,432 | James Cox | Dem. | 49.2% |
Note: The popular vote was not recorded prior to the 1824 election, so the first nine US presidential elections are not included in this table. Until the 1864 election, some states chose their Presidential electors without a popular vote, so results from 1824 to 1860 are not truly nationwide values.
Timeline
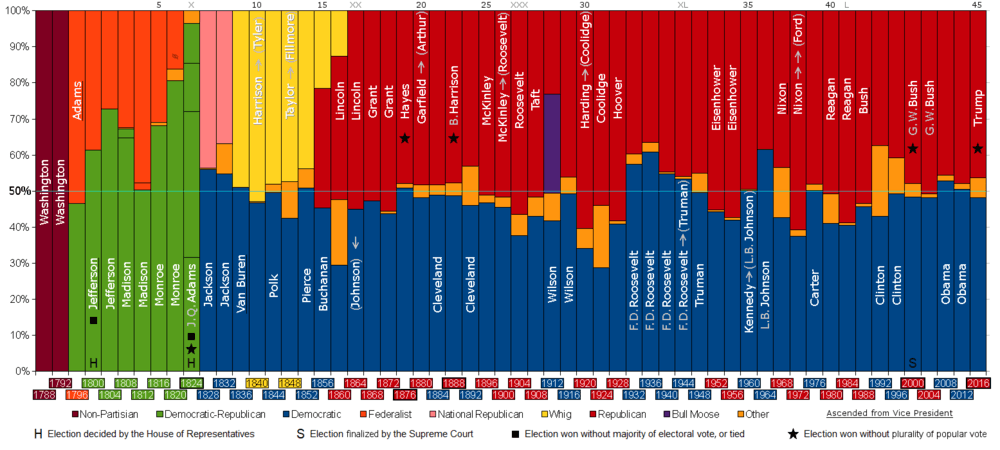
A gray arrow points to the name of a person who became president without having been elected as president (9 total). The double arrow indicates becoming president without having been elected as vice president as well (Ford). 5 other former vice presidents are underlined (14 total). The top line indicates the Presidency number (e.g. Reagan: 40th) with Roman numerals indicating election (and term) number.
See also
Notes
- While commonly labeled as the Federalist candidate, Clinton technically ran as a Democratic-Republican and was not nominated by the Federalist party itself, the latter simply deciding not to field a candidate. This did not prevent endorsements from state Federalist parties (such as in Pennsylvania), but he received the endorsement from the New York state Democratic-Republicans as well
References
- "Dave Leip's Atlas of U.S. Presidential Elections". uselectionatlas.org. Retrieved 12 November 2017.
- "Clinton on pace to win popular vote despite losing election". CBS News. November 9, 2016. Retrieved March 31, 2019.
- Bostedt, Shelbie Lynn (November 9, 2016). "How it happened: Clinton wins popular vote but loses Election". RedEye. Chicago Tribune. Retrieved March 31, 2019.
- McDonald, Michael P. (11 June 2014). "National General Election VEP Turnout Rates, 1789-Present". United States Elections Project. Retrieved 16 November 2016.
- Leip, David. Dave Leip's Atlas of U.S. Presidential Elections.
- Peters, Gerhard. Voter Turnout in Presidential Elections.
External links
- How close were U.S. Presidential Elections? - Michael Sheppard, Massachusetts Institute of Technology
| Presidents | |
|---|---|
| Professional careers | |
| Personal life | |
| Vice presidents | |
| Succession | |
| Elections | |
| Candidates |
|
| Families | |
| Namesakes, honors | |
| In fiction | |
| |